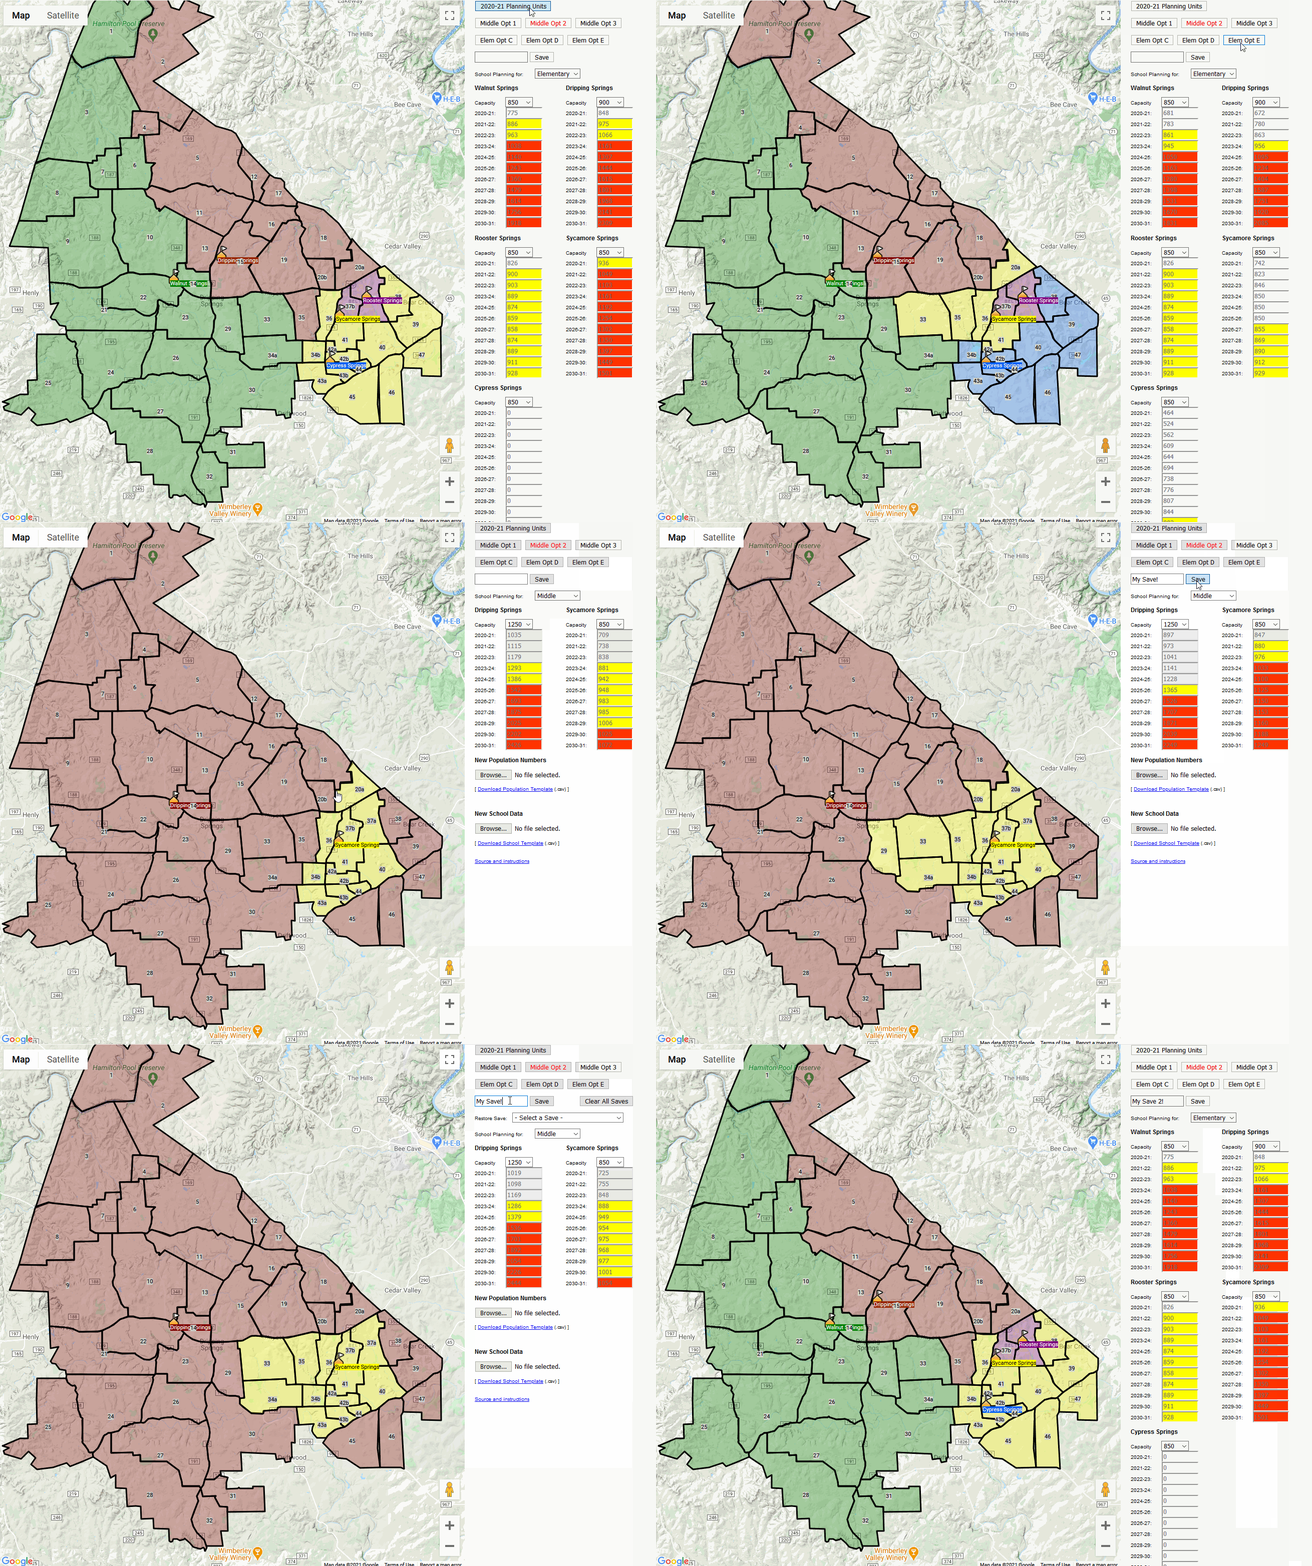
In 2017, the DSISD district was debating when adopting a new elementary school map. Many individuals came out to argue in favor/against who should go to the "new" school. It became clear that the easiest way for me to argue in favor of one map plan over another was to visualize it. As a software developer, this problem was my nail and I was the hammer. The end result was a very pretty, but very specific jQuery/.js website.
Fast forward to 2018. Dr. Gearing asked me to "do the same thing" for the Middle Schools. I attempted to edit the previous map to suit the MS needs, but it wasn’t going too well. I had been working with React.js at work and I wanted some practice. This project was born! It wasn’t quite as pretty; however, the underlying "framework" is much more modular providing the ability to adapt for the future.
Once again in 2019 there was a need for more maps. I’ve updated the population data (provided by Dr. Gearing) and added the ability to filter by school type (Elementary/Middle/High).
This brings us to today, and the latest installment of the maps (2021). Cypress Springs is coming! Middle school zoning is in flux. Visualize it all once again!
-
Left Click on a Planning Unit to rotate which school it is assigned to
-
You’ll notice that the population numbers will automatically adjust on the right hand panel
-
Yellow means that the school is between 100% and 120% of the total capacity
-
Red means that the school is above 120% capacity and is considered "full"
-
-
Click the button "2018-19 Planning Units" to reset the data to today’s assignments
-
Save your progress by clicking the "Save" button
-
You can provide a save name by typing into the box to the left of the "Save" button. If you don’t provide one, the save will be titled by the school planning type (Ex/ Elementary) along with the Date & Time.
-
Restore your save by selecting it in the dropdown menu. Warning: This will reset the map; make sure to save your progress!
-
Switch between the school planning type by changing the dropdown labeled "School Planning for: " Warning: This will reset the map; make sure to save your progress!
-
-
You can provide your own custom data!
-
Scroll to the bottom of the right side bar
-
Click on the links to download copies of the .csv data import files used by the application. These can serve as a template for you to edit.
-
Upload new custom data files using the appropriately labeled buttons.
-
The new maps should use your newly updated data!
-
There is very little (read: none) error handling, so make sure the format of the upgrade file is the same or you’ll get nasty messages from the application.
-
For schools, you can simply add new rows or update information on the existing ones. Make sure the "id" is unique for any new school added. Blank lines are automatically skipped. New columns will be ignored. Capacities should match one of: 850, 900, 1250 or 2000. These are hard-coded in the app (convenience). If you provide a different capacity, it will work, but the dropdown to change won’t be usable.
-
For population data, the PU column is not editable (don’t add new planning units — the GIS data would need to be updated to allow that). In general, simply edit the population numbers to follow the same format that currently exists. If you add additional columns, follow the same 2nd row header format (EE-5th, 6th-8th, etc) and add a new 1st row header for the year. Adding new years will automatically adjust which years are visible in the applicatoin.
-
Find a bug? Have an idea for improvement? Let me know: david@trumpetx.com.
