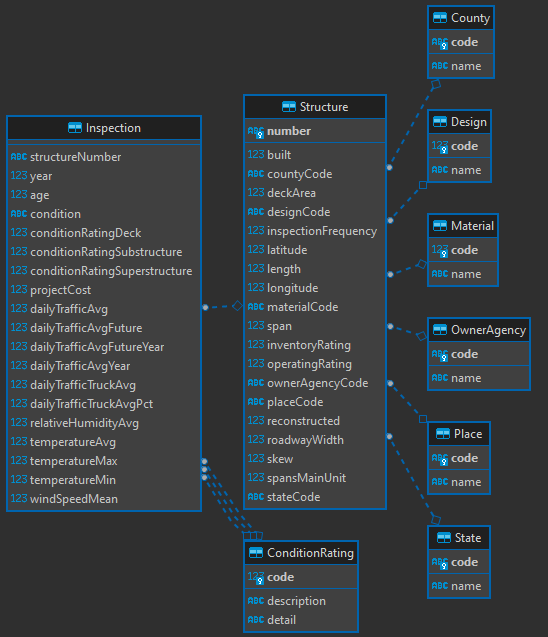
The scripts and instructions in this project set up a highly-optimized SQL database for exploring a large dataset of bridge inspections in the U.S. state of Georgia. Sample SQL queries are provided which perform various data manipulations including filtering, sorting, grouping, aggregations, and joining multiple tables to gather interesting insights from the data.
The National Bridge Inventory (NBI) data from 1990 to 2022 for various bridges in the state of Georgia, USA retrieved from https://www.kaggle.com/datasets/cynthiamengyuanli/nbi-data-1990-2022
Go to INSIGHTS - a collection of SQL queries I wrote which can provide insights into this data that could be relevant to real-world applications.
- Data Exploration: I began by performing an initial exploration of the dataset. I identified the various tables and entities present and worked to understand the relationships between them. I familiarize myself with the data's structure, data types, and any potential data quality issues.
- Data Cleaning and Preparation: I wrote code to preprocess the data in a reproducible manner, so the data could be refreshed at any time. At this stage, I handled missing values, duplicate records, and any inconsistencies. This step was crucial as it set the foundation for accurate analysis.
- Database Design: I create an appropriate database schema to store the data efficiently. I designed tables that reflect the relationships between different entities in the dataset. I gave consideration for indexing and optimizing the schema for the types of queries users might want to perform.
- Documentation: Along the way, I wrote comments in the code and kept notes for myself. Once the project was working, I got to work writing clear documentation, explaining the dataset, the database schema, the SQL queries I’ve written, and the insights I’ve gained.
- Data Manipulation: I wrote write SQL queries to perform various data manipulations including filtering, sorting, grouping, aggregations, and joining multiple tables to gather valuable insights from the data.
- Insights: Using those queries, I derived meaningful insights from the data. I tried to explore the dataset from different angles to extract valuable information that could be relevant to real-world problems.
- Performance Optimization: I optimized query performance where possible. Using indexes and tweaks to the queries themselves, I improved the speed and efficiency of certain queries.
- Node.js
- A copy of the National Bridge Inventory (NBI) data from 1990 to 2022 for various bridges in the state of Georgia
Clone this repository (or download the files from GitHub's web UI)
git clone https://github.com/travishorn/nbi-data-analysisChange into the directory
cd nbi-data-analysisInstall the dependencies
npm installMigrate the database
npx knex migrate:latestThis will create db.sqlite3 with a highly-optimized schema for this dataset.
Seed the database
npx knex seed:runThis will insert data related to NBI's condition rating system and some metadata into the database.
The source file from Kaggle should be called BridgesExport_AllYear.csv.
Place the file in the source-data directory.
Load the data from the source file
node src/load-data.jsIt may take a moment. This script is doing a lot of extraction and
transformation before loading the data into the database. Very strict checks and
foreign keys are applied to the imported data. If the structure of the source
data has changed since the creation of this project, you may need to adjust the
code in src/load-data.js.
When the script finishes, a SQLite database at db.sqlite3 will be full of
bridge data from the source dataset.
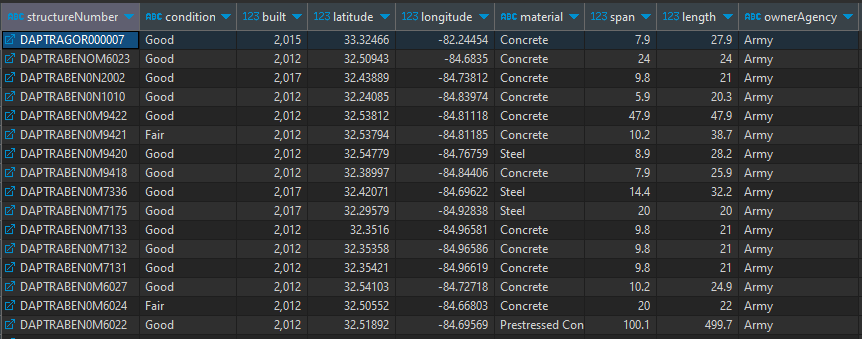
Explore the data using SQL. Here is an example:
SELECT        i.structureNumber,
              i.condition,
              s.built,
              s.latitude,
              s.longitude,
              m.name material,
              s.span,
              s.length,
              oa.name ownerAgency
FROM          Inspection i
JOIN          Structure s
ON            s.number = i.structureNumber
JOIN          Material m
ON            m.code = s.materialCode
JOIN          OwnerAgency oa
ON            oa.code = s.ownerAgencyCode
WHERE         i.year = 2022
AND           s.built >= 2012
ORDER BY      i.structureNumber DESC
You can get more information about each column from the Metadata table.
SELECT    m.*
FROM      Metadata m
WHERE m.`table` = 'Inspection'The MIT License
Copyright 2023 Travis Horn
Permission is hereby granted, free of charge, to any person obtaining a copy of this software and associated documentation files (the “Software”), to deal in the Software without restriction, including without limitation the rights to use, copy, modify, merge, publish, distribute, sublicense, and/or sell copies of the Software, and to permit persons to whom the Software is furnished to do so, subject to the following conditions:
The above copyright notice and this permission notice shall be included in all copies or substantial portions of the Software.
THE SOFTWARE IS PROVIDED “AS IS”, WITHOUT WARRANTY OF ANY KIND, EXPRESS OR IMPLIED, INCLUDING BUT NOT LIMITED TO THE WARRANTIES OF MERCHANTABILITY, FITNESS FOR A PARTICULAR PURPOSE AND NONINFRINGEMENT. IN NO EVENT SHALL THE AUTHORS OR COPYRIGHT HOLDERS BE LIABLE FOR ANY CLAIM, DAMAGES OR OTHER LIABILITY, WHETHER IN AN ACTION OF CONTRACT, TORT OR OTHERWISE, ARISING FROM, OUT OF OR IN CONNECTION WITH THE SOFTWARE OR THE USE OR OTHER DEALINGS IN THE SOFTWARE.


