I created this multiuser application to provide users with a way of viewing statistical data while making sure that the user interface is intuitive. I was able to achieve this using Python and the library Tkinter. My application provides users with the option to view selected data from a remote database in a variety of graph types. Below is what the final product looks like.
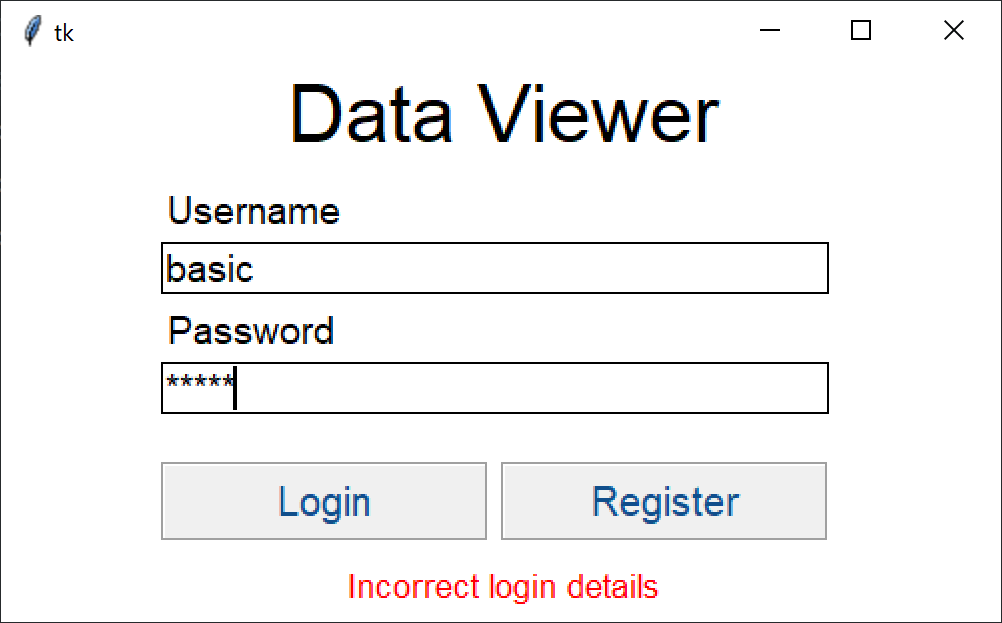
Before a user can access the application, they must login. When a user logs in, their credentials are checked against the JSON object login table in the database, using a MySQL style GET method URL. This database allows me to retrieve and store data using MySQL command styled GET methods. This remote storage database solution allows me to create tables, fields and records.
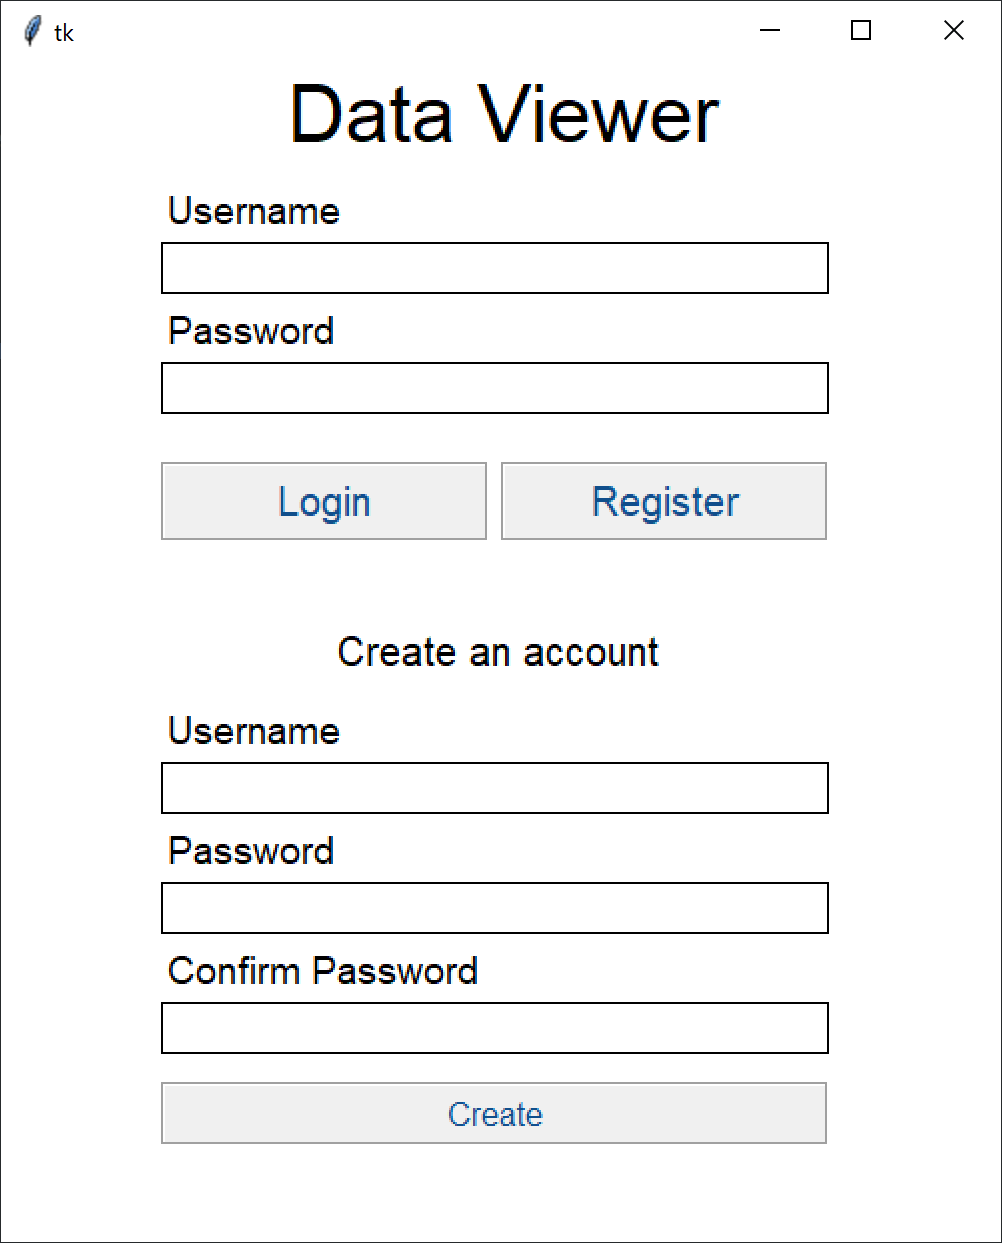
If a user wishes to create an account, they can register for one. Once a user submits their registration details, the details are checked against the JSON Object login table of the database.
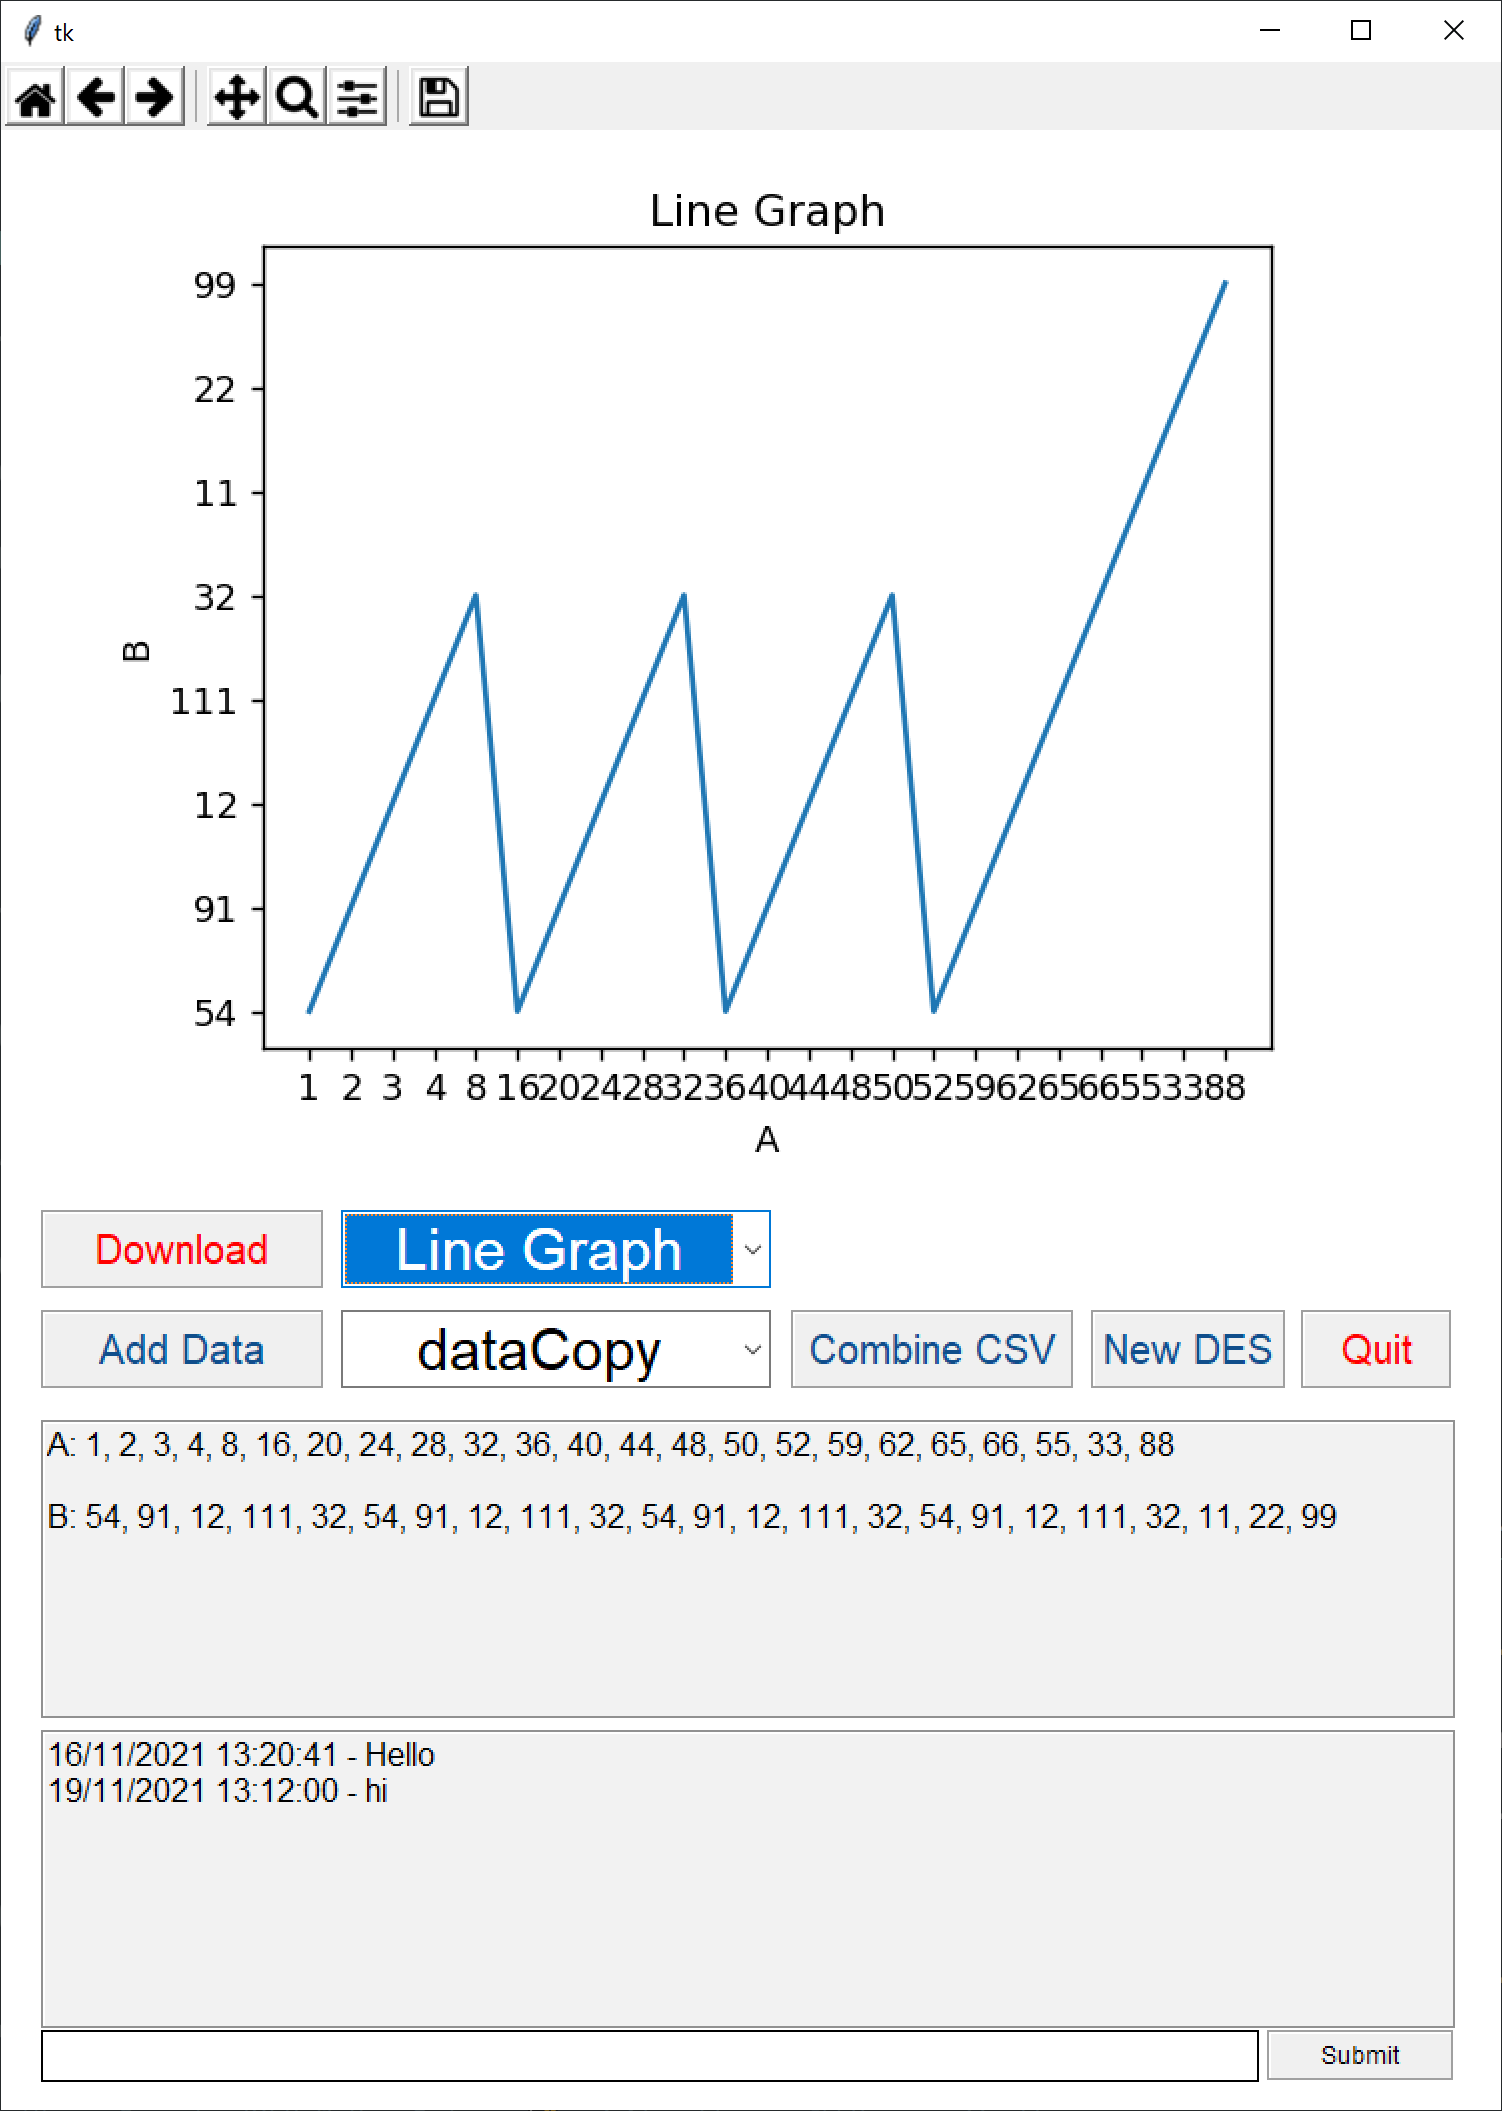
Here users are provided with full access of the database. Users have the following features:
Graph - The graph shown is an interactive graph using a library called matplotlib. Users can use the toolbar provided to interact with graph. Features include, zoom, pan and screenshots.
Chat - Here users can chat with other users who are using the application. Each chat message is saved to the remote database. The chat output box refreshes frequently, which is also ran on a separate thread to the application.
Data Source - Here users select a data source from the a combo box, that lists every data source saved on the remote storage.
Add Data Source - Here users upload a data source to the remote database. The data source uploaded must be a csv file format.
Download - Provides users with the ability to download the data source selected as a csv file.
Combine CSV - Allows users to combine local csv files, to create a csv file that can then be uploaded to the remote database.
Graph Type - Here users select how they wish to view the data stored.
Additional Data Explorer Screens - Here users can have multiple screens, giving them the ability to view different data sources at the same time.
Data Summary - Here users can view the header and data of the data source.
Quit - Here users exit from the application.