Stream and visualize plethysmogram (PPG) data from Wellue Bluetooth Pulse Oximeter using Pygatt and Lab Streaming Layer (LSL)
- Wellue Bluetooth Pulse Oximeter: To collect pulse oximetry data.
- BLED112 USB dongle: Because most computers do not have a built-in Bluetooth Low Energy (BLE) radio.
- The basics: python, numpy, matplotlib, scipy.
pygatt: To connect to the BLE device.pylsl: the interface to the Lab Streaming Layer (LSL), a protocol for real-time streaming of biosignal over a network. Here is their documentation. Here are some example code. Here is a YouTube tutorial on LSL.
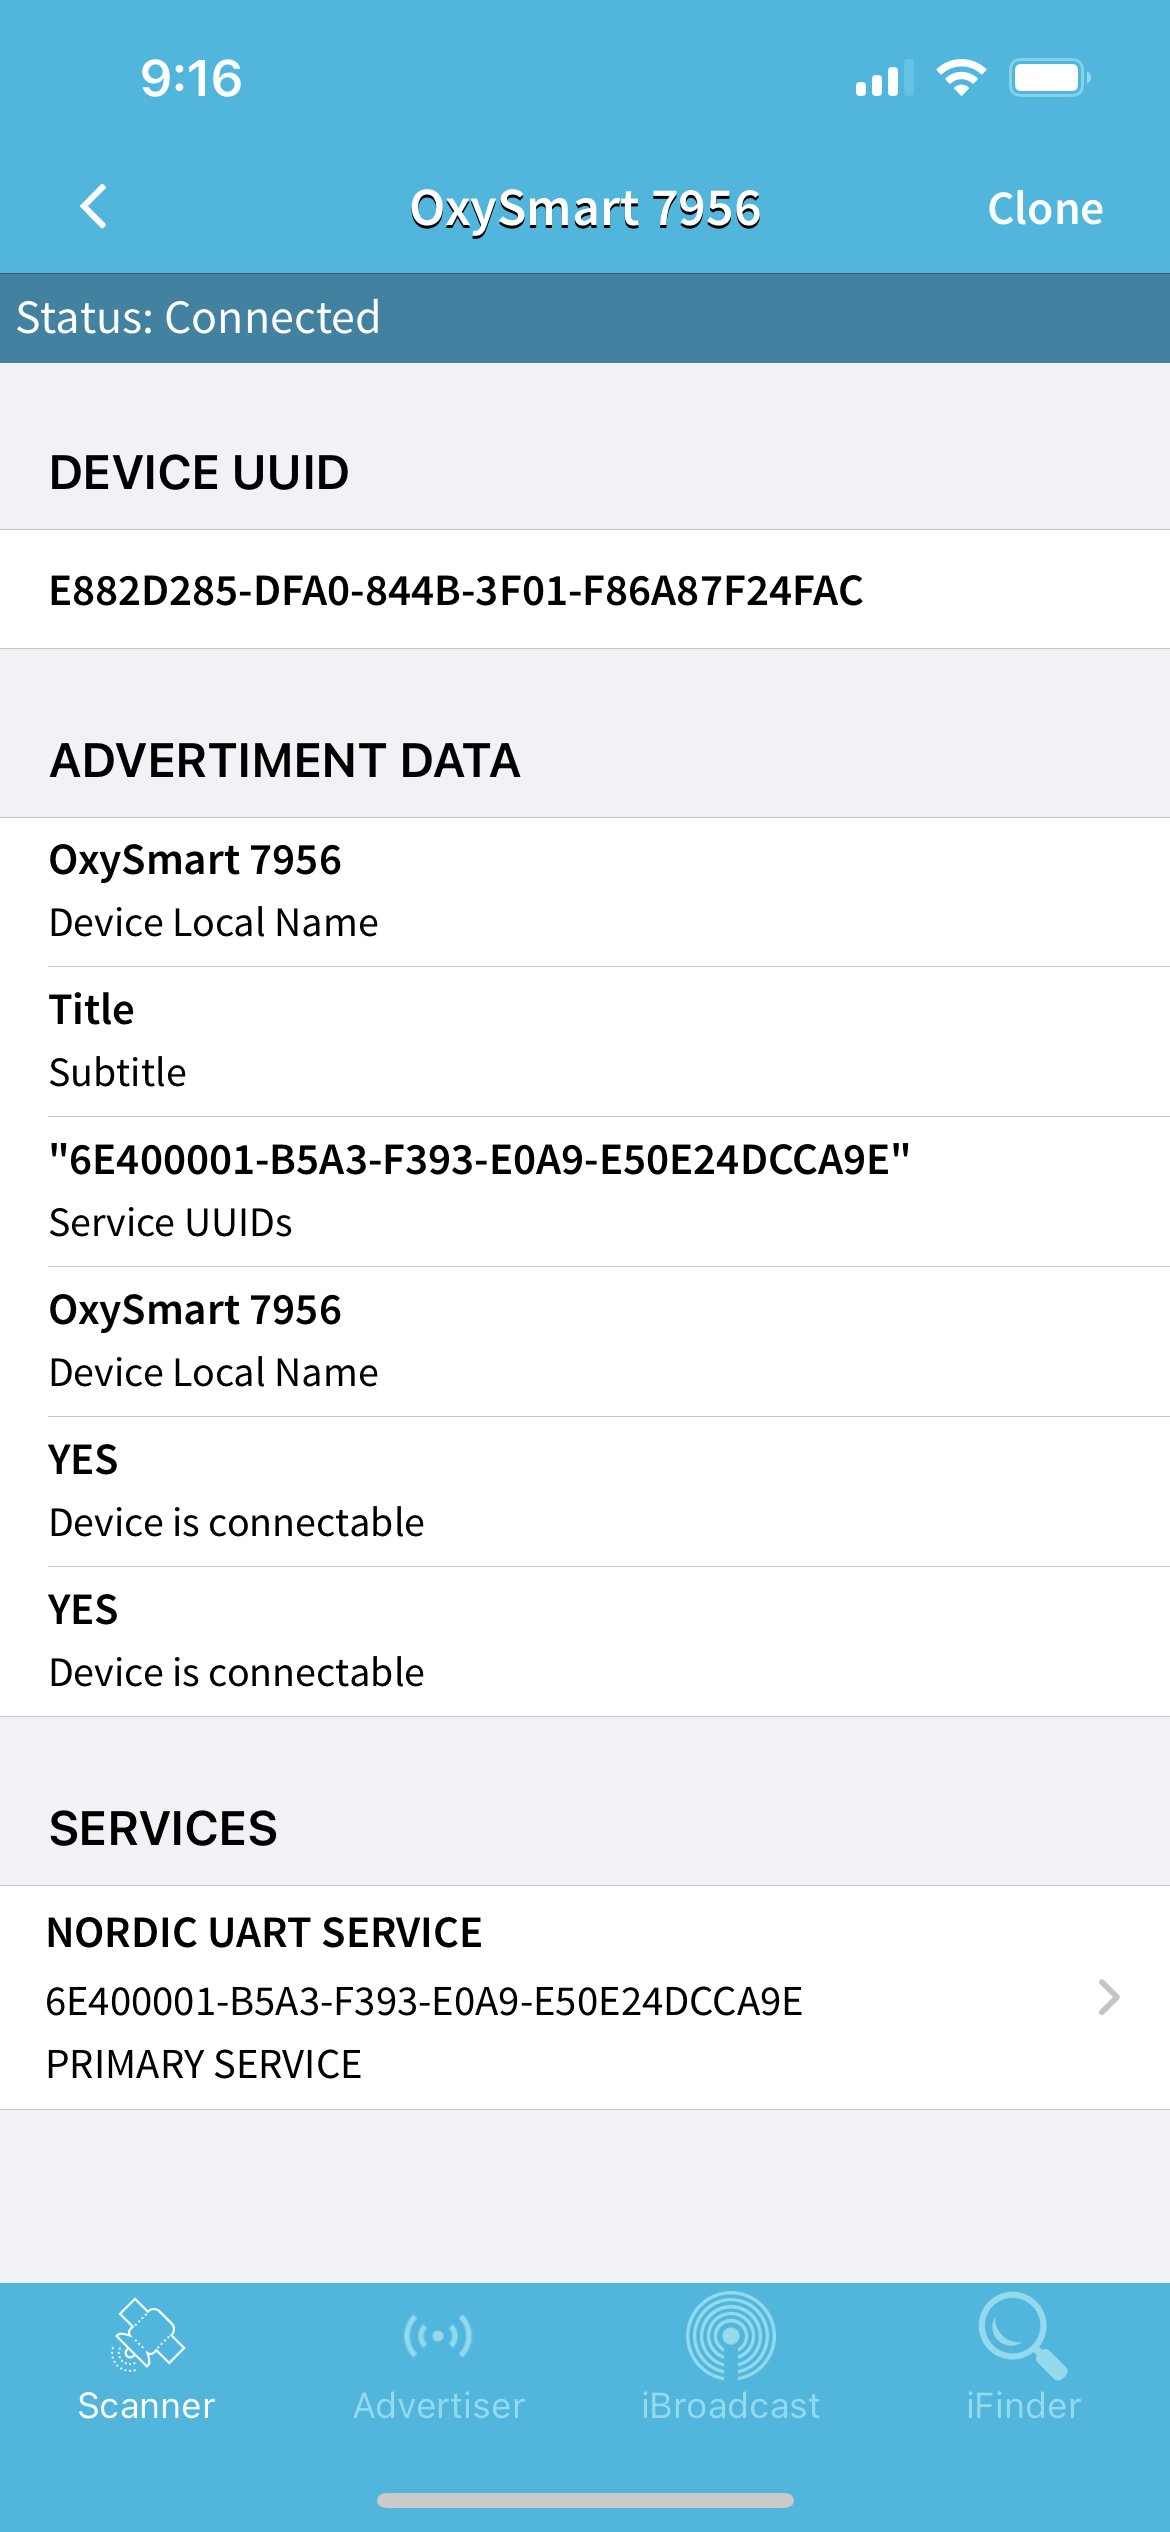
Before we start, we must get the UUIDs of the services of the pulse oximeter. We can download the "BLE Scanner" app from the App Store to do this. Once downloaded, connect to the pulse oximeter and open the BLE scanner app. Look for a device called "OxySmart" and click on it. You should see the following screen:
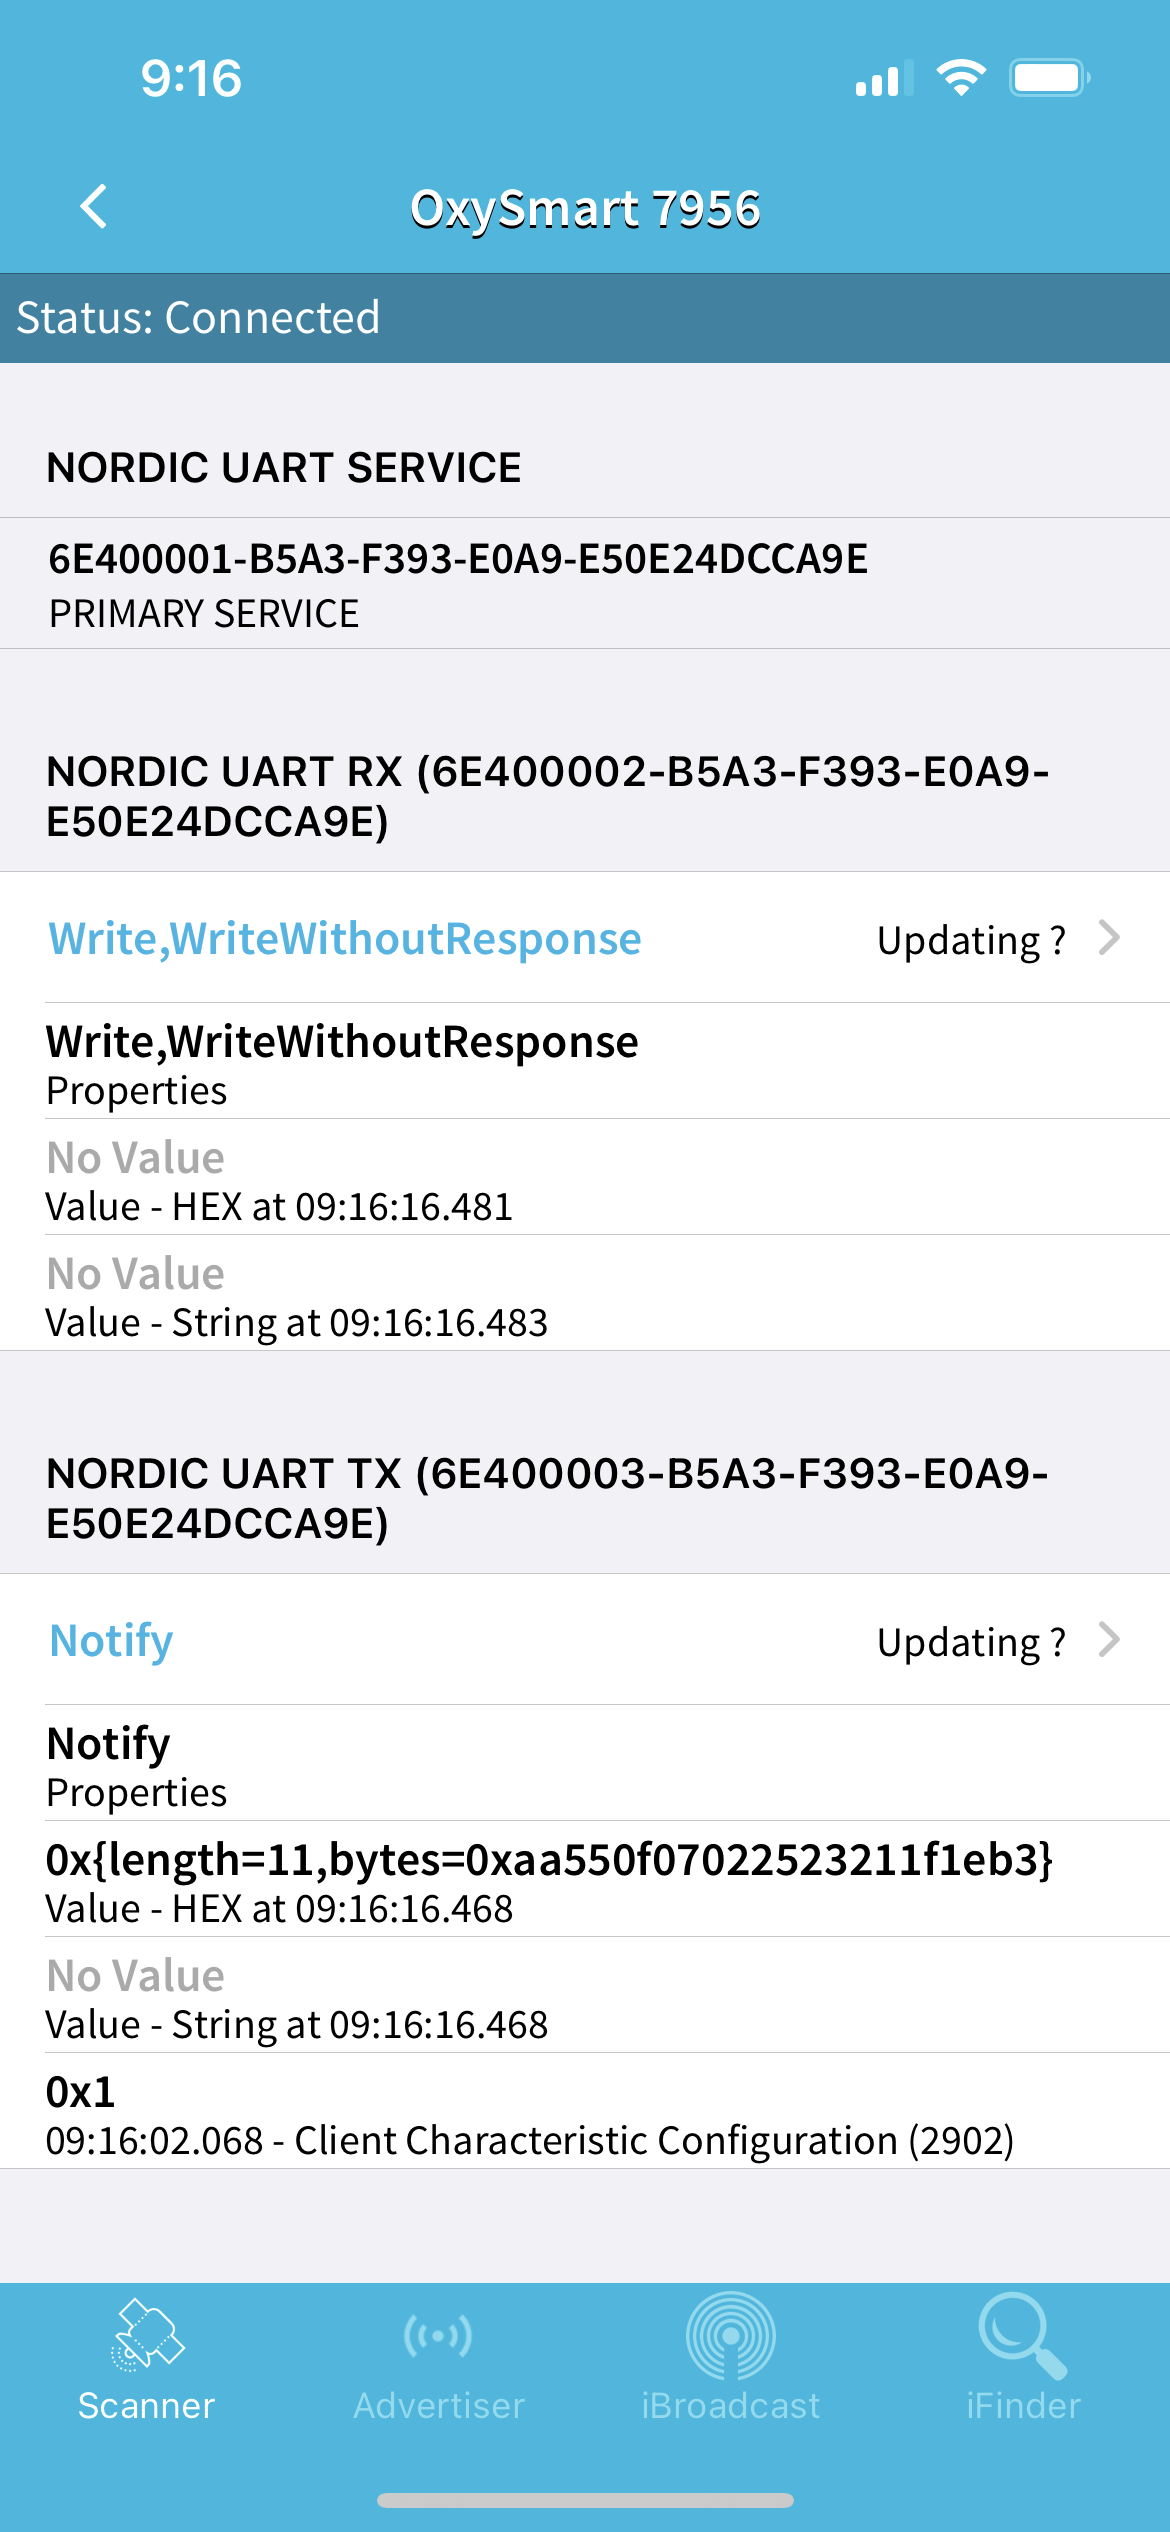
As you can see, my device is called "OxySmart 7956". Click on the "SERVICES" tab and you should see the following screen:
We are interested in "NORDIC UART TX" service, which has the UUID: 6E400003-B5A3-F393-E0A9-E50E24DCCA9E. Copy this UUID and save it somewhere. We will need it later.
It is best to handle the BLE device you want to connect to using an object-oriented approach. Let's navigate to wellue_pulse_ox.py. The class WelluePulseOx is defined here. But at this point, we only need to focus on the following methods:
import platform
from time import time
import numpy as np
import pygatt

CHUNK_SIZE = 5

class WelluePulseOx:
    def __init__(self, callback=None, time_func=time, name=None):
        # Initialze fields (not shown)

    def connect(self):
        self.adapter = pygatt.GATTToolBackend(self.interface) if self.backend == 'gatt' else pygatt.BGAPIBackend(serial_port=self.interface)
        self.adapter.start()

        self.address = self.find_device_address(self.name)
        if not self.address:
            raise ValueError(f"Can't find Device {self.name}")

        print(f"Connecting to {self.name} with address {self.address}...")
        self.device = self.adapter.connect(self.address, address_type=pygatt.BLEAddressType.random, timeout=10)

        self._subscribe()
        print('Connected')

    def find_device_address(self, name=None):
        devices = {device['name']: device['address']
                   for device in self.adapter.scan(timeout=10.5)}
        return devices.get(name, None)

    def start(self):
        print('Start streaming')

    def stop(self):
        print('Stop streaming')

    def disconnect(self):
        self.device.disconnect()
        self.adapter.stop()
        print('Disconnected')

    def _subscribe(self):
        self.device.subscribe("6E400003-B5A3-F393-E0A9-E50E24DCCA9E", callback=self._handle_data)

    def _handle_data(self, handle, data):
        with open("packets.txt", "a") as f:
            raw_data = repr(data)[12:-2]  # remove the `bytearray(b` and `)` wrapper text
            f.write(f"{raw_data}\n")
        # Other stuff (implement later)
This class is intended to be used like this in another file that we will call wellue_pulse_ox_lsl.py:
from wellue_pulse_ox import WelluePulseOx
from time import sleep

DEVICE_NAME = 'OxySmart 7956'  # Replace with your device name

def process(data):
    pass
    # TODO: Do something with the data

pulseOx = WelluePulseOx(name=DEVICE_NAME, callback=process)
pulseOx.connect()
pulseOx.start()

while 1:
    try:
        sleep(1)
    except:
        break

pulseOx.stop()
pulseOx.disconnect()
So far, the _handle_data() method just write the raw data to a file called packets.txt. This is necessary because so far we don't know what each packet means. We will figure this out in the next step.
We are lucky that the data format of Wellue Bluetooth Pulse Oximeter is pretty straightforward. Now run the wellue_pulse_ox_lsl.py script. This will connect to the pulse oximeter and start writing the raw data to packets.txt.
Let's take a look at our packets.txt file:
\xaaU\x0f\x07\x02afe_X\x8b
\xaaU\x0f\x07\x02\xd0HA=;*
\xaaU\x0f\x07\x02<=>>=\xc0
\xaaU\x0f\x07\x02:62-*\xd4
\xaaU\x0f\x07\x02&#!\x1f\x1e\xfd
\xaaU\x0f\x07\x02\x1c\x1c\x1b\x1a\x18\x80
Looks like garbage, right? Let's convert each byte to its decimal value:
def parse_data(byte_str):
    # Convert to decimal
    parsed_data = [int(b) for b in byte_str]

return parsed_data(reverse_engineering_packet.py contains a more sophisticated way to parse the data, but it's not necessary for this device.)
The results of the above hexidecimal strings are:
[170, 85, 15, 7, 2, 97, 102, 101, 95, 88, 139]
[170, 85, 15, 7, 2, 208, 72, 65, 61, 59, 42]
[170, 85, 15, 7, 2, 60, 61, 62, 61, 61, 192]
[170, 85, 15, 7, 2, 58, 54, 50, 45, 42, 212]
[170, 85, 15, 7, 2, 38, 35, 33, 31, 30, 253]
[170, 85, 15, 7, 2, 28, 28, 27, 26, 24, 128]
We can see that each packet comes with 11 bytes. The first 5 bytes are the same, so they are likely the header information. Bytes 6-10 are the PPG data looks continuous. They are likely the plethysmogram data. The last byte is probably used to sometimes representing the oxygen saturation (SpO2) value and sometimes the pulse rate (PR) value, but those two values are not important for us. We will only focus on the PPG data.
Let's modify our WelluePulseOx._handle_data() method to save the PPG data into a text file:
    def _handle_data(self, handle, data):
        timestamp = self.time_func()

        # Check if data starts with the header and has the correct length
        if data.startswith(b'\xaaU\x0f\x07\x02') and len(data) == 11:
            pleth_data = data[5:-1]  # Skip the first 5 bytes (header) and omit the last byte
            # Convert bytes to integers and print them as a list
            pleth_data_as_int = [int(b) for b in pleth_data]
            with open("pleth_data.txt", "a") as f:
                for i, b in enumerate(pleth_data_as_int):
                    f.write(f"{b} ")
Now, write a simple script to visualize the PPG data:
import matplotlib.pyplot as plt

# Read data from file
with open("pleth_data.txt", "r") as f:
    line = f.readline()
    numbers = list(map(int, line.split()))

# Generate the time axis (assuming a fixed time step between samples)
time_axis = [i for i in range(len(numbers))]

# Plotting
plt.figure(figsize=(20, 6))
plt.plot(time_axis, numbers)
plt.title("Pleth Data Time Series")
plt.xlabel("Time")
plt.ylabel("Data Value")
plt.show()
We can see that the PPG data comes with a spike in values that coincides with the systolic peaks of the ECG signal. Taking a closer look at the PPG data stored in pleth_data.txt reveals that the systolic peak signal is actually encoded by setting the most significant bit (MSB) of the data point to 1. This makes these data points 128 larger than the actual value. We can fix this by subtracting 128 from these data points:
    def _handle_data(self, handle, data):
        timestamp = self.time_func()

        # Check if data starts with the header and has the correct length
        if data.startswith(b'\xaaU\x0f\x07\x02') and len(data) == 11:
            pleth_data = data[5:-1]  # Skip the first 5 bytes and omit the last byte
            # Convert bytes to integers and print them
            pleth_data_as_int = [int(b) for b in pleth_data]
            with open("pleth_data.txt", "a") as f:
                for i, b in enumerate(pleth_data_as_int):
                    if b > 127:
                        b = b - 128  # the first bit marks the systolic peak
                    f.write(f"{b} ")
Record some data and plot it again. Now we should have a smooth PPG signal:
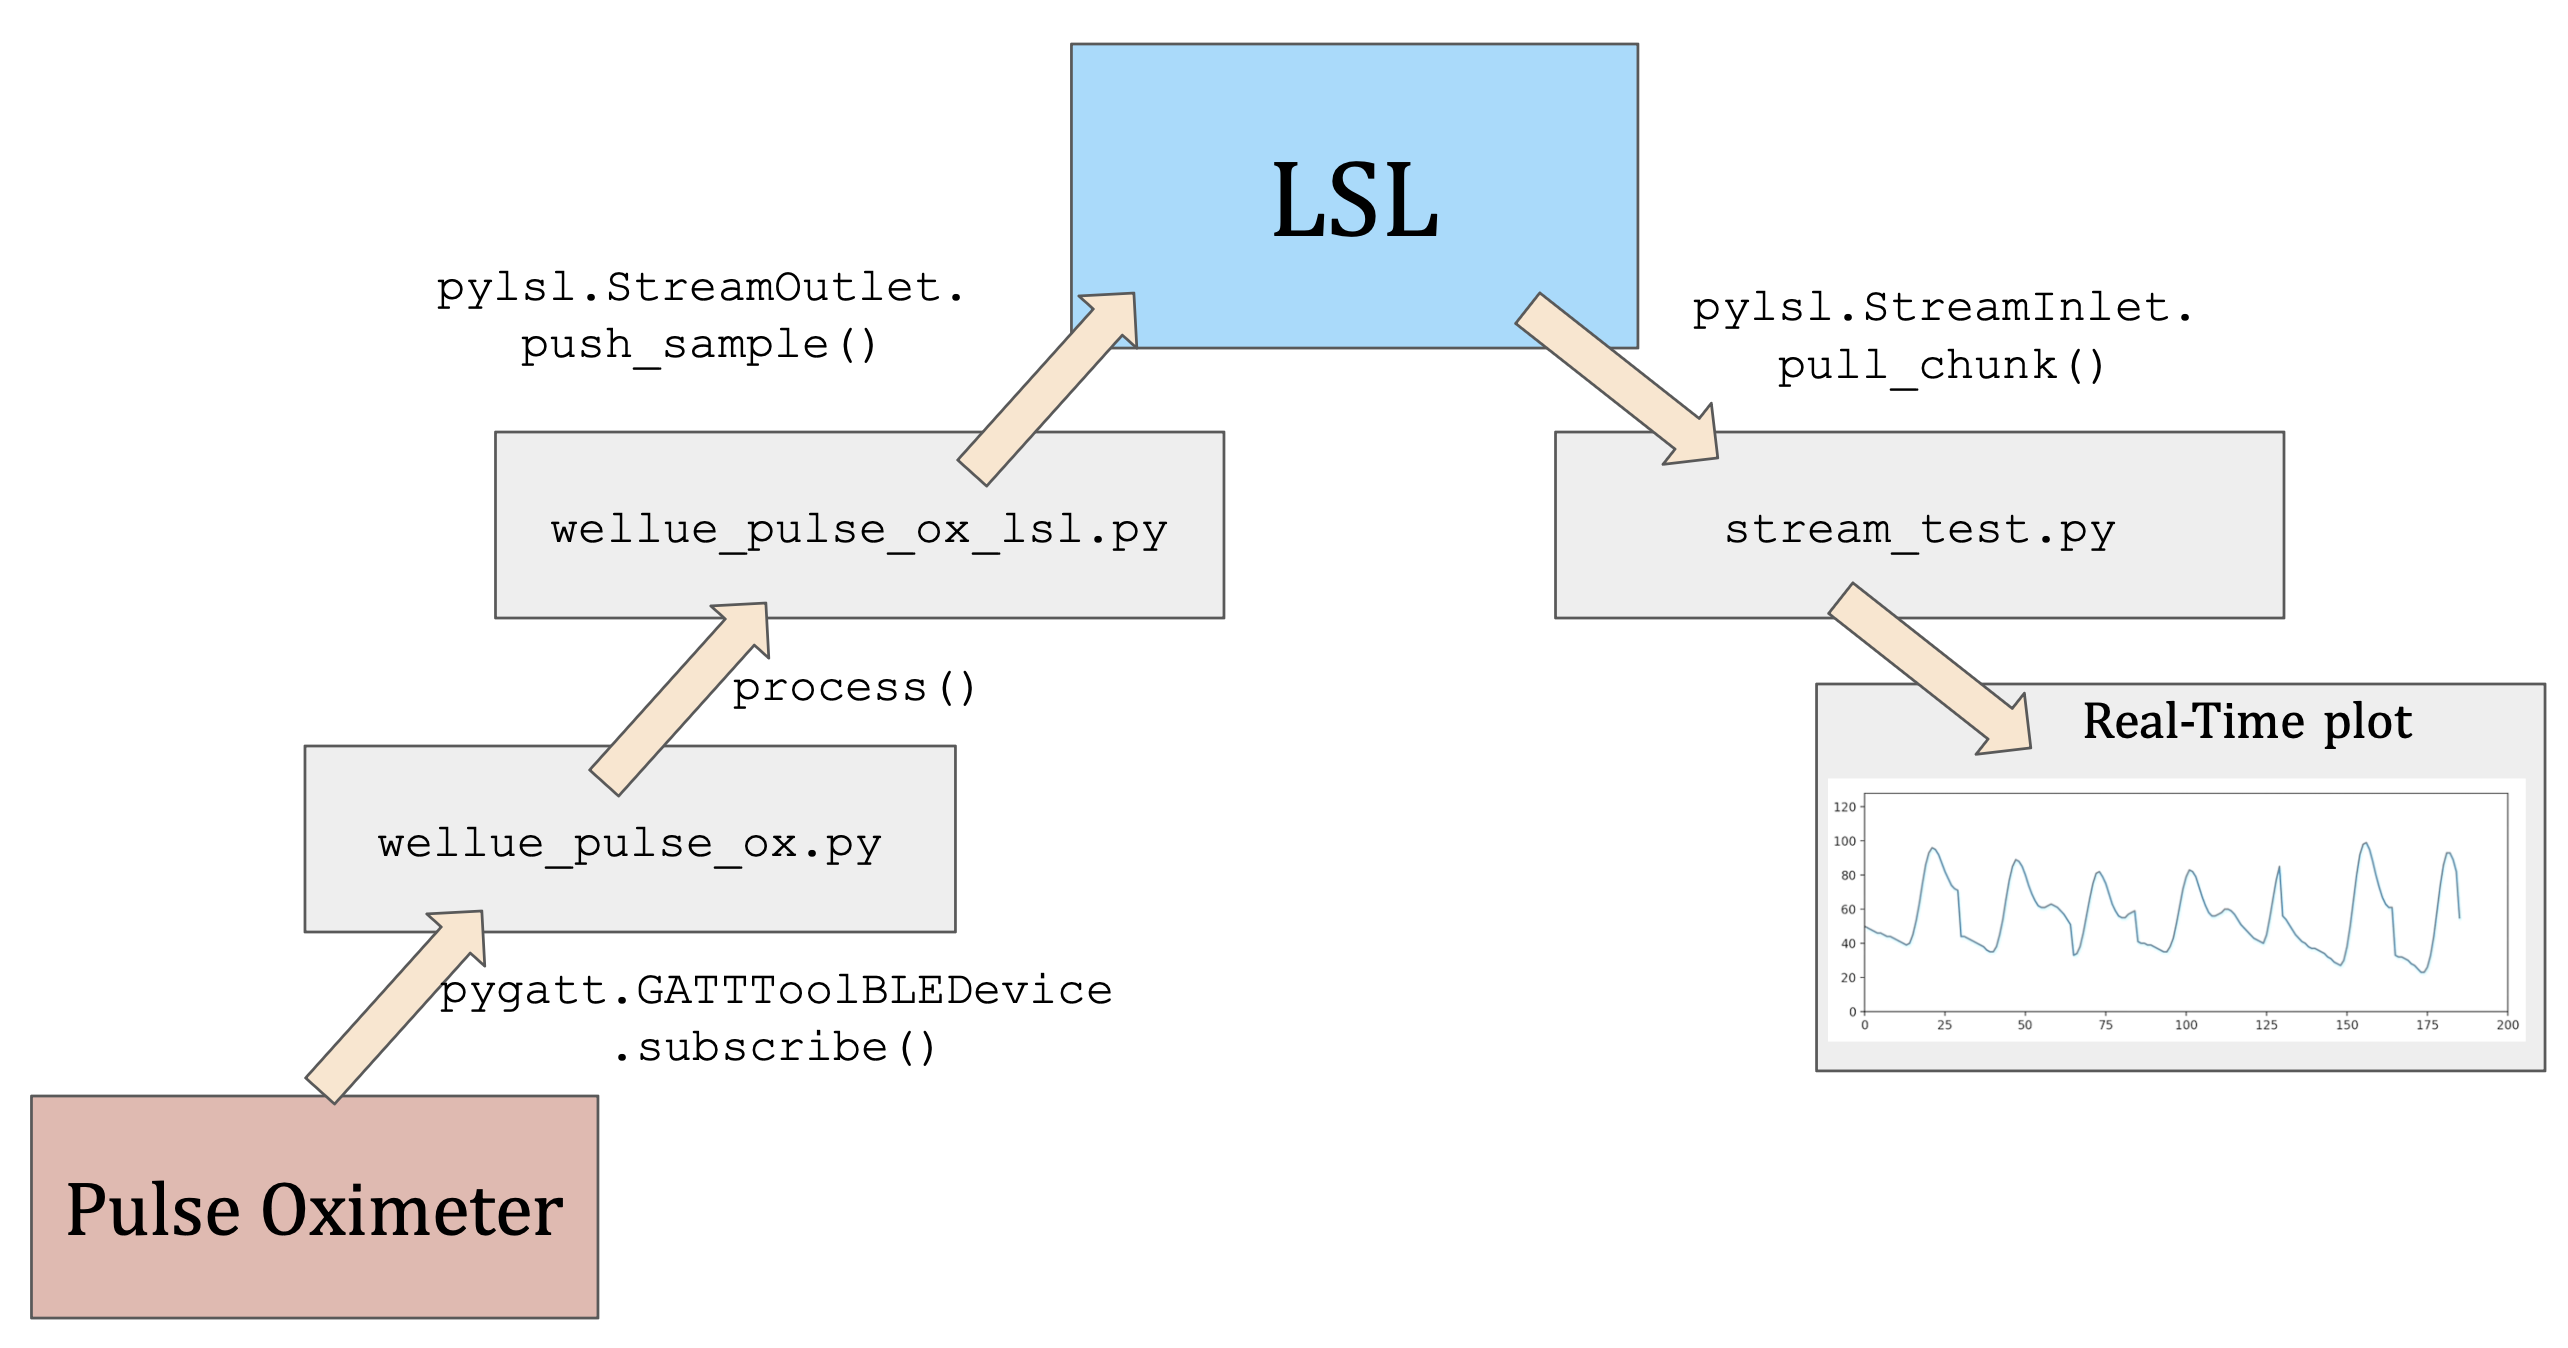
So far, we only write our PPG data into a text file, but how can we stream it live in (near-)real-time? This is where LSL comes in. Think of LSL as a local network that allows you to put data streams into it and other programs can read from it. The following diagram illustrates this concept:
The above figure traces the data from the pulse oximeter to the final real-time plot. The data is first collected by the pulse oximeter, then sent to the computer via Bluetooth. The WelluePulseOx class in wellue_pulse_ox.py uses pygatt to subscribe to the pulse oximeter's data stream. The data is then processed by the process() function in wellue_pulse_ox_lsl.py. The processed data is then sent to the LSL stream via the pylsl.StreamOutlet class, via one of its methods called push_sample(). The LSL stream is then read by the stream_test.py script using the pylsl.StreamInlet class. The data is then plotted using matplotlib.
I have put my code in the python folder. To visualize the PPG data in real-time, run the following scripts in order:
python3 wellue_pulse_ox_lsl.pyKeep this script running. It will connect to the pulse oximeter and start streaming the PPG data to the LSL stream. Then in a new terminal, run:
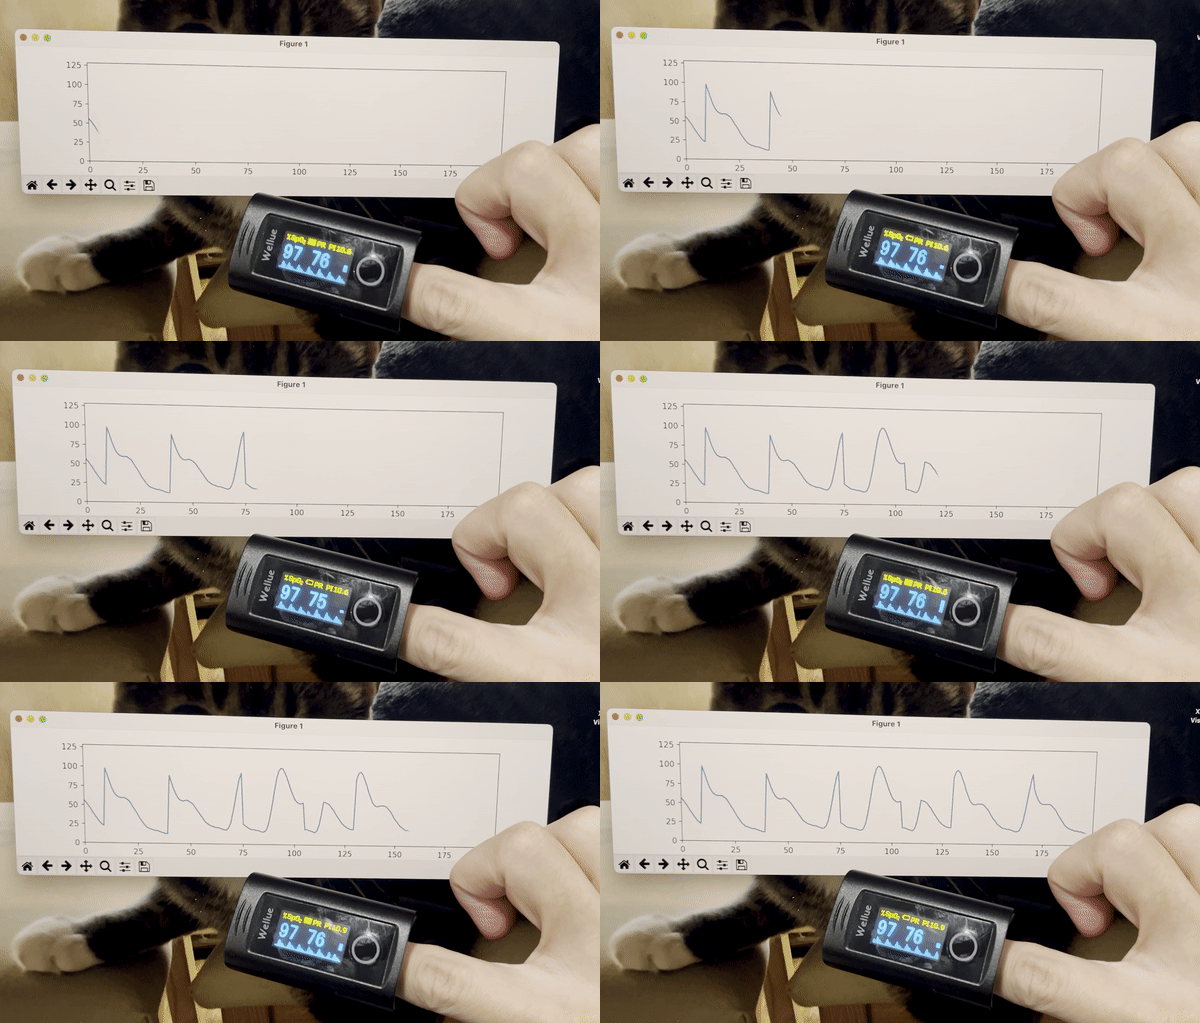
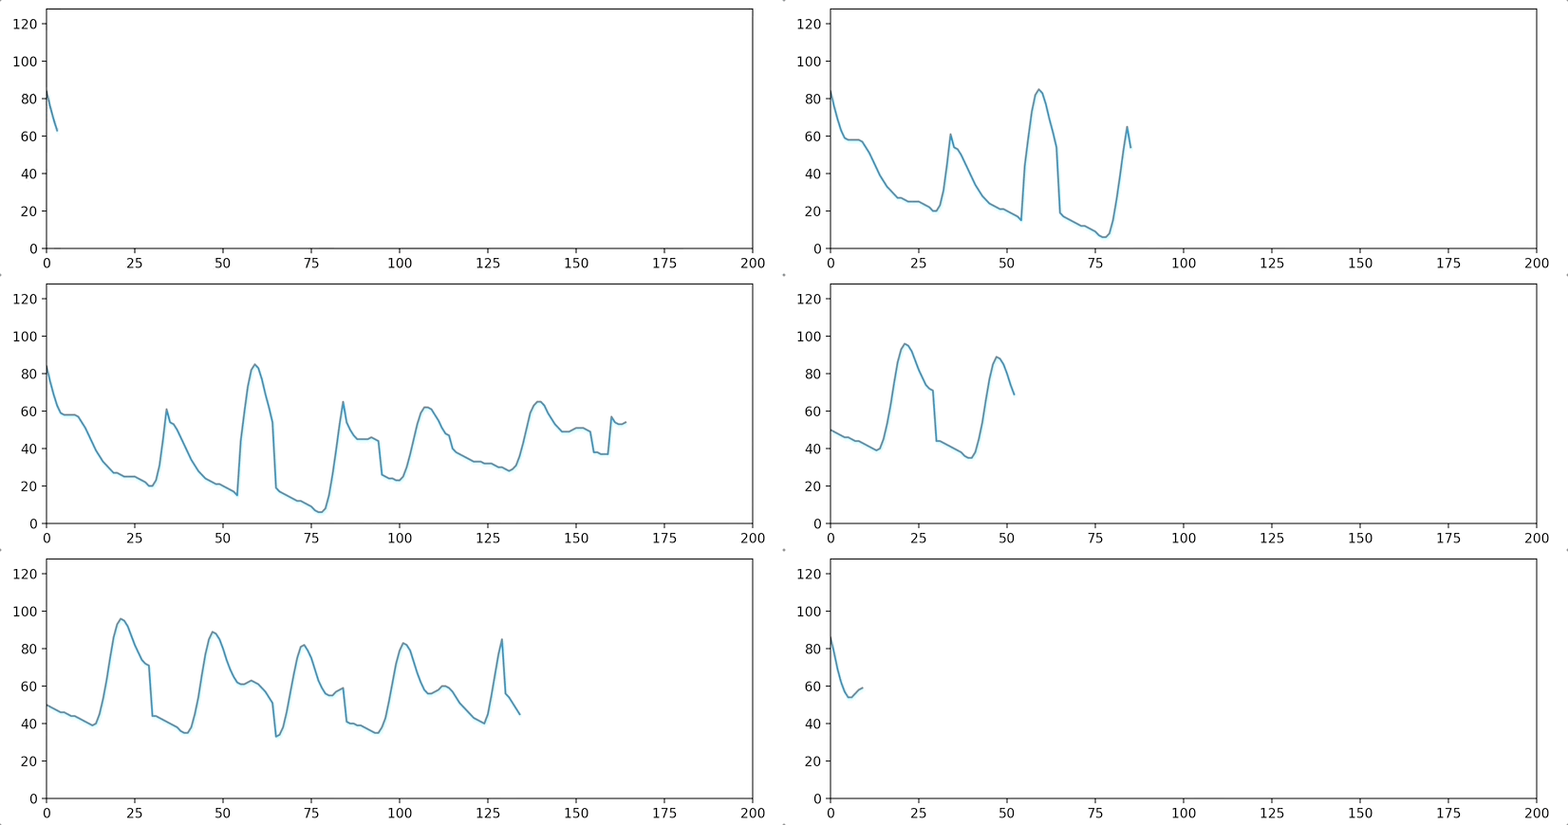
python3 stream_test.pyYou should see a plot like this:
- Add time stamps to the data stream.
- Use peak detection with a sliding window and thresholding to detect the systolic peaks in real-time, and then compare the systolic peaks calculated with the systolic peak signal from the pulse oximeter.
- Compare the heart rate calculated with the heart rate signal from the pulse oximeter.
- Extract the SpO2 value from the data stream.
- Improve handling of corrupted data packets. Currently, all corrupted packets are discarded, leading to a loss of data.
