work-of-breathing-UI
Software for obtaining PTP (Pressure-time product, a measure of breathing effort) values from respiratory data. Specifically, from Pes (esophageal pressure) and EAdi (electrical activity of the diaphragm) data obtained from patients with mechanical ventilatory assistance. Includes a user interface for displaying input signals and estimation of points of interest (start and end of inspiration).
Installation
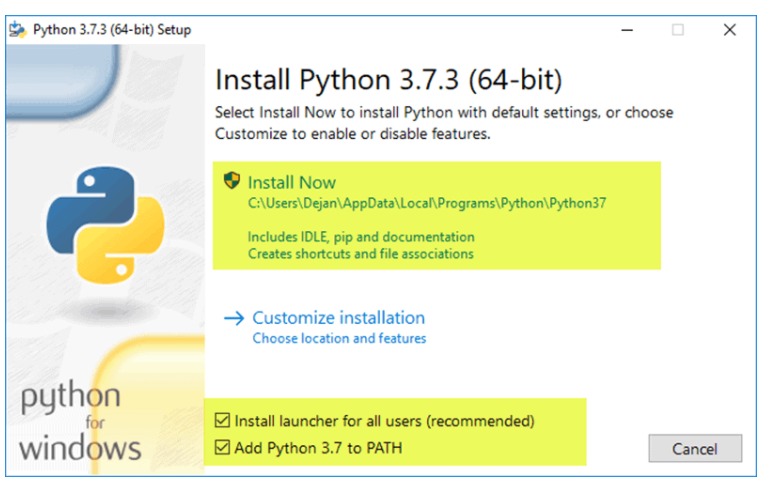
You need Python installed. Its important to check the box "Add Python to PATH"

To easily set up the necessary python libraries to run the software for the first time on your computer, you can execute (double click) the package_installer.py file in the src folder. This will automatically install all dependencies.
Usage
Input
Input data must consist of an excel file with a worksheet named: Resumen para análisis, in which the first two columns contain the synchronized (same length) EAdi and Pes data, in that order. Data values are read starting from the second row. All calculations are carried out under the assumption that the frequency of the input signals is 100 data points per second.
Interface usage
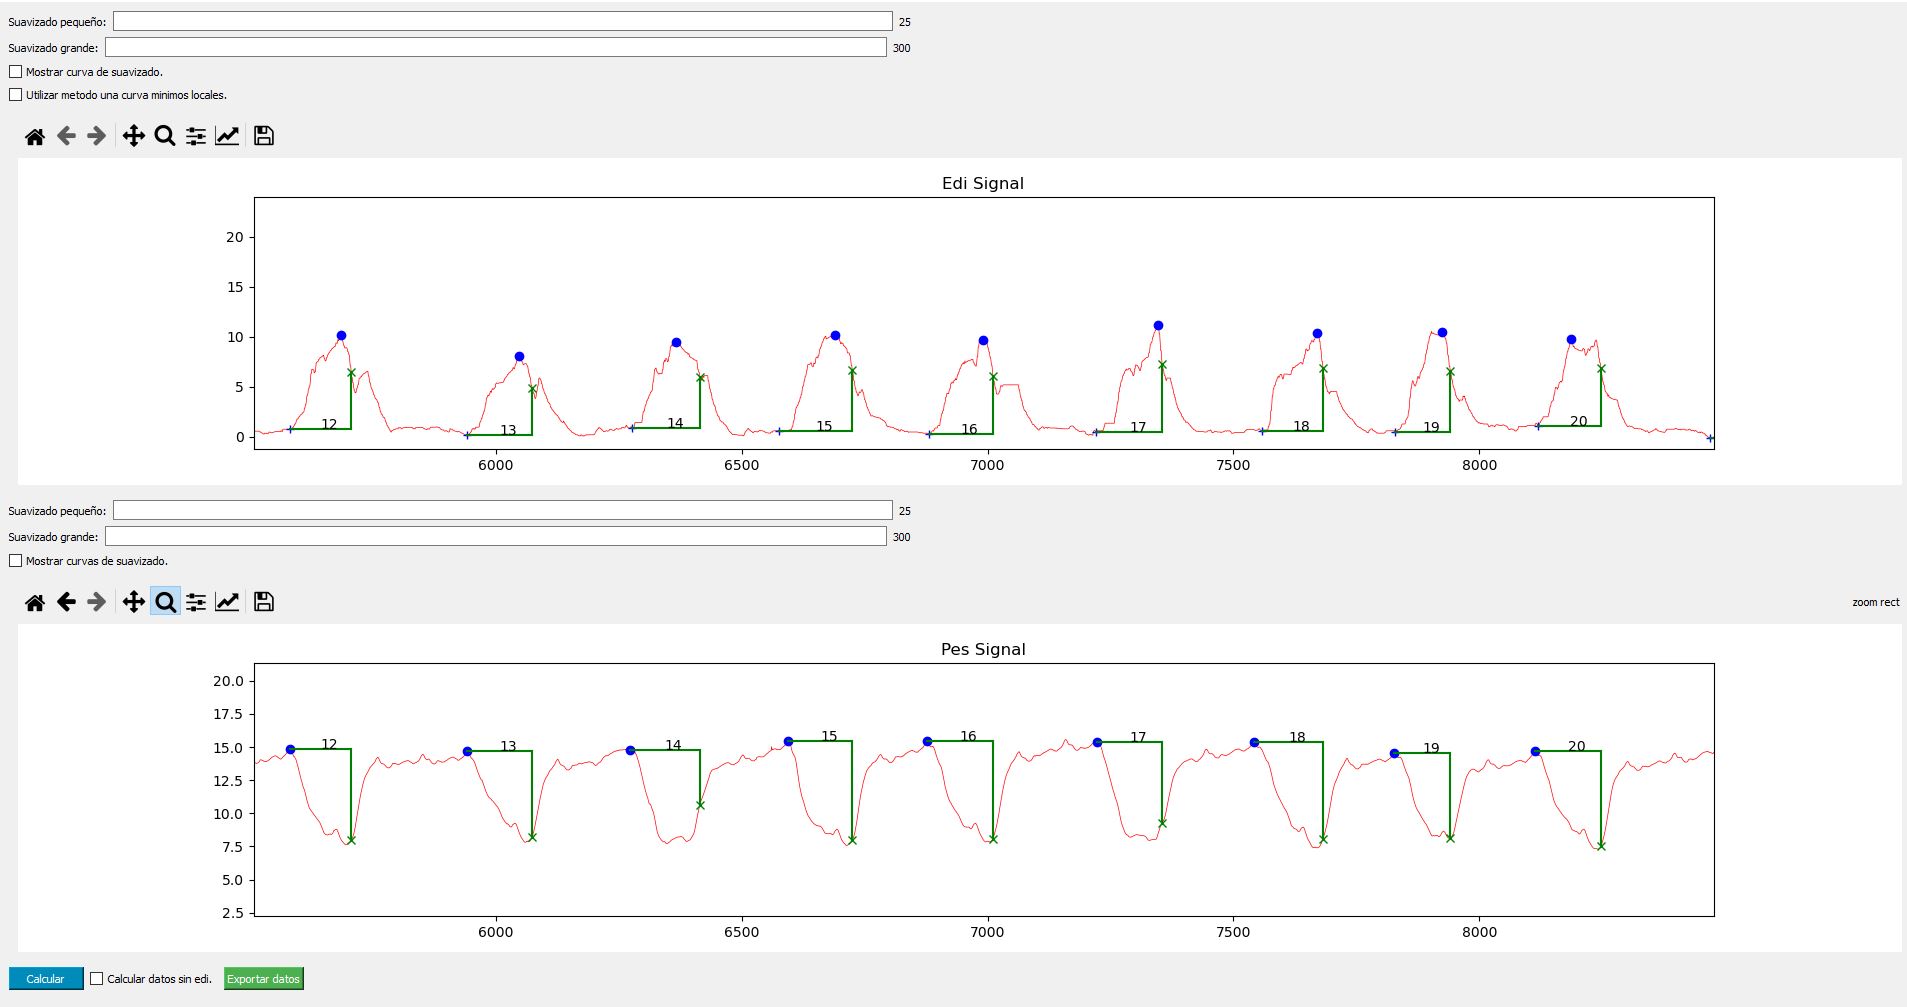
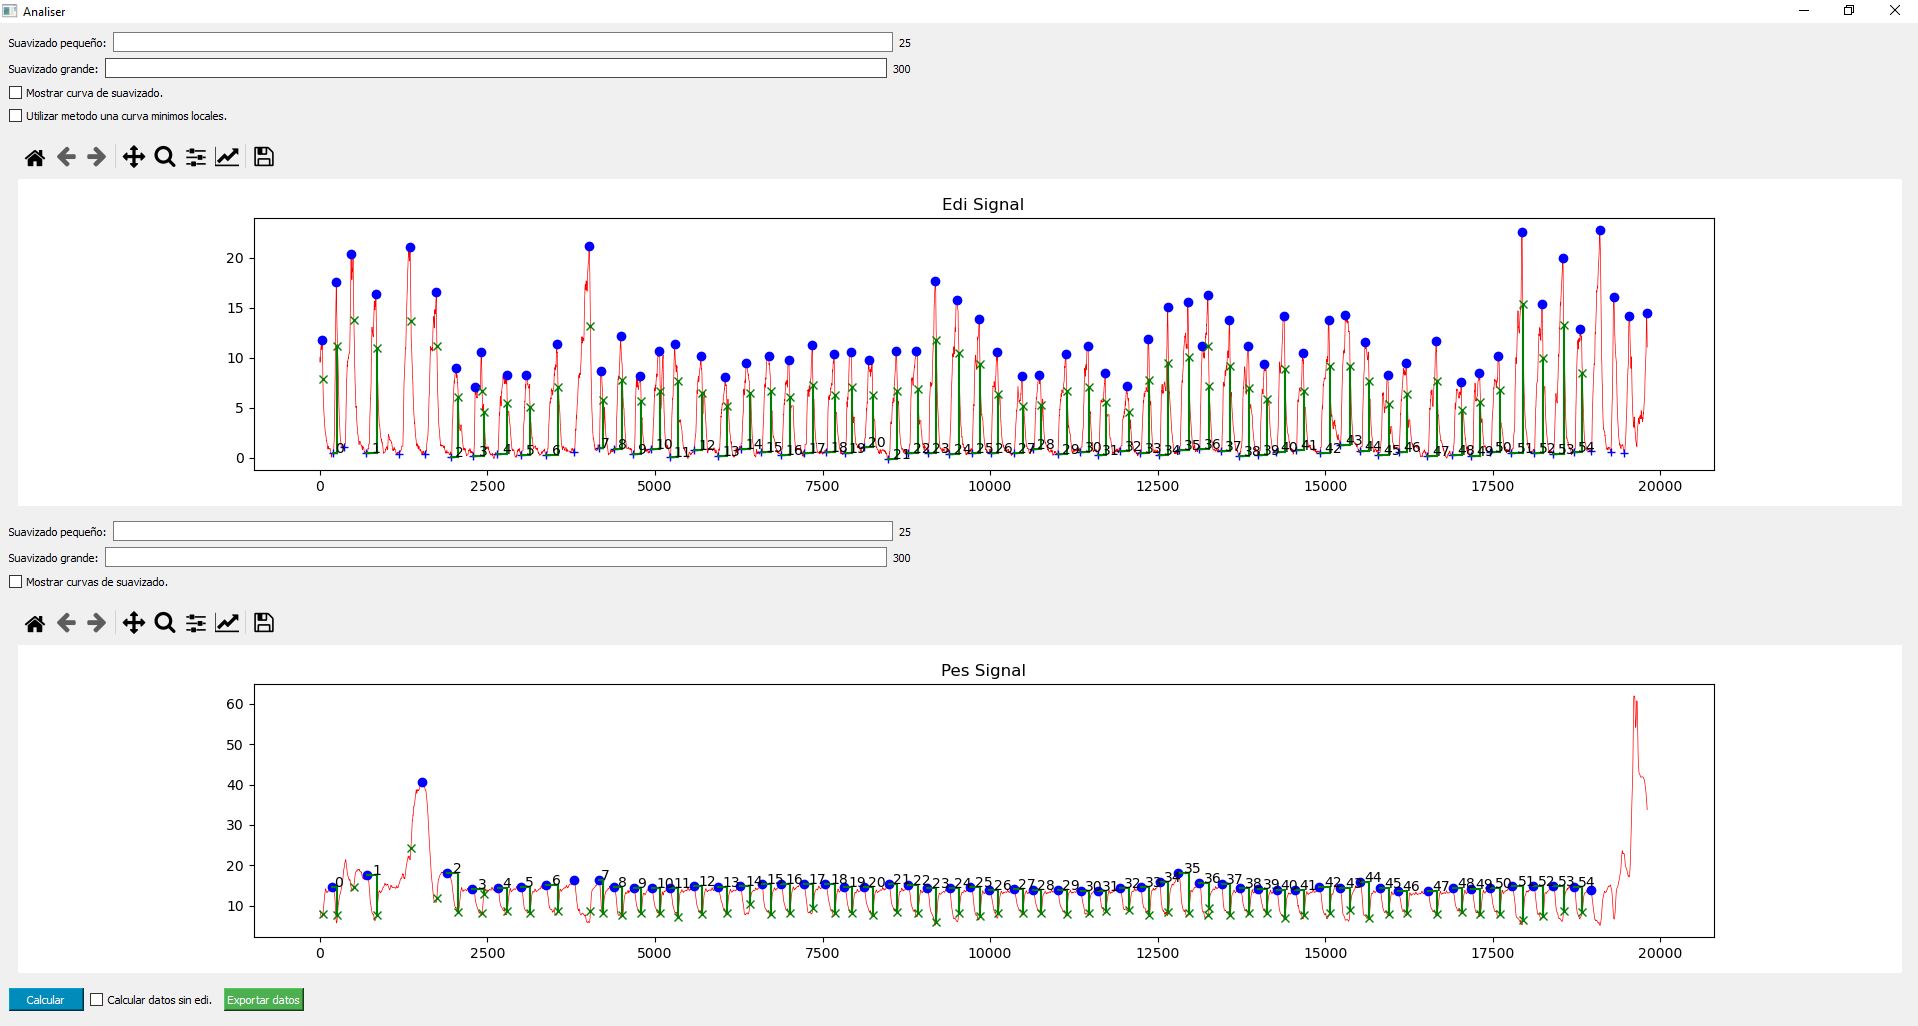
After executing main.py, the user interface will pop up. Choose the input file with Abrir archivo button and then press Continuar. If everything worked right you should see both signals (Edi and Pes) shown in interactive graphs.
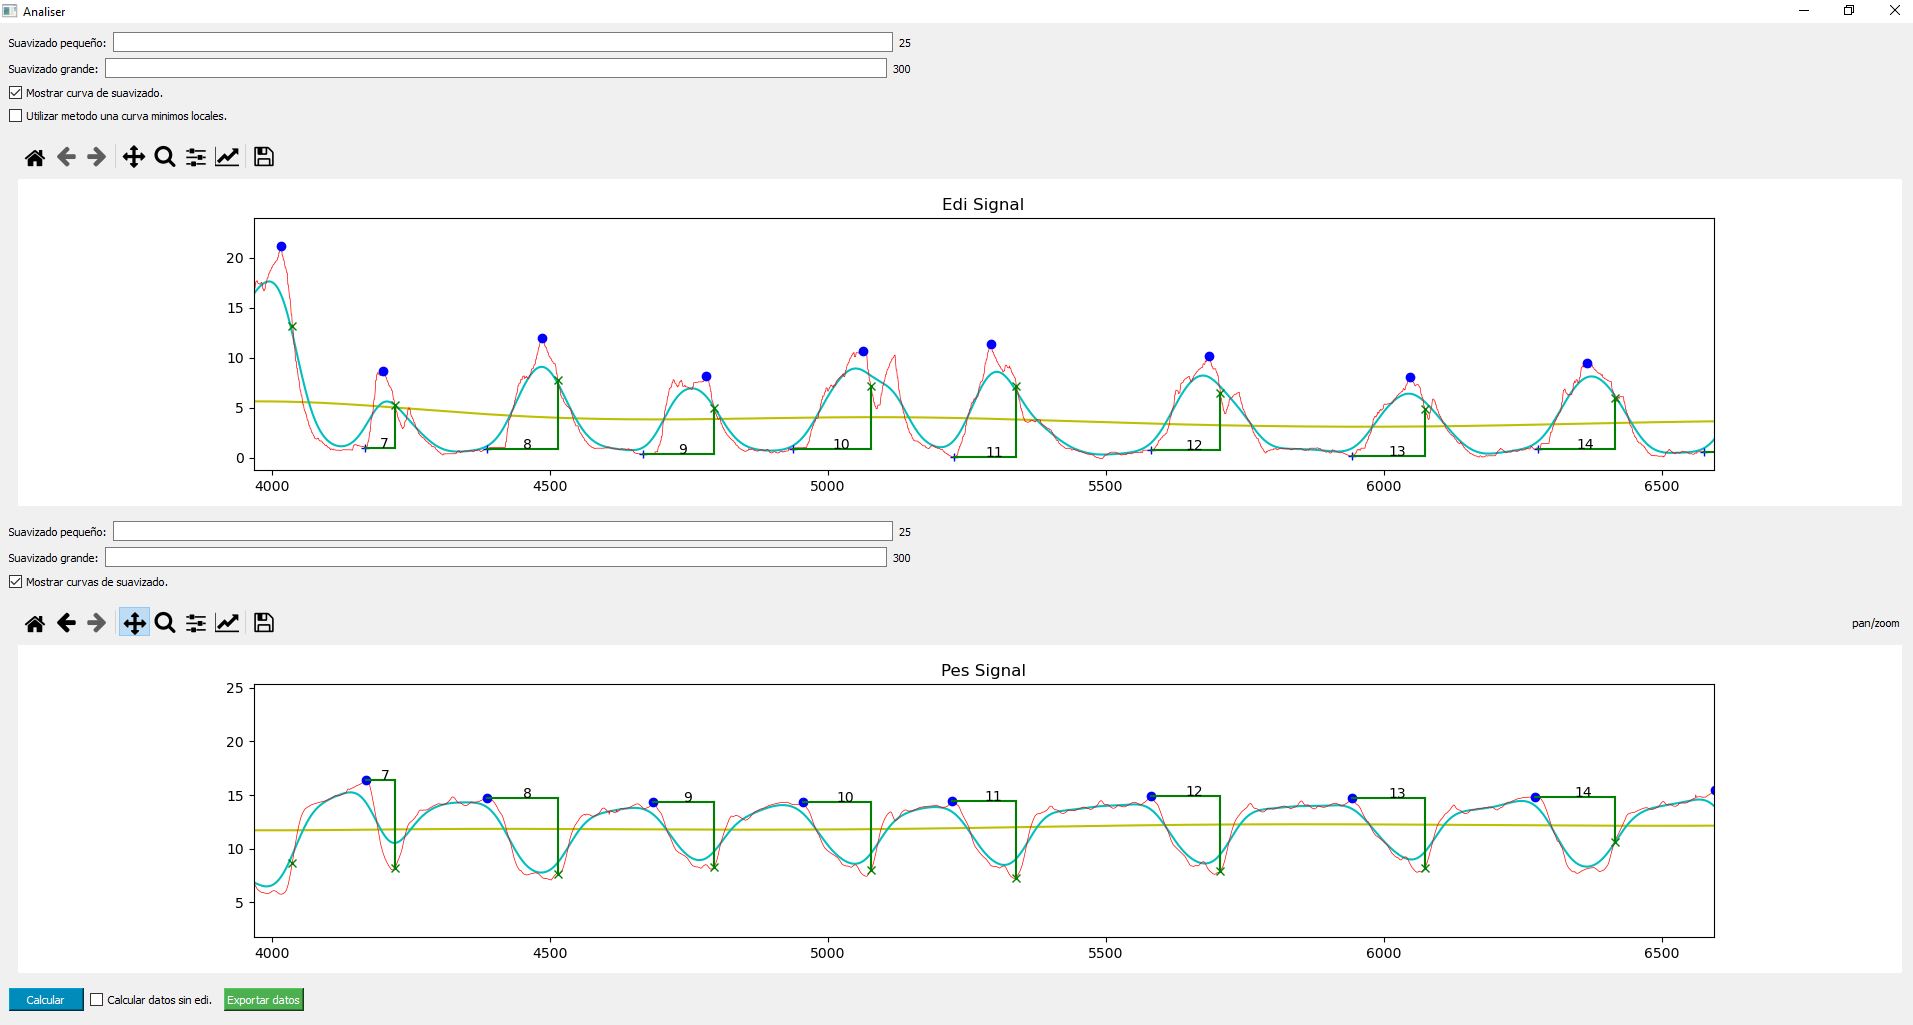
You can now press Calcular to compute and visualize the points of interest based on the smoothing values Suavizado pequeño and Suavizado grande (values shown at the right of input text boxes are the default values) You can also visualize the smoothed curves used in inflection point estimation by checking off the Mostrar curva de suavizado checkbox.

Output
You can use de Exportar datos button to generate output. The output consists of an excel file located at /calculated_data folder, which will be automatically created in the same location as the executable file. The output file can be identified by the input file's name and a timestamp corresponding to it's time of creation. This excel file contains a worksheet named "results'', in which there are 13 columns:
- n cycle: Inspiration cycle identifier. The same number is shown in the interactive graphs.
- integral value pes: PTP value estimated for that inspiration cycle.
- integral value edi: Area between Edi curve and the Edi cycle minimum, from start edi to point 75%.
- start pes: Datapoint used as starting point when computing the Pes integral.
- start edi: Datapoint considered the starting point for the Edi cycle.
- point 75%: Datapoint where the Edi curve reaches 75% of its total amplitude. Used as ending point when computing PTP.
- t start pes->75%: Time elapsed in seconds from start_pes to point_75%
- t start pes-> start edi: Time elapsed in seconds from start_pes to start_edi.
- t start edi -> 75%: Time elapsed in seconds from start_edi to point_75%.
- t start edi -> peak edi: Time elapsed in seconds from start_edi to maximum value of the cycle
- t start edi -> end edi:Time elapsed in seconds from start_edi to the start of the next cycle
- edi Amplitude: Amplitude of the Edi cycle.
- pes Amplitude: Amplitude of the Pes cycle.
Note: For output columns: start pes, start edi and point 75%, a value of 0 corresponds to the first datapoint of the input signal, 1 to the second, and so forth.
Dependencies
- PyQt5
- openpyxl
- matplotlib
- scipy
PTP estimation
The starting points for computing the Pes integral are obtained by first finding the inflection points of the curve. The inflection points are estimated as the intersection points of two smoothed versions of the original curve (using a gaussian filter with two different user-inputted sigma values). Then the starting points are obtained as the first local peak before each inflection point.
The ending points of the Pes integral are computed as the points in which each Edi cycle reaches 75% of its amplitude after the cycle's peak. The starting points of each Edi cycle are estimated in the same way as the Pes's starting points.
The PTP for each inspiration cycle is finally computed as the area over the Pes curve from each Pes's starting point to the next ending point, as follows:
# Assuming the frequency of input data is 100 data points per second
CyclePTP = (PesData[startingPoint] * (endingPoint - startingPoint) - sum(PesData[startingPoint:endingPoint])) / 100

