SelfProfiler
SelfProfiler is a script that samples the currently active window, streaming Trace Event Format events containing the frontmost application name and window title to standard out.
If the output is piped into a file it can be read by the Google Chrome Trace Event Profiling Tool.
Currently only OSX is supported via the Accessability APIs.
Usage
The terminal will require access to OSX Accessability, which is enabled via System Preferences -> Security & Privacy -> Privacy -> Accessibility where you can add the terminal emulator that you use.
$ ./selfprofiler.sh > prof.jsonIn Google Chrome navigate to about://tracing and load prof.json.
Installation
If you would like to install SelfProfiler globally so that you can run it in any directory, you can use install.sh.
$ ./install.shPlease restart your terminal or source your environment file after installation is successful.
Now you can run SelfProfiler in any directory.
$ selfprofiler > prof.jsonNotes:
-
Please make sure
/usr/local/binis included in your environment path. -
If you get
permission deniederror message while runninginstall.sh, make sure it is executable. You can use the following command to make it executable. (sudomight be required)$ chmod +x ./install.sh
Example
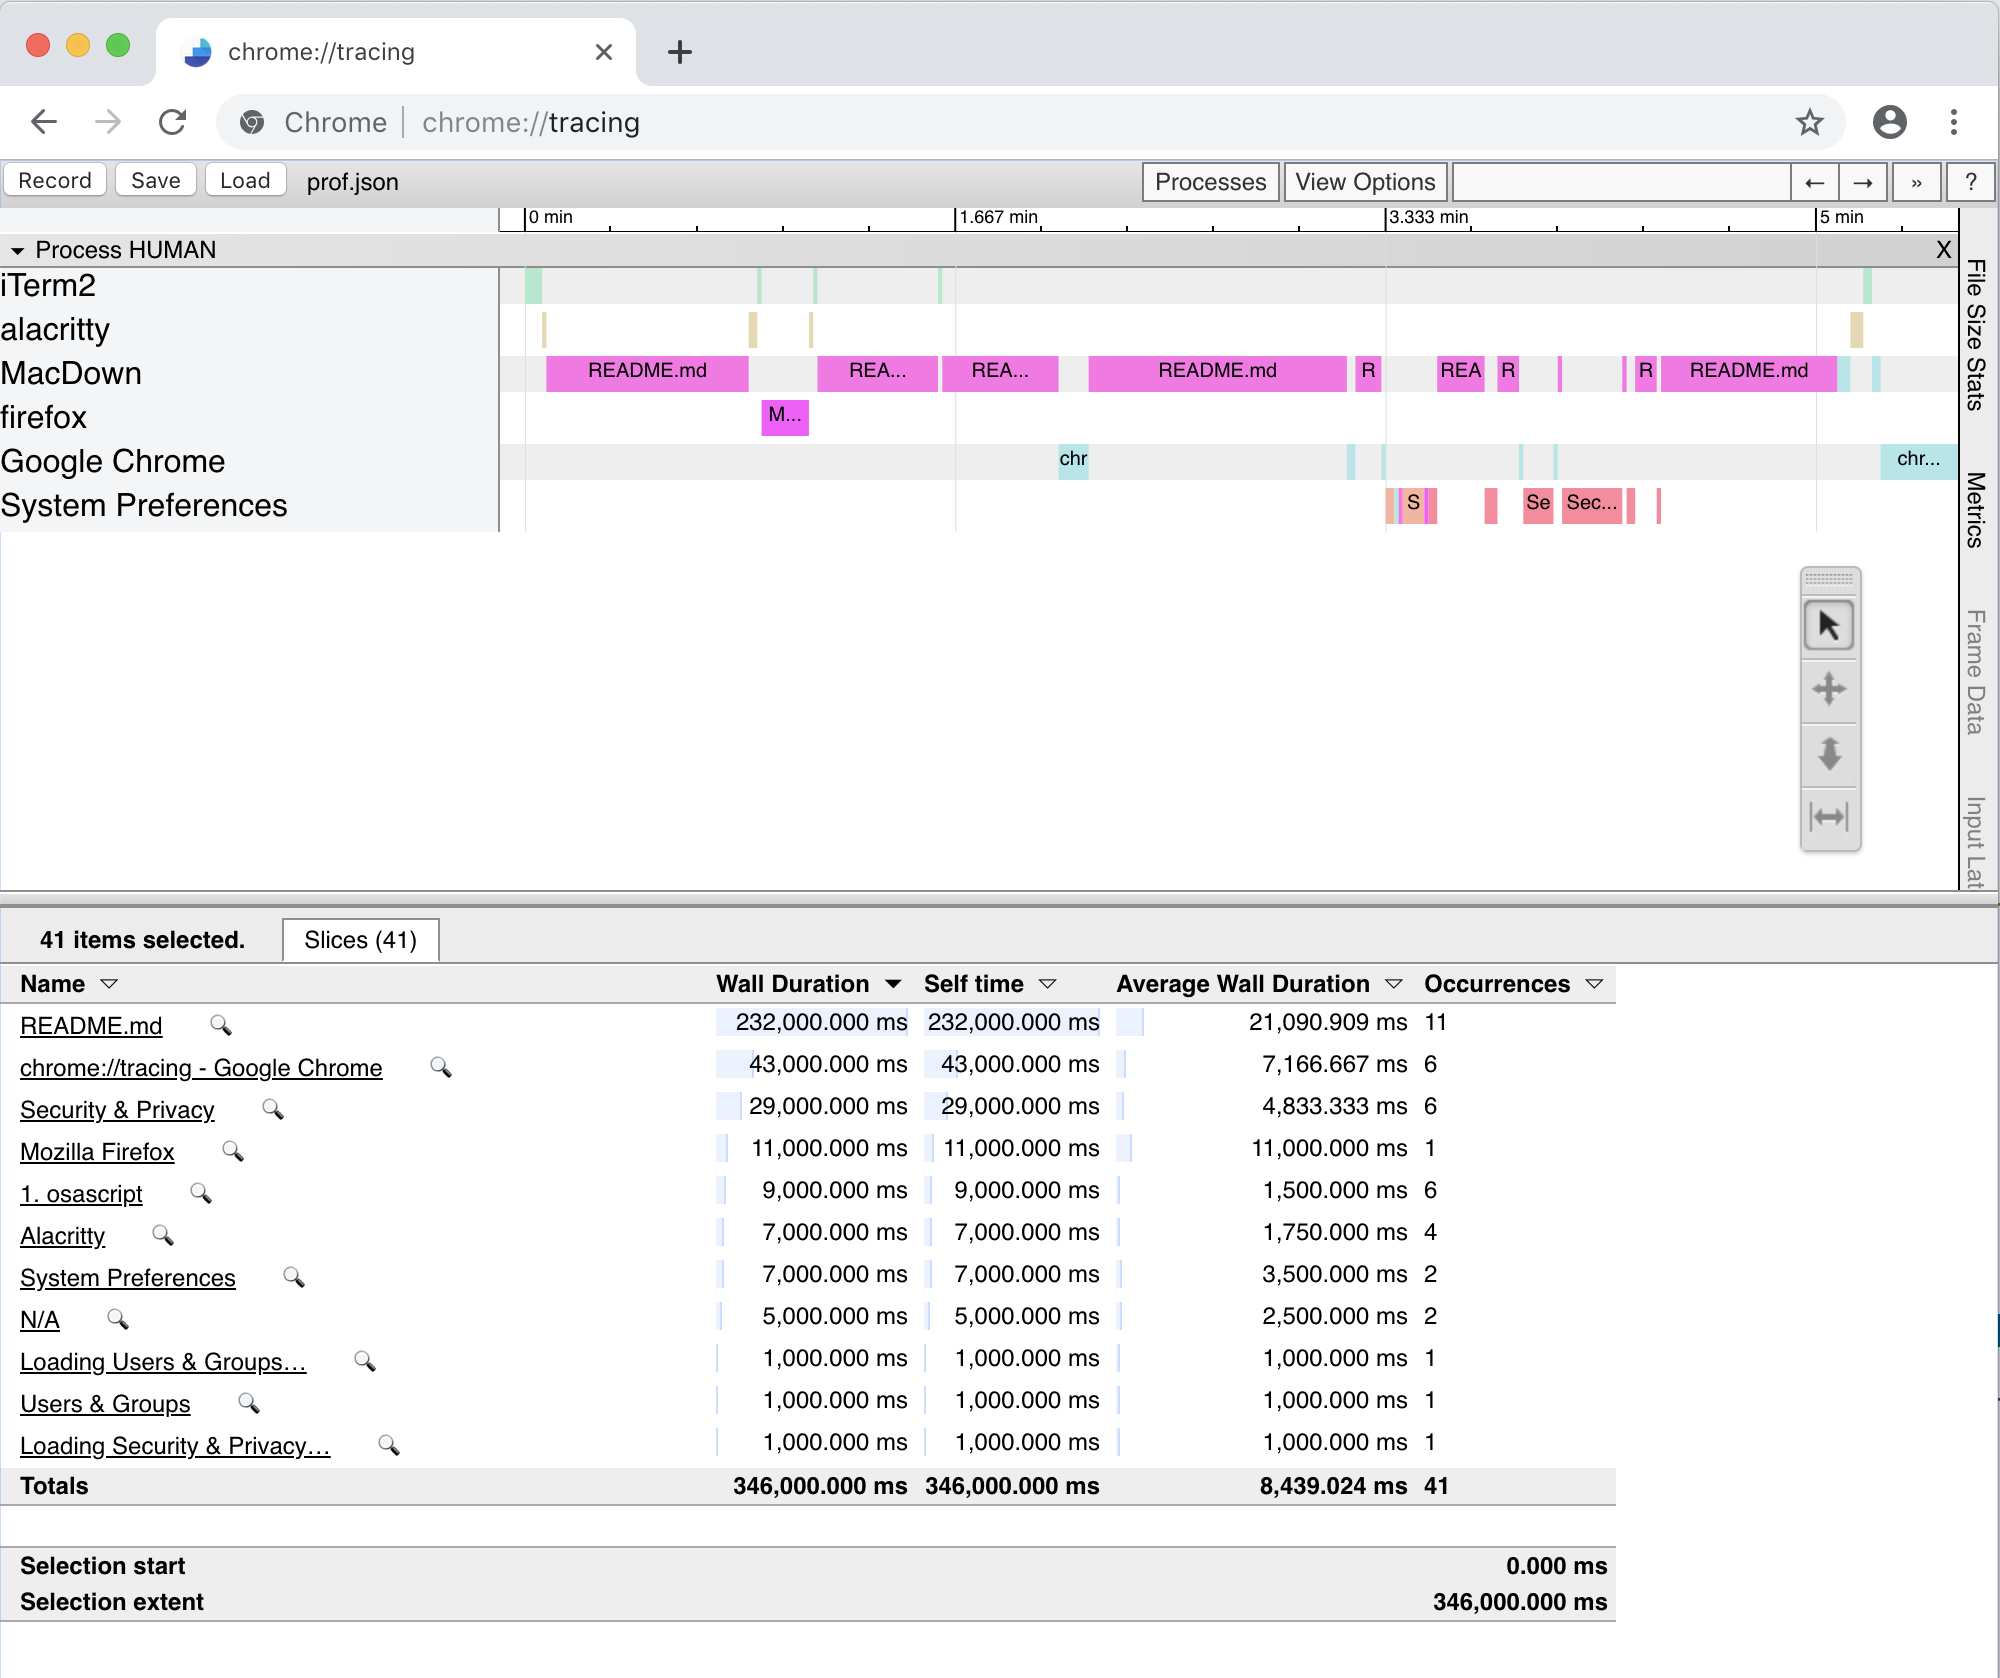
Here is an example profiling output which when loaded in Google Chrome's Trace Event Profiling Tool looks as follows:
Contributing
Pull requests are welcome :)
License
Copyright © 2019 Kiril Videlov
Distributed under the Eclipse Public License.
