Amazon EMR Automatic Scaling with Custom Metrics
This writeup is to demonstrate how you can use feed additional metrics from your Amazon EMR cluster and later use those metrics to configure [automatic scaling](https://docs.aws.amazon.com/emr/latest/ManagementGuide/emr-automatic -scaling.html). Ideally, for YARN-based application, [EMR Managed Scaling](https://docs.aws.amazon.com/emr/latest /ManagementGuide/emr-managed-scaling.html) can handle the majority of the scaling needs. However, if your application doesn't run on YARN or you want to use custom metrics, you can follow this solution to get an idea how you can achieve that.
Note:
Pushing Additional Metrics from Amazon EMR to AWS CloudWatch
Amazon EMR Automatic Scaling policy is dependent on CloudWatch metrics, so if you want to scale out and scale in core node and task nodes based on a specific value, that value needs to be pushed to CloudWatch. Once, the CloudWatch receives that value, then you can write the automatic scaling policy using those values. In this example , I'm using YARN Core Available Percentage to configure my autoscaling policy. You can check Monitor Metrics with CloudWatch to see the list of available EMR metrics on CloudWatch. I'm using core percentage just for an example, you can use any other value depending on your requirement.
I have a bash script custom-metrics.sh that executes on the EMR cluster master node every 30 seconds through a cron job. Inside the script, I'm leveraging ResourceManager REST API’s to get YARN metrics. From all the metrics, I am parsing two different data points availableVirtualCores and totalVirtualCores to calculate the YARNCoreAvailablePercentage value. Once I get the value, I use AWS CLI to publish the value to CloudWatch.
#!/bin/bash
set -x -e

REGION=`cat /tmp/aws-region`
HOSTNAME=`cat /tmp/hostname`

RESPONSE=`curl -s $HOSTNAME:8088/ws/v1/cluster/metrics`
CLUSTER_ID=`ruby -e "puts '\`grep jobFlowId /mnt/var/lib/info/job-flow.json\`'.split('\"')[-2]"`

AVAILABLE_CORE=`echo $RESPONSE | jq -r .clusterMetrics.availableVirtualCores`
TOTAL_CORE=`echo $RESPONSE | jq -r .clusterMetrics.totalVirtualCores`
CORE_AVAILABLE_PERCENTAGE=$(echo "scale=2; $AVAILABLE_CORE *100 / $TOTAL_CORE" | bc)

aws cloudwatch put-metric-data --metric-name YARNCoreAvailablePercentage --namespace AWS/ElasticMapReduce --unit
 Percent --value $CORE_AVAILABLE_PERCENTAGE --dimensions JobFlowId=$CLUSTER_ID --region $REGION
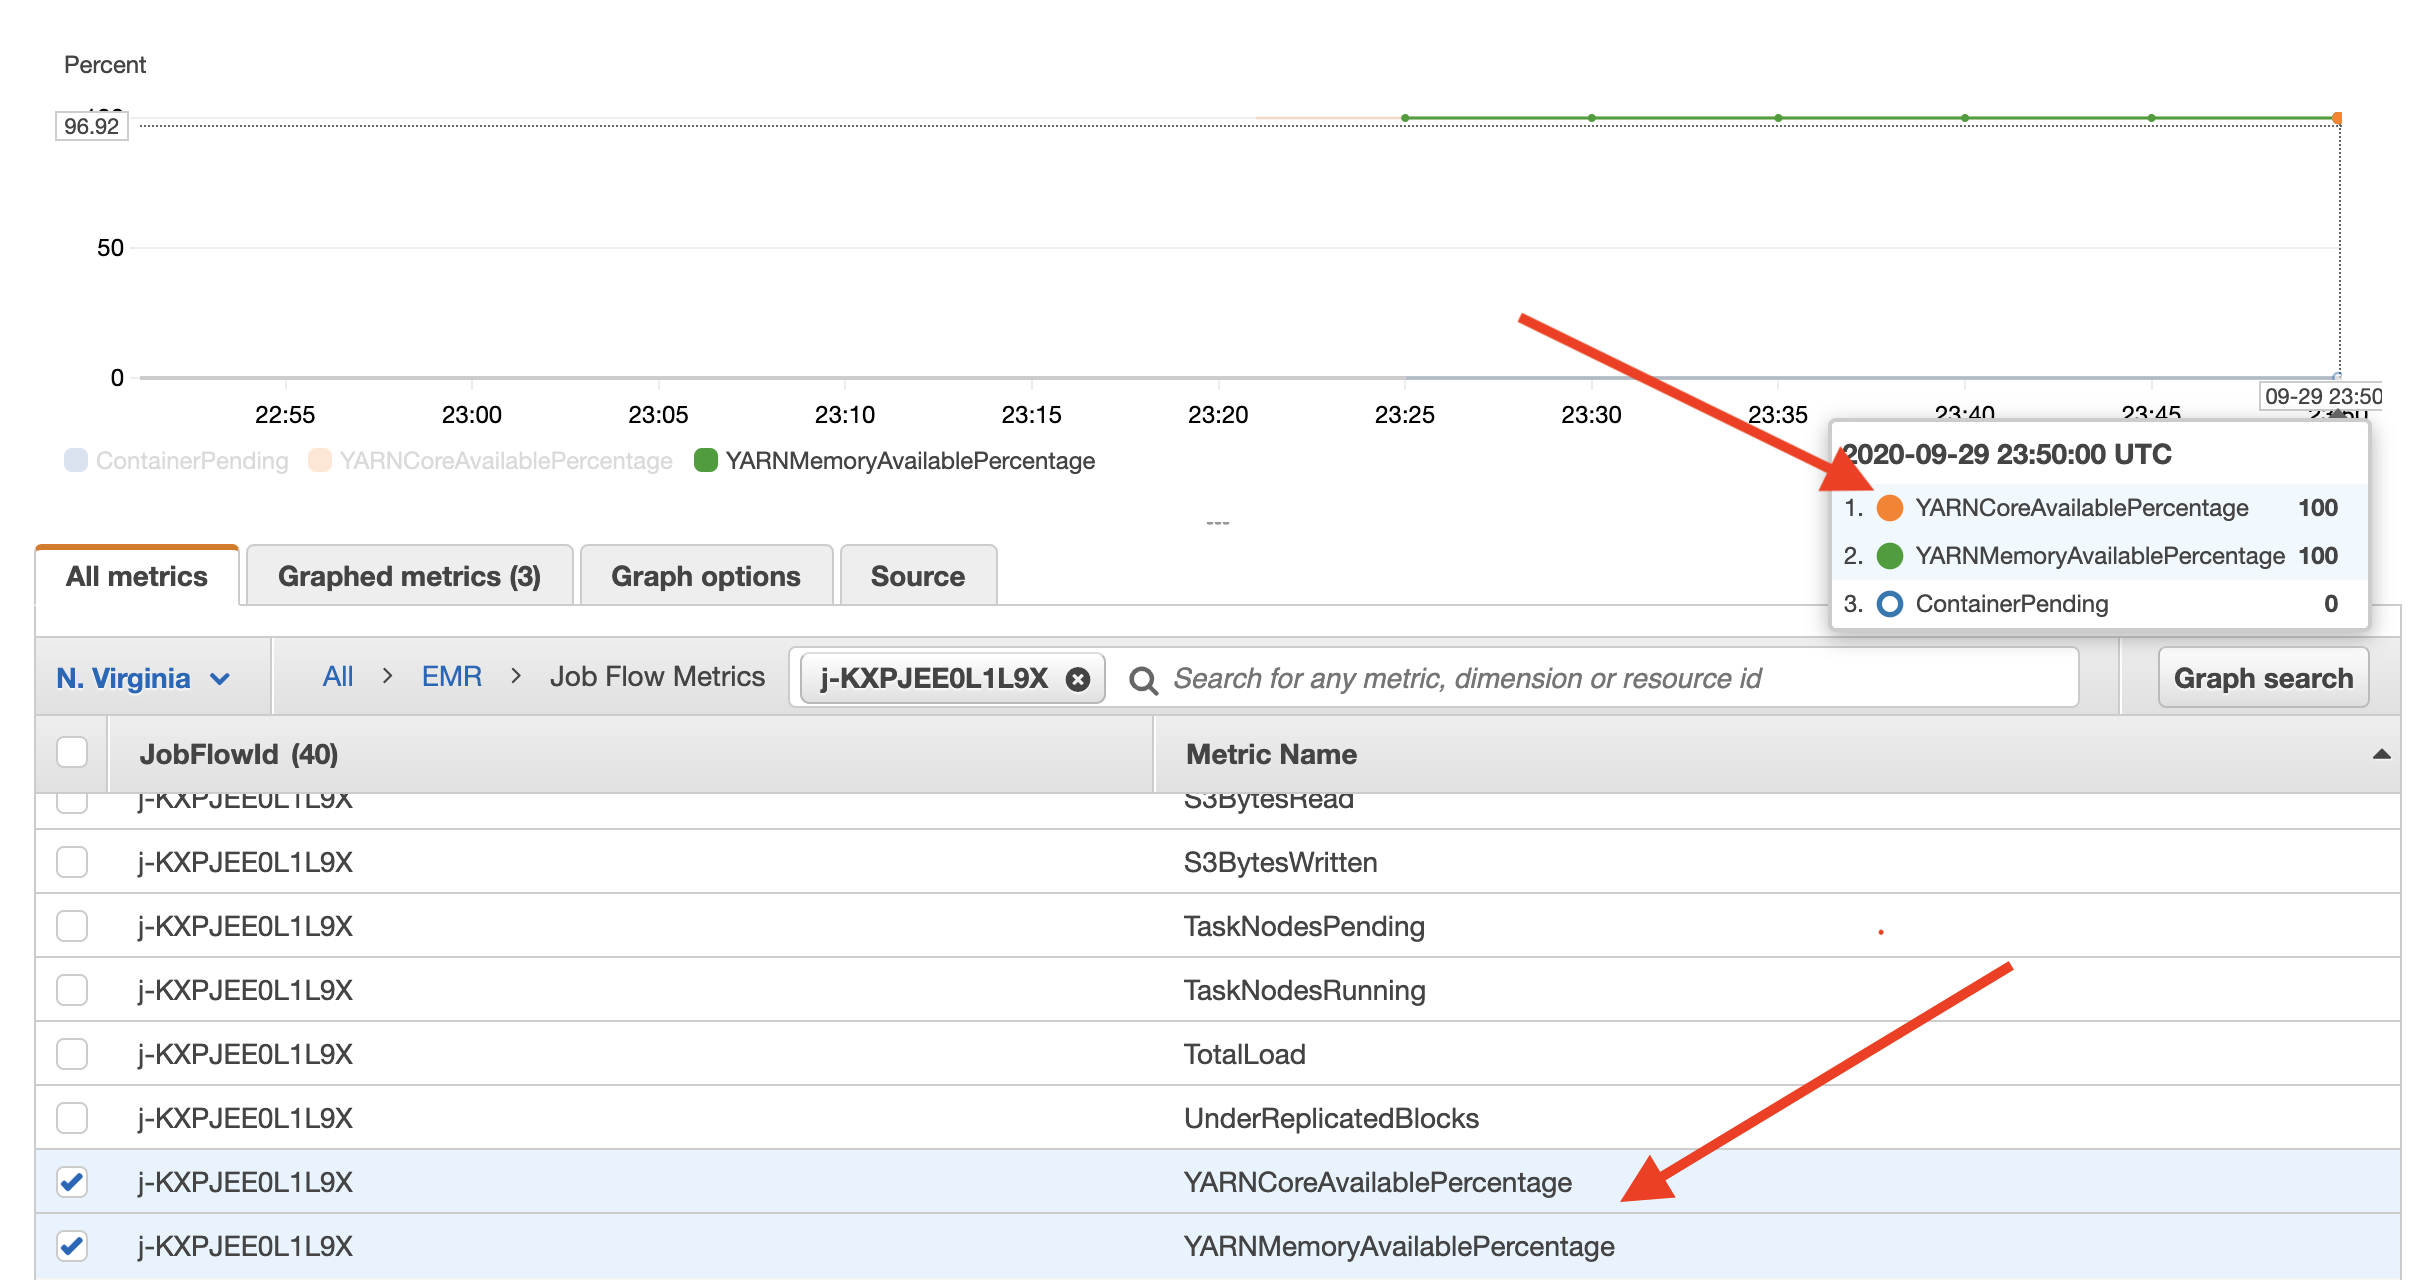
You can check CloudWatch metrics to find the newly delivered YARNCoreAvailablePercentage metric data. This metric will be used in the automatic scaling policy to scale the cluster. As you see in the following picture, the new metric YARNCoreAvailablePercentage is showing up along with the existing metric YARNMemoryAvailablePercentage.
Setting up the Custom Metrics
I am using EMR Bootstrap Action (BA) to set up the custom metrics job on the EMR master node. BA executes the script [setup-custom-metrics.sh](scripts /setup-custom-metrics.sh) which downloads the custom-metrics.sh script from Amazon S3 and configure the cron job to execute that script every 30 seconds.
Using Custom CloudWatch Metrics to configure EMR Automatic Scaling
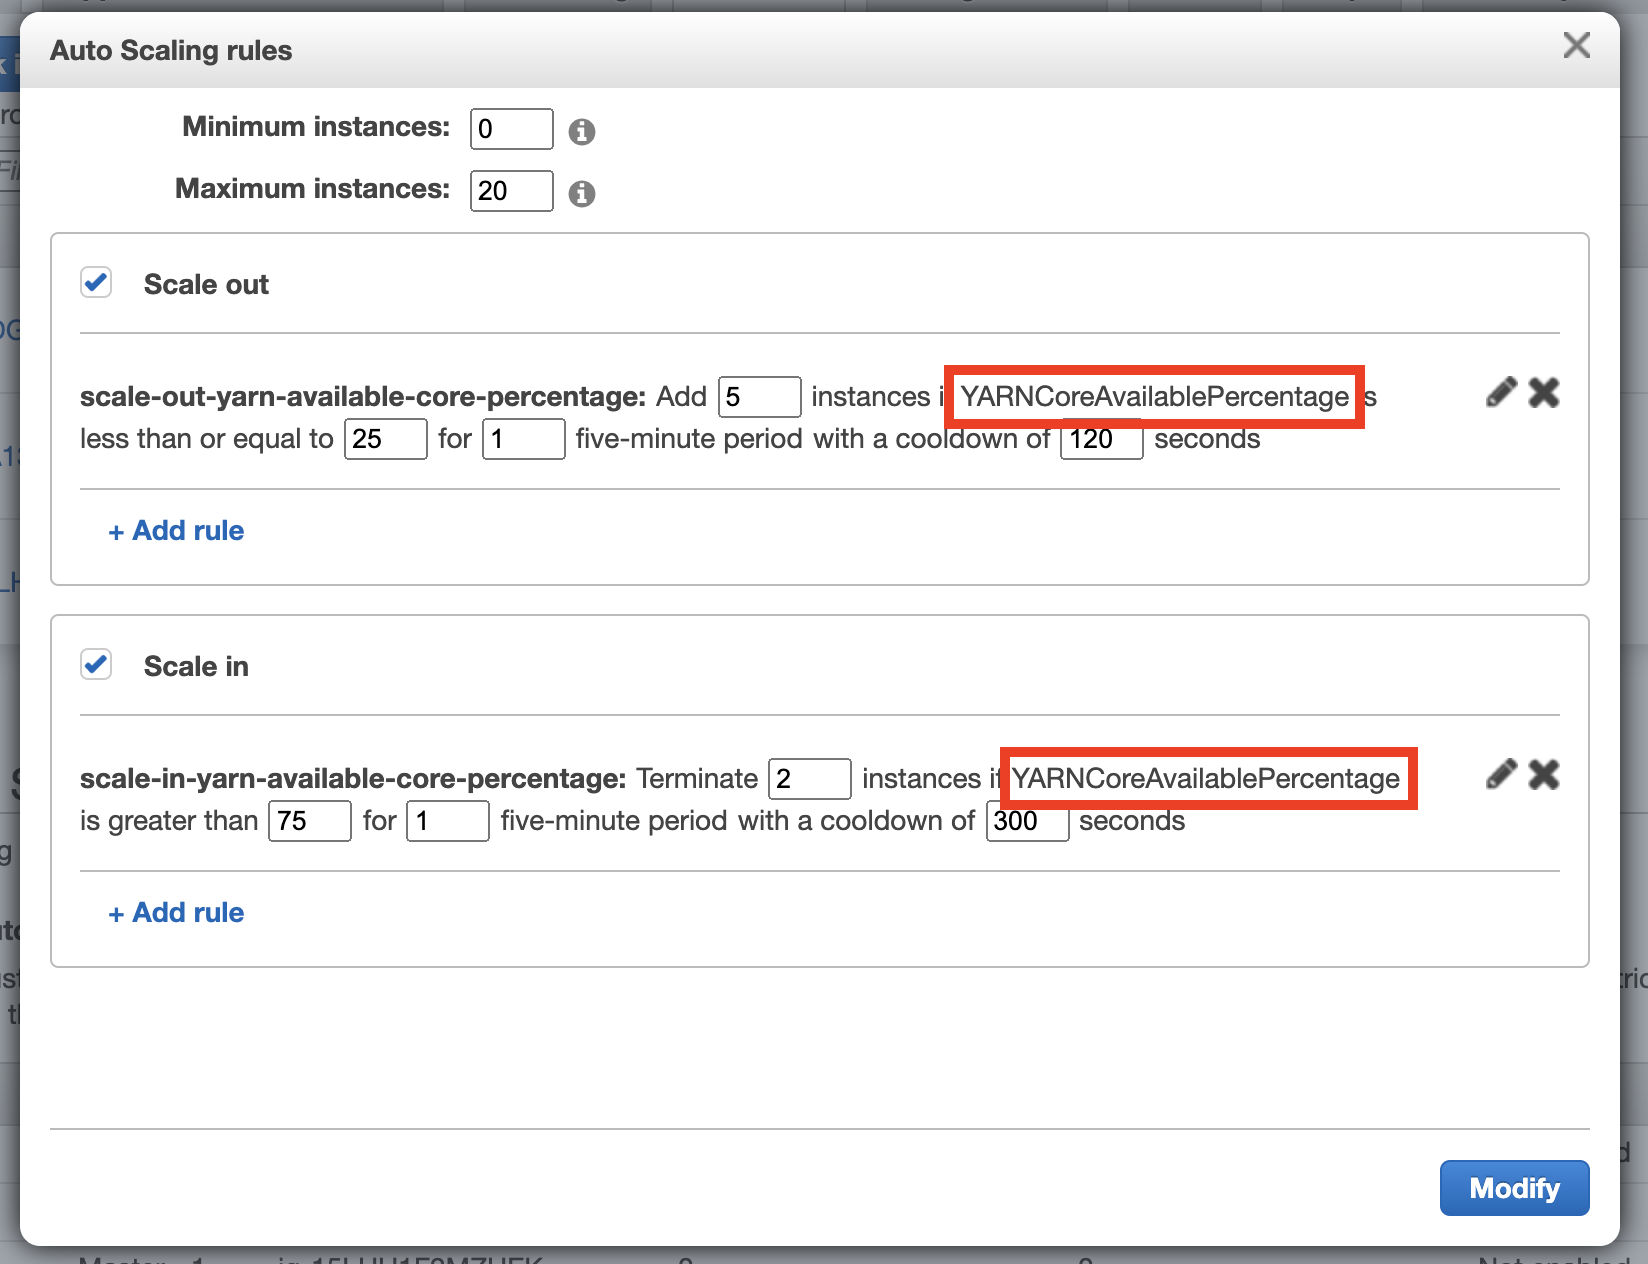
As of now (EMR 5.30.1), you cannot use or configure custom metrics through the EMR console. The only way to use custom metrics to configure EMR automatic scaling is to launch the EMR cluster using AWS CLI. I'm using a separate JSON file instance-group-config.json to pass the instance groups configuration and configuration.json file to update the default YARN calculator . Please change the configuration file based on your requirement. Here is the snippet of the configuration file where I'm using the custom metric value - YARNCoreAvailablePercentage to configure scale-out & scale-in policy . For scale-out, when YARNCoreAvailablePercentage <= 25, it will add 5 nodes to the cluster. For scale-in, when YARNCoreAvailablePercentage > 75, then it will reduce the cluster size by 2.
"Rules":
[
     {
        "Name":"scale-out-yarn-available-core-percentage",
        "Description":"Scale-out policy",
        "Action":{
           "SimpleScalingPolicyConfiguration":{
              "AdjustmentType":"CHANGE_IN_CAPACITY",
              "ScalingAdjustment":5,
              "CoolDown":300
           }
        },
        "Trigger":{
           "CloudWatchAlarmDefinition":{
              "Dimensions":[
                 {
                    "Key":"JobFlowId",
                    "Value":"${emr.clusterId}"
                 }
              ],
              "EvaluationPeriods":1,
              "Namespace":"AWS/ElasticMapReduce",
              "Period":300,
              "ComparisonOperator":"LESS_THAN_OR_EQUAL",
              "Statistic":"AVERAGE",
              "Threshold":25,
              "Unit":"PERCENT",
              "MetricName":"YARNCoreAvailablePercentage"
           }
        }
     },
     {
        "Name":"scale-in-yarn-available-core-percentage",
        "Description":"Scale-in policy",
        "Action":{
           "SimpleScalingPolicyConfiguration":{
              "AdjustmentType":"CHANGE_IN_CAPACITY",
              "ScalingAdjustment":-2,
              "CoolDown":300
           }
        },
        "Trigger":{
           "CloudWatchAlarmDefinition":{
              "Dimensions":[
                 {
                    "Key":"JobFlowId",
                    "Value":"${emr.clusterId}"
                 }
              ],
              "EvaluationPeriods":1,
              "Namespace":"AWS/ElasticMapReduce",
              "Period":300,
              "ComparisonOperator":"GREATER_THAN",
              "Statistic":"AVERAGE",
              "Threshold":75,
              "Unit":"PERCENT",
              "MetricName":"YARNCoreAvailablePercentage"
           }
        }
     }
]
Demo: Automatic Scaling with Custom Metrics
Here is the AWS CLI that I'm using to launch the EMR cluster. I'm passing the autoscaling policies through the parameter --instance-groups. Please make sure to update the following command based on your AWS environment:
aws emr create-cluster --release-label emr-5.30.1 --name 'EMR-With-Custom-Metrics' \
--applications Name=Hadoop Name=Spark Name=Hive Name=Tez Name=Ganglia \
--bootstrap-actions Path=s3://aws-data-analytics-blog/emr-custom-metrics/setup-custom-metrics.sh,Name=SetupCustomMetrics \
--ec2-attributes '{"KeyName":"<<your-key-name>>","InstanceProfile":"EMR_EC2_DefaultRole","SubnetId":"<<your-subnet-id>>"}' \
--service-role EMR_DefaultRole --auto-scaling-role EMR_AutoScaling_DefaultRole \
--instance-groups file://./config/instance-group-config.json \
--configurations file://./config/configuration.json \
--log-uri <<your-s3-log-path>>
Once the cluster is ready, you can verify the autoscaling policy on the Amazon EMR console.
You will notice that the size of the Task node will reduce from 2 to 0. When the cluster is ready and no jobs are running, all vCore will be available, so the YARNCoreAvailablePercentage will be 100%. In the scale-in policy, we trigger scale-in for the Task node when YARNCoreAvailablePercentage > 75. So, after this scale-in process, EMR cluster is ready with 1 Master node and 2 Core nodes.
Now, log in to the EMR master node and submit a Spark job by using the command given below. This Spark job reads Amazon review data in TSV format from Amazon S3, calculates total number of product category and finally converts the data into Parquet and writes back to S3. This job will request > 40 Spark executors to process the data. The goal for this Spark job is to increase the YARN vCore usage, which will trigger the custom scale-out policy. You can also execute this command multiple times to see a dramatic scale-out and scale-in process.
spark-submit --name "SparkJob" --deploy-mode cluster --conf spark.dynamicAllocation.minExecutors=55 \
--conf spark.dynamicAllocation.initialExecutors=55 \
s3://aws-data-analytics-blog/emr-custom-metrics/spark_converter.py \
s3://amazon-reviews-pds/tsv/ <<s3-output-location>>
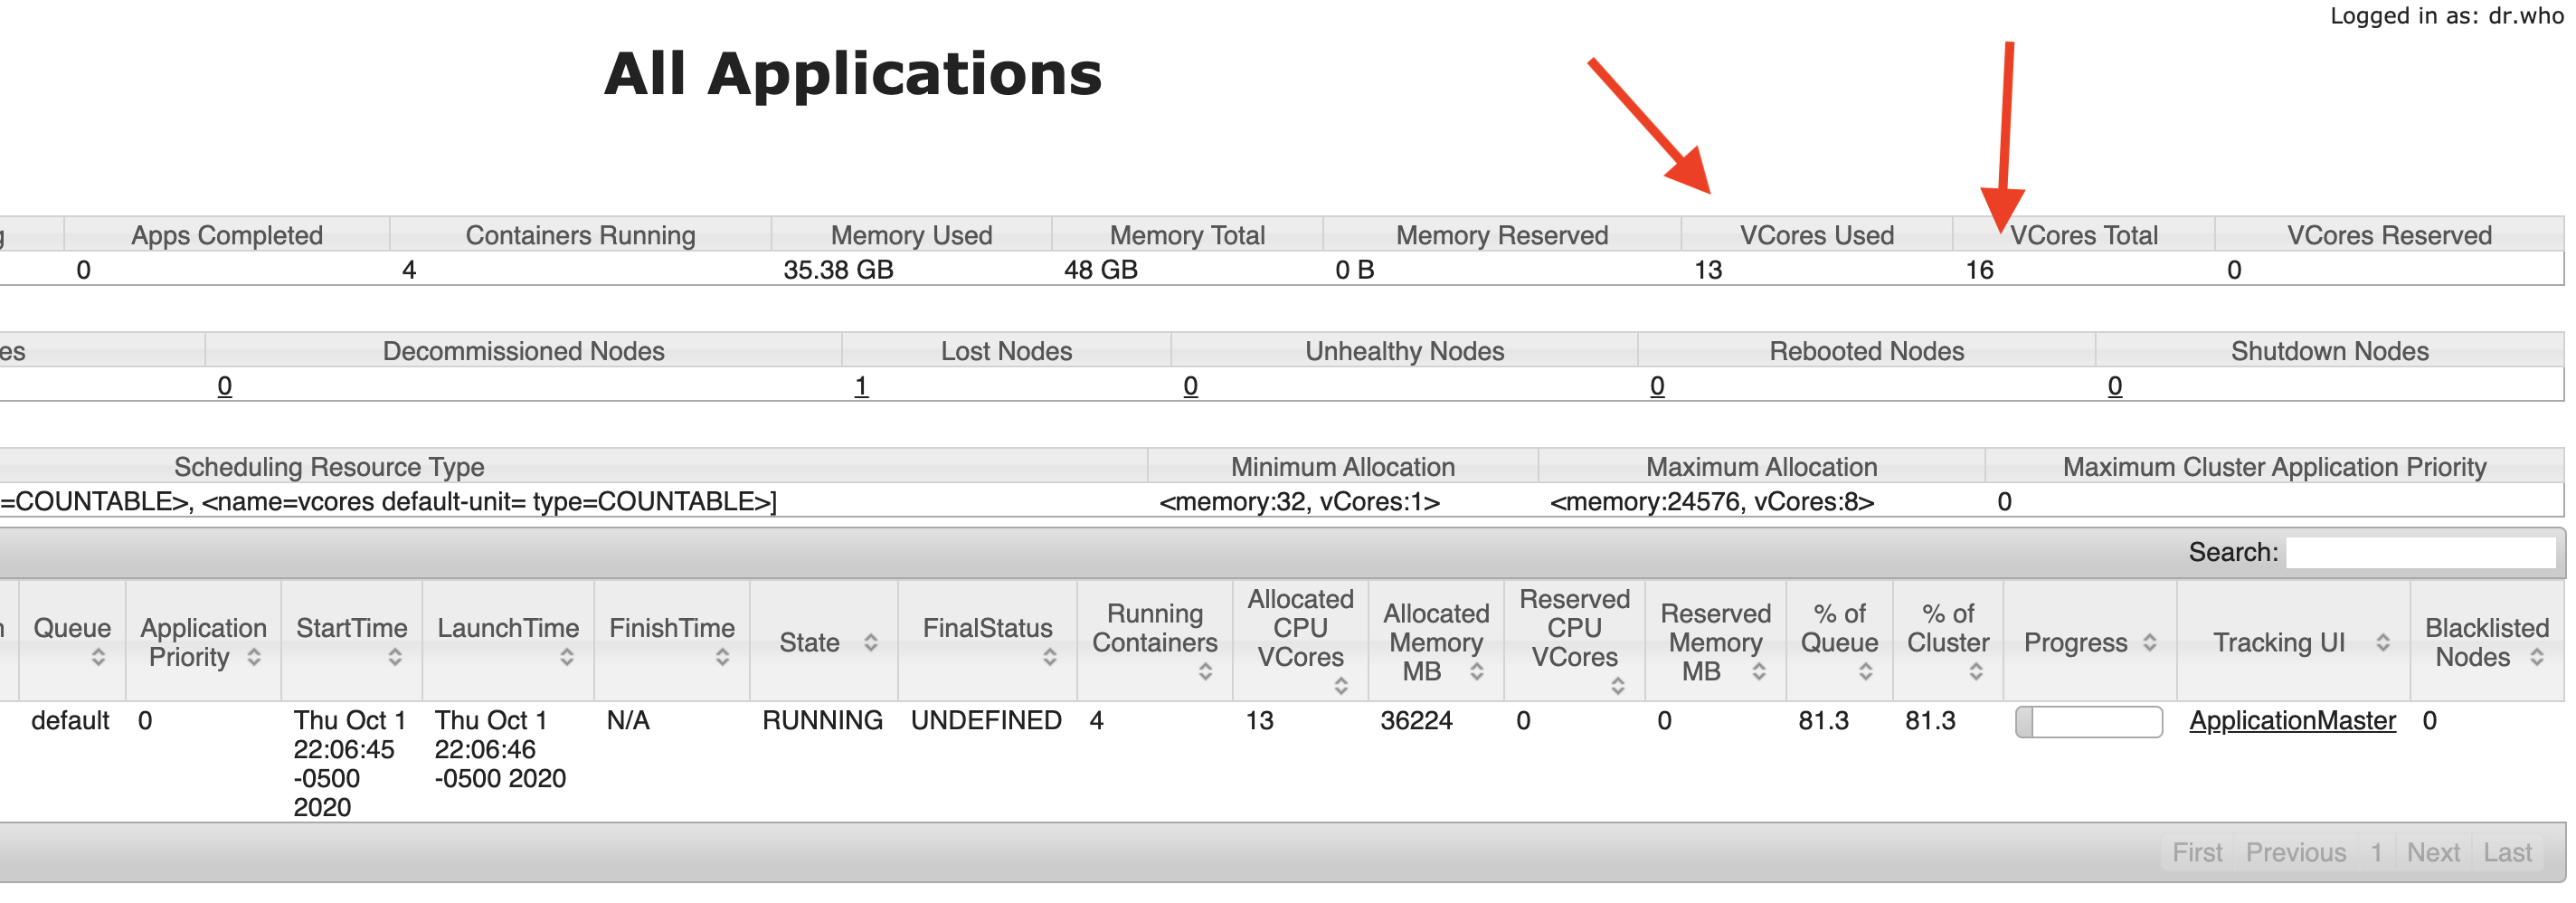
You can verify the increased vCore usage from the Resource Manager UI. On this picture, you see that 13 VCores are being used out of 16:
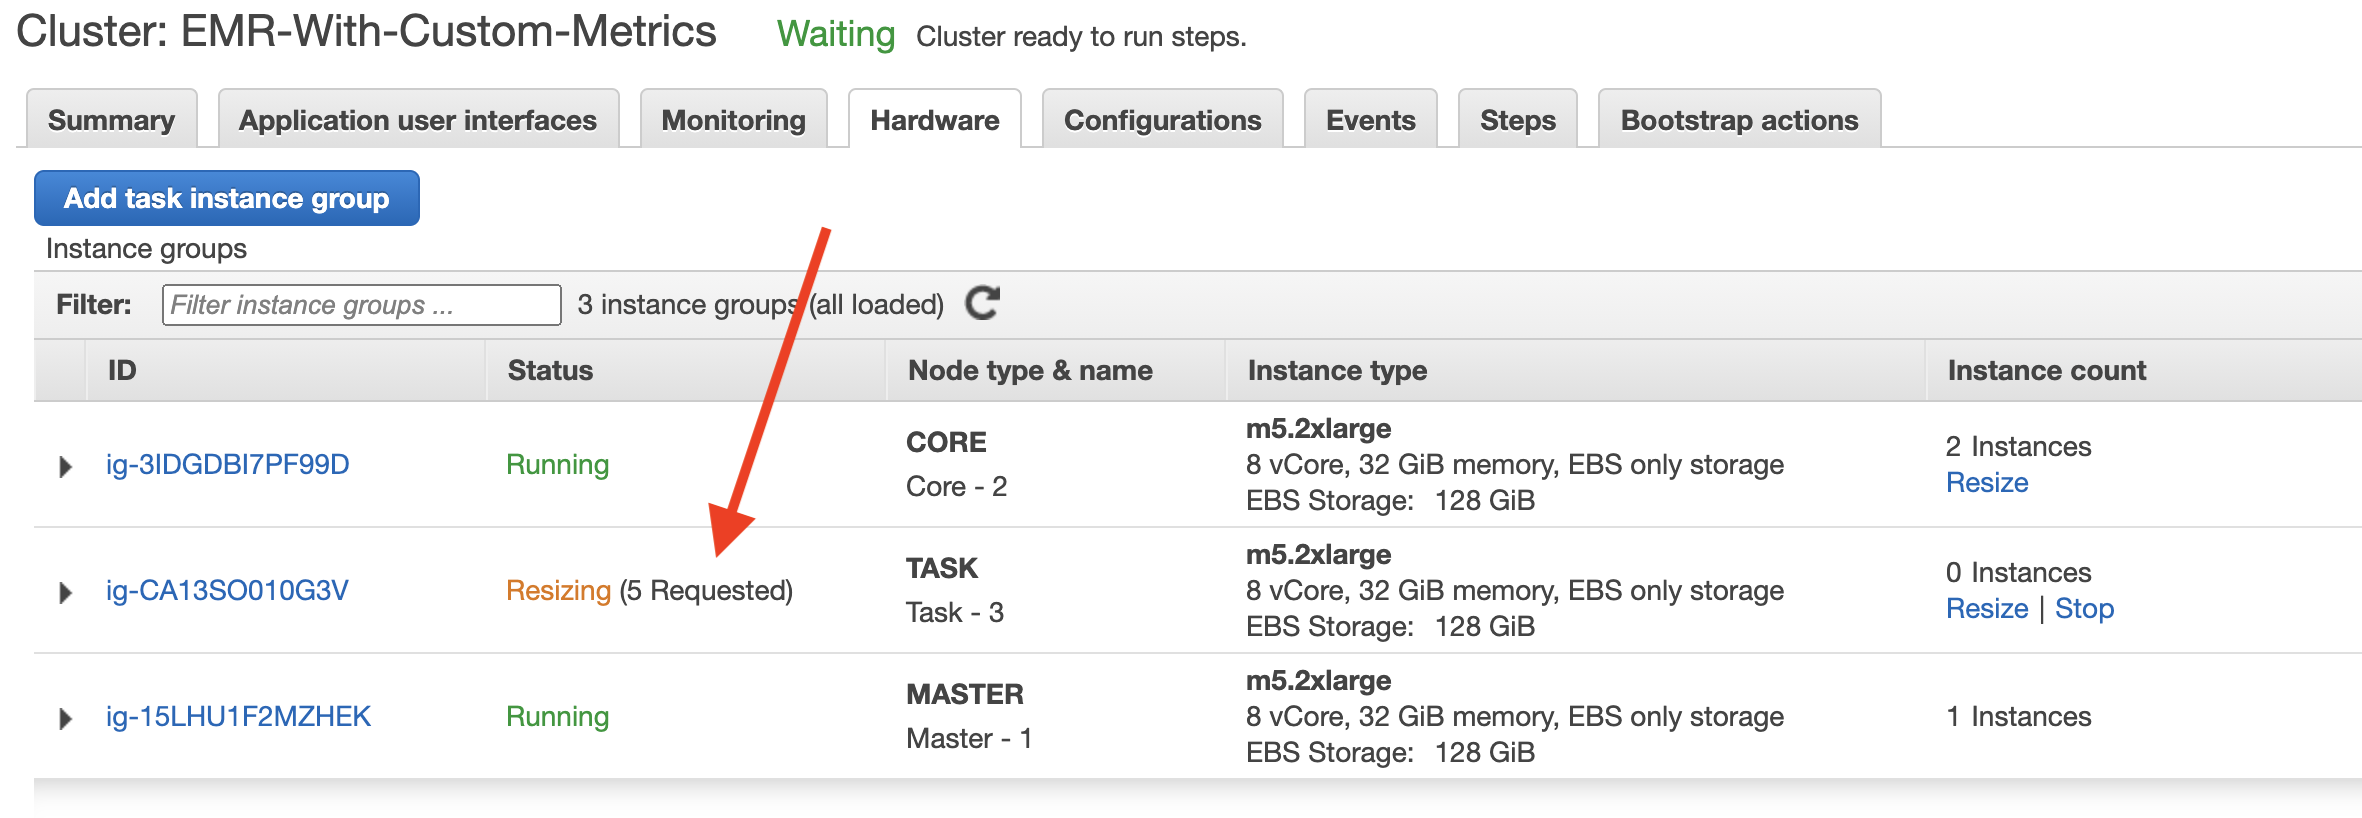
After 5 minutes, you will notice that the cluster is requesting additional 5 Task nodes:
From the CloudWatch console, you can check which scaling rule is in In alarm state:
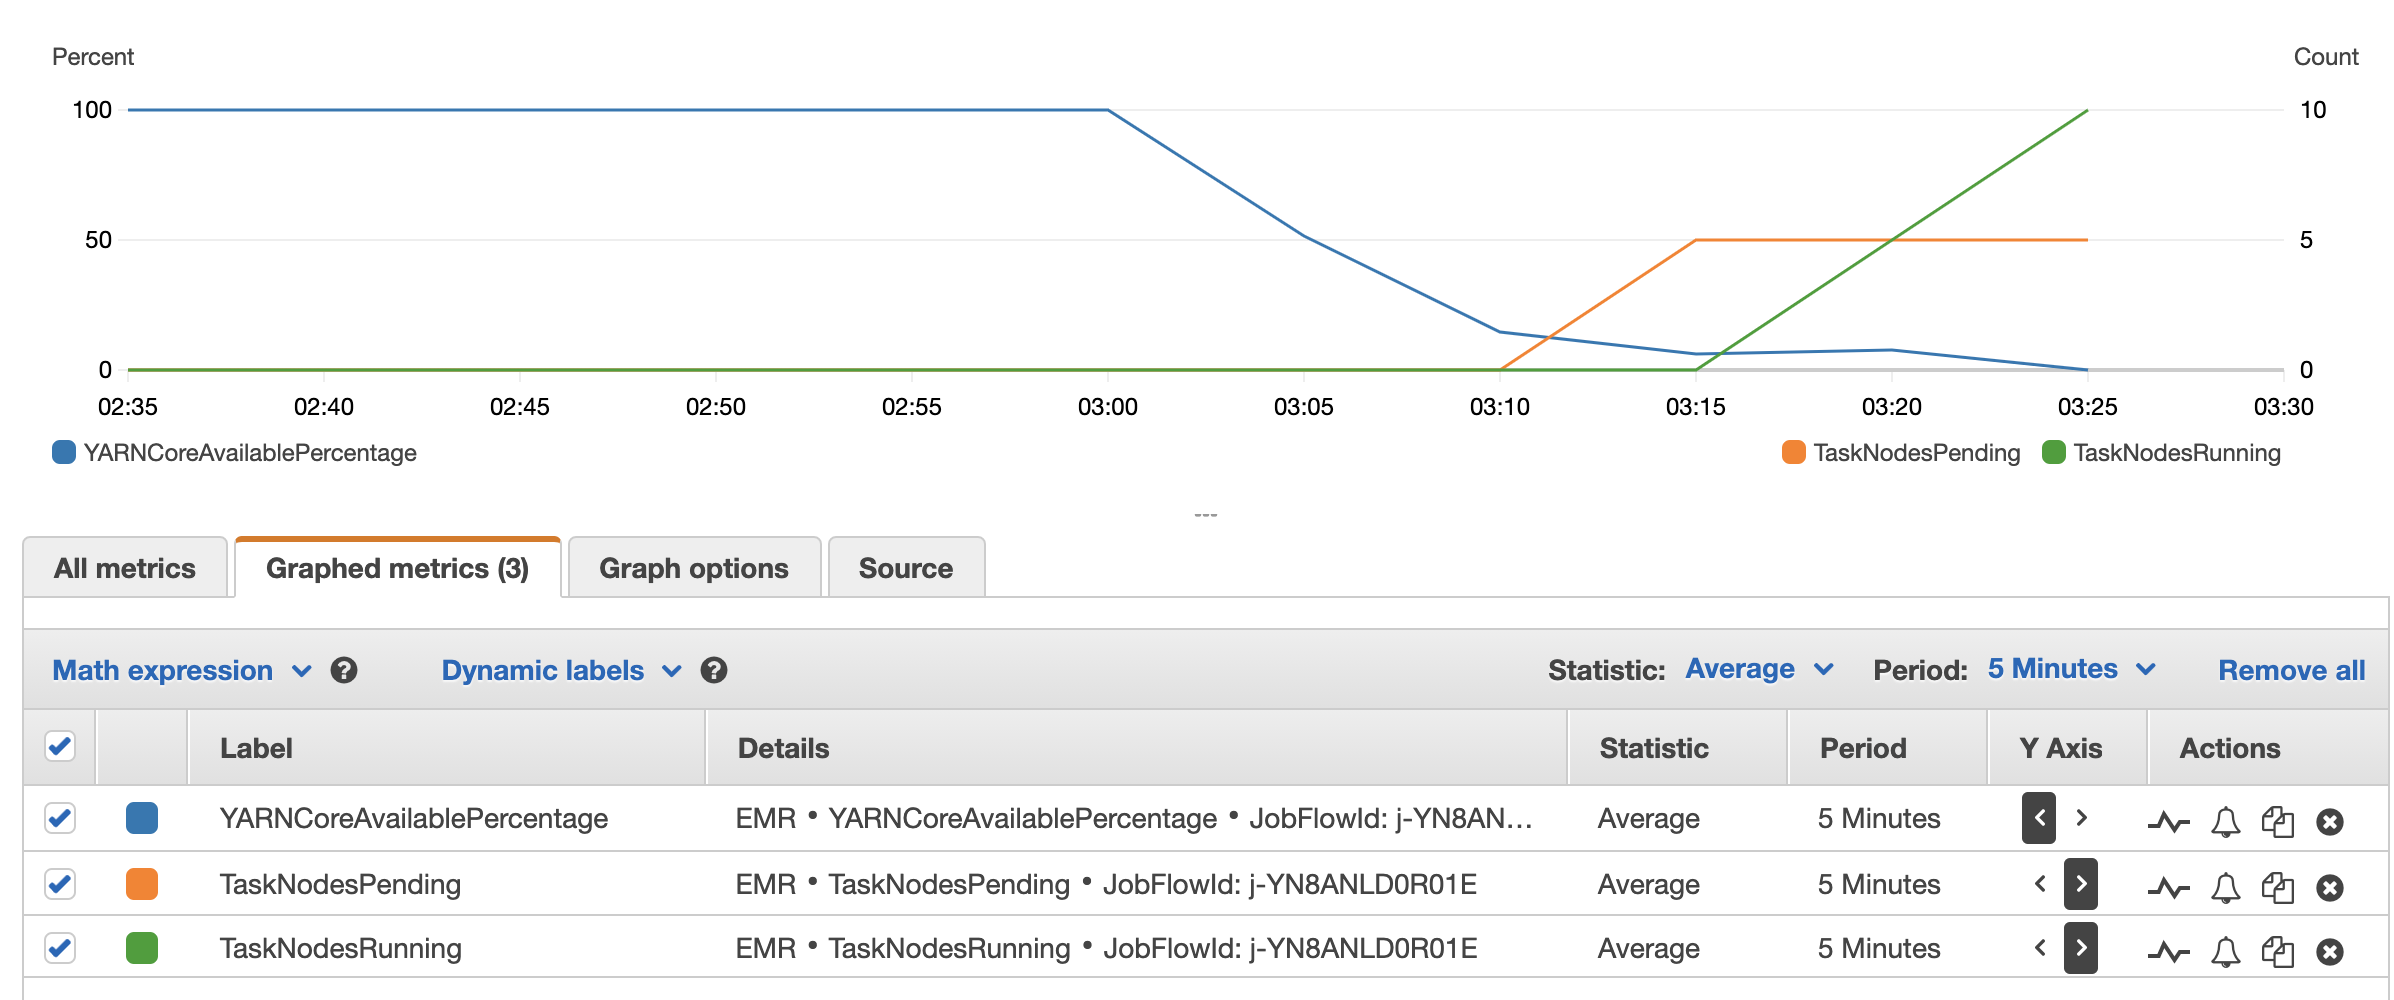
Once the resize process is completed, 5 additional Task nodes will be running, which will increase YARN vCore availability. You can verify that through Resource Manager UI. On the CloudWatch console, you can monitor custom metrics status and scale-in & scale-out actions. In the following figure, the blue line represents YARNCoreAvailablePercentage value, and it drops from 100 to below 10. Within few moments, scale-out kicks in and new additional nodes are added to the cluster. Green line represents the Task nodes count, which increased from 0 to 15.
Considerations
- This solution is just for a reference, it's not built or tested for production workload. Please configure and test before running this solution in production.
- As of now (EMR 5.30.1), custom metrics cannot be used from the Amazon EMR console. You need to use AWS CLI to launch the cluster.
- You cannot clone an existing cluster that uses custom metrics-based autoscaling, it will break the automatic scaling configuration.
- Automatic scaling cannot be changed or de-attached from an existing cluster that uses custom metrics. The only way to apply a new automatic scaling policy is to create a new cluster.
