Analysis for the Best Possible Sports Team with a Specific Focus on Soccer
Introduction
Football Games is one of the most popular sports in the world. From local tournaments to world cups, football lovers are everywhere which produced a lot of entertainment as well as business opportunities to the world. From merchandise of different football teams to football players training, there is no lack of enthusiasts. When it comes to developing a career in the football world, Football Manager is definitely the most exciting one.
1.1 What makes a good Football Manager?
Buying star footballers, keep trying different tactics, and shouting instructions from the dugout. These are what you usually see in the football world of what Football Manager would do, but doing these will make a good Football Manager? Absolutely Not! It is about picking up the right talents for the right positions for the right price.
1.2 Choosing the Right Guy
In general, there are 4 major positions - Forward, Midfielder, Defender, and Keeper with Midfielder and Defender having Left, Centre, and Right. There are a total of 11 people in a team of footballers, all of them have different skill sets. A great Football Manager will be able to pick up the right person for each position meaning the team’s performance will be consistent and able to deliver the results as expected. But is it always the case that the Football Manager is able to do the pick? Why are there some failing Football Managers even in such elite teams as those in Premier League? There are human errors, even though they are two-sided, from the players or Football Manager who picks the players.
1.3 How to reduce human errors in Football
While there are unpredictable changes during a dynamic football game, Football Manager, trying to pick players based on their performance consistency in the games they played before, is less of a hassle. Hence, should not be affected by human errors. How can it be done to get rid of human errors? Try to remove human elements. Humans are subject to emotional, biased, and irrational behaviour.
1.4 Quantify Player Abilities and Make Choices
Each position has its own set of skills, Football Managers choose its players accordingly. In this project, skills of each player role are listed as a score. Different scores are combined to give a player an overall score for their position, resulting in ranking players according to their overall score. Price of each player will be used to normalize a player’s overall score, giving an optimized score of each player. At the end, players will be chosen based on the budget of the football team. By doing this, the team can pick the best players with highest value-performance ratio. Ultimately, the model that is built in this project will be using previous match data of the players to predict the right combination of players for the next game.
Data and Play Analysis
The data focus of this project is downloaded “FIFA 20 Complete PLayer Dataset” available in Kaggle. The dataset covers 5 years of data from FIFA 15 to FIFA 20.
2.1 Data Preprocessing
The original raw data downloaded contains over 100 attributes for each play per year including the nationality, club, date of birth, skills, and salary etc, but not every column is useful. Unrelated columns are removed to reduce the size of dataset and reduce the time to load the dataset afterwards. The useful columns contain information such as players’ skills, position they play, and wage they have.
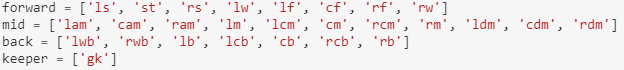
After limiting the size of dataset, data grouping is performed. Players are grouped into 4 major positions according to the below criteria. A dictionary of players of 4 positions is constructed.
In the original dataset, the level of the players are categorized as High/Medium/Low (type: string). These are translated into figures for easy computation and understanding for later sessions.
As a result, the dataset have been prepared for calculation and learning.
2.2 Feature Importance
After grouping players into 4 key positions, the key attributes of each player role are identified. A Stepwise Selection method is performed to identify the top 20 key attributes. This stepwise selection process is done by calculating a p-value for each attribute with regard to the overall score of the player to calculate its significance. Each p-value of the attributes are then ranked and the 20 attributes with smallest p-value are picked.
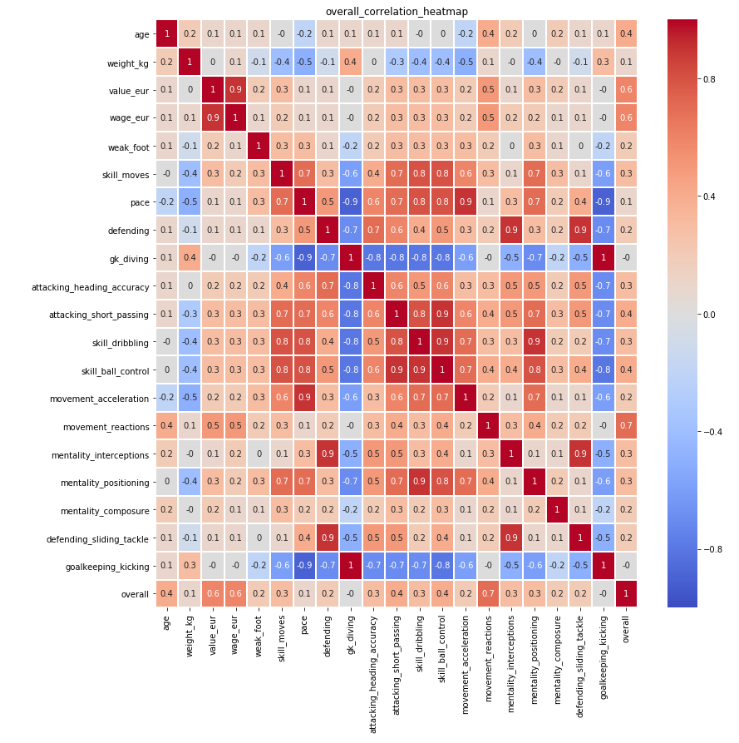
These 20 key attributes have been further compared and analysed among each other according to their correlations. A correlation heatmap is produced. Below is the correlation heatmap for overall score:
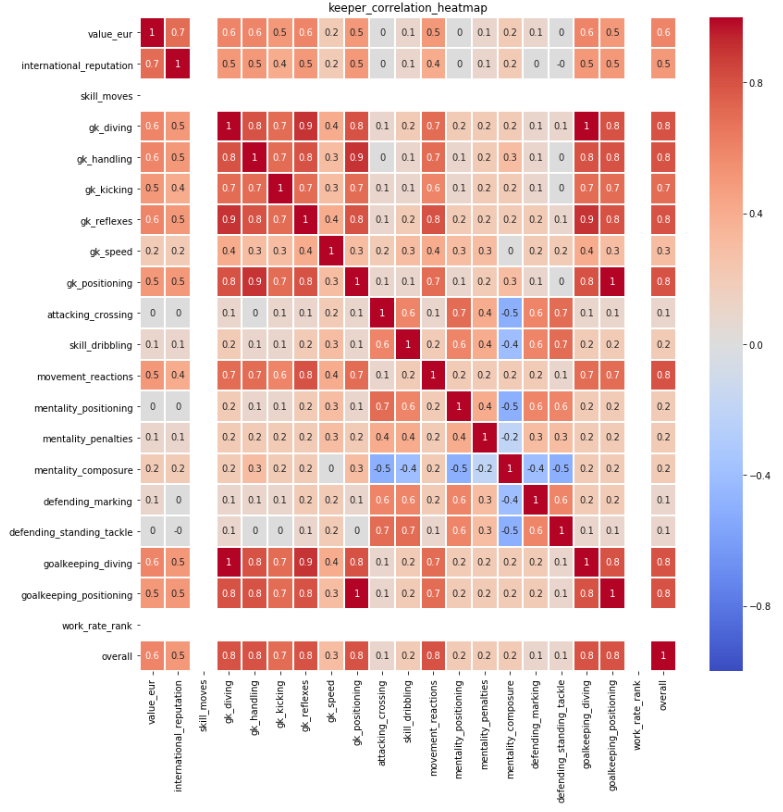
The same for each of 4 positions have been completed to further identify the most important attribute for each position. Please refer to the corresponding Heat Maps in Appendix Figure 1-4. The selection criterion is correlation above 0.7. Below is the results:
Overall:
movement_reaction
Forward:
shooting, passing, dribbing, attacking_short_passing, skill_dribbling, skill_ball_control, movment_reaction, power_long_shots, mentality_positioning
Mid:
shooting, passing, dribbling, attacking_short_passing, skill_dribbling, skill_ball_control, movement_reaction back: defending, movement_reaction, defending_making, defending_sliding_tackle
Keeper:
gk_diving, gk_handling, gk_kicking, gk_reflexes , gk_positioning , movement_reaction, goalkeeping_diving, goalkeeping_positioning
Now that key attributes for each player role have been identified. In the next section, a model prediction will be conducted to predict the score for each play for next year in which this score is then used to calculate the value-performance ratio.
Score Prediction
3.1 Train/Test Split
Total number of variables have been reduced in prior section, the remaining key dataset are split into Training dataset and Testing data set with 8:2 ratio.
3.2 Data Scaling
Just like every other sports team, there are superstars who have high performance than other players and an ultrahigh salary level. In Football, star players can earn a multiple of a good player. Hence they create outliners. They will be removed so that they will not affect the prediction model. Below boxplot extract shows there are certain outliers as expected.
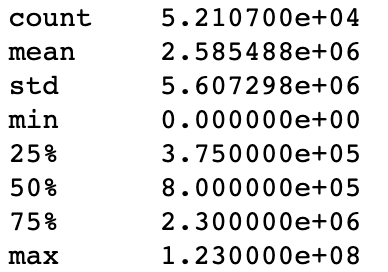
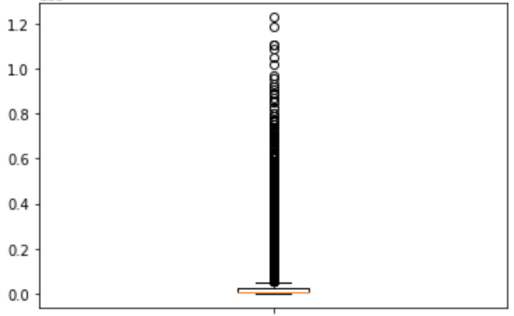
However, analysis on the prediction model will be conducted on dataset with and without outliers for results comparison.
Also, before the prediction model is applied to the dataset, MinMaxScaler has been applied to transform the dataset to a [0,1] scale.
3.3 Predict Models
Two models are used in this report - XGBoost and Multi Linear Regression. Both are prediction models with different keys to note. XGBoost provides a parallel tree boosting (also known as GBDT, GBM) that solve problems in a fast and accurate way. Multi Linear Regression model is one of the most common types of regression model for prediction. It explains the relationship between one continuous dependent variable and two or more independent variables.
After applying both models to the dataset, Root Mean Square Error (RMSE) was calculated for the results and then used to compare the effectiveness of each model with and without filtering out the outliers. The lower the RMSE, the more effective is the model. Also a further Tuning with GridSearchCV was applied to XGBoost model on dataset after filtering out outliers. Below is the RMSE for corresponding models:
| RMSE | |
|---|---|
| MLR (No outlier filter) | 1789941 |
| MLR (Filter outlier) | 2285687 |
| XGboost (No outlier filter) | 2082388 |
| XGboost (filter outlier) | 1449051 |
| XGboost (filter outlier with tuning) | 1447289 |
It is clear that results generated from XGBoost is better than that of MLR. The RMSE of XGBoost applied on dataset without outliers is 1449051 which is about 20% less than that of MLR of 1789941.
Result after tuning for XGBoost applied on dataset without outlier is even better with a lower RMSE of 1447289.
As a result, Player Scores for 2021 have been predicted using XGBoost.
Scenario Analysis - Team Optimization
In Section 3, we have predicted the 2021 wages and scores of the FIFA players. One of the practical applications of our prediction is to create an optimal football team with a relatively reasonable budget.
To better match the reality, instead of building a team from scratch, we will act as the General Manager of team Wolverhampton Wanderers and upgrade the team through firing underperforming players and hiring new players. The steps and assumptions of the trading process will be further illustrated below.
4.1 Step 1: Freeing Up Spaces
We will first fire underperforming players to free up spaces for better players. We define “underperforming players” as players that have below the 3rd interquartile range of average overall ratings at their positions as of 2020. In other words, we will only keep players that rank top 25% in their overall ratings at their positions.
Out of the 33 players in our team, 14 of them are considered as underperforming. These players will be removed from our team. The salary space created is approximately EUR 10.2 million. A brief summary of underperforming players are illustrated below:
Table: Summary on salaries of Underperforming Players in Wolverhampton Wanderers
| position | counts | mean | min | 25% | 50% | 75% | max |
|---|---|---|---|---|---|---|---|
| back | 6 | 327500 | 180000 | 238750 | 350000 | 393750 | 475000 |
| forward | 2 | 1037500 | 675000 | 856250 | 1037500 | 1218750 | 1400000 |
| keeper | 1 | 525000 | 525000 | 525000 | 525000 | 525000 | 525000 |
| mid | 5 | 1137000 | 160000 | 325000 | 700000 | 700000 | 3800000 |
The list of players being removed are listed in Appendix - Error! Reference source not found..
4.2 Step 2: Budgeting
Firing the aforementioned players definitely releases some salary budgets, but that is undoubtedly insufficient for us to perform a comprehensive upgrade to the roster. The team owner has agreed to inject extra capital for us to perform the buying up, but he wants the capital to be spent in an optimal way - he doesn’t want to waste money on superstars that are not cost efficient statistically.
To align with the owner’s objective, we will limit the budget injection for each position as follows: Budget for position k =IQR3 Salary of k ×number of players required
Where IQR3 Salary of kis the 3rd interquartile range of salaries for position k, i.e. the top 25% salary for position k, which is illustrated in the column “75%” in the following table:
Table: Summary on expected salary level in 2021
| position | mean | min | 25% | 50% | 75% | max |
|---|---|---|---|---|---|---|
| back | 1.05E+06 | 0 | 345113.5 | 547554 | 1169489 | 11521064 |
| forward | 1.48E+06 | 0 | 420664.3 | 760403.5 | 1753415 | 17473804 |
| keeper | 6.55E+05 | 0 | 264432.8 | 405468.5 | 697709 | 5944596 |
| mid | 1.37E+06 | 0 | 404113 | 735447 | 1599966 | 17092700 |
Based on this limit, the overall capital available for buying up (which includes the capital injection and salary space released in step 1) is approximately EUR 29.5 million.
4.3 Step 3: Buying Up
The final step for the team upgrade is to buy in high-performing players with positions that match the players fired at step 1. Since we are building this team for the 2021 season, we have utilized our predictions from section 3 when performing the analysis.
Our objective is to maximize the average overall ratings in 2021 for each position k given the budget we have determined in step 2, in order to optimize the team’s overall rating. Please note that both the salary and score data are predicted by the XGboost results in section 3.
Our algorithm will identify all possible combinations of players that can be bought within our budget for each position and choose the combination with highest average overall ratings in 2021.
The list of players being included into our roseter are listed in Appendix – Table A2.
4.4 Team Optimization Result
The new team structure can be summarized by the following graph:
Graph: Illustration of the New Team Structure
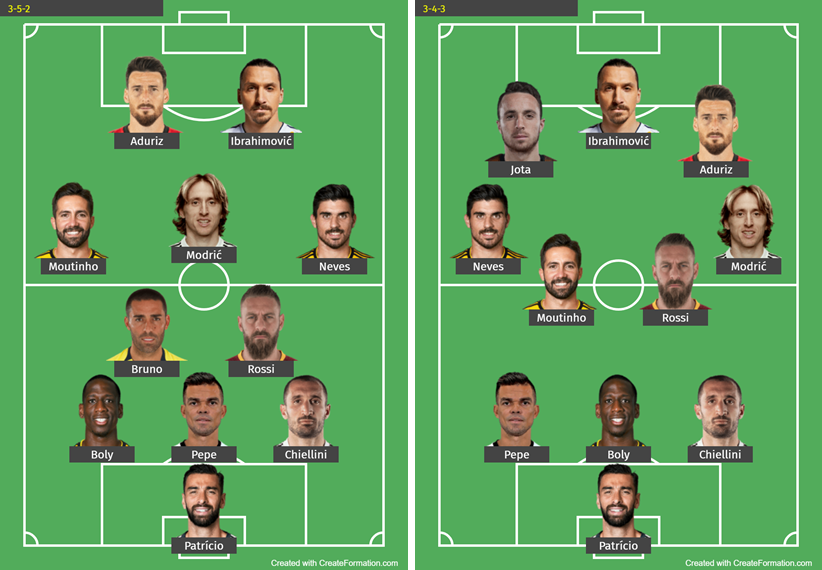
For details of the new roaster, please refer to Appendix – Table A3.
With an injection of EUR 19.2 million, we have managed to upgrade the team from the current rating of 70.5 to an expected rating 77.7 in 2021. We believe that this is a very good value of money that the owner should be satisfied.
Summary and Reflection
In this project, we had adopted various approaches to analyse and predict FIFA player statistics. The information obtained from the prediction model was used to create an optimized team.
We first began with the analysis section, where we identified the relationships between different player attributes, as well as the key factors that contribute to the players’ scores and abilities. Next, we performed model prediction using both traditional multiple linear regression and XGboost to predict players’ wages and scores. Lastly, we had created an algorithm to maximize the rating enhancement of our target team using limited budget.
While we have managed to create the models and algorithms that deliver satisfactory results, it should be noted that the methods that we have adopted are not perfect. Throughout the project, we have identified a number of areas that are subject to further improvements:
5.1 Data Size Problem
The data set that we had used for the project covered only 4 years of player data. Together with the loss of data in the cleaning process, the sample size for our models are relatively limited. This adversely affects model accuracy and stability. If we manage to collect more years of data in the future, it is expected that the model performance can be further enhanced.
On the other hand, the data set we used contained only player attributes. When performing wage predictions, using player attributes only does not fully reflect the reality, as the overall wage level can be affected by commercial factors such as economic index and popularity of the football leagues. If the relevant parameters can be identified and included in our model, the prediction result is expected to improve as well.
5.2 Exclusion of Categorical Features
To facilitate the comparison between traditional multiple linear regression and XGboost, we had assumed that some of the categorical features (e.g. nationality, club, preferred foot and body type) are insignificant to our prediction models. If we add these features back in future, new findings may be observed.
5.3 Choices of Data Cleansing/ Preprocessing Methods
We are aware of the fact that there are many data cleansing/ preprocessing techniques that are potentially applicable to our case, and we have only used a few of them.
Currently, we only adopted minmax scaler in our preprocessing step. It is possible that other scaling methods, such as log-transformation and normalisation, might give better results to our models.
Meanwhile, on feature selection for the model building, we had adopted stepwise method and the value of information gain with linear regression and tree base model respectively. If we had standardized the selection method to principal component analysis, the prediction results may be different, which is worth further analysis in the future.
5.4 Limitation of Time and Computing Power
When performing XGboost, it is possible to adopt grid search for tuning the model, which will further enhance model performance. However, the process is extremely time-consuming given our limited computing power, and we only performed grid search on a few basic parameters, such as max depth, gamma, learning rate, etc. As a result, we were only able to demonstrate that tuning is useful, but we were unable to fully utilize its power through an exhaustive search.
There are many tuning tools that are widely discussed in the internet, such as tpot. These tools can be useful to us in determining what model to use, as well as finding out the optimal parameters. However, the requirements on computing power are generally high. If we really want to adopt these methods in future, better computing resources will be required.
5.5 Conclusion
With the technical issues above properly resolved, it is expected that our model can provide a realistic analysis to the FIFA market. Further research can be performed to effectively implement our insights in Football Manager level.
Appendix
Table A1: List of Players Being Removed
| name | age | position | 2020 rating |
|---|---|---|---|
| M. Gibbs-White | 19 | mid | 70 |
| Pedro Neto | 19 | forward | 66 |
| J. Graham | 24 | mid | 65 |
| P. Ofosu-Ayeh | 27 | back | 65 |
| M. Shabani | 20 | mid | 63 |
| H. Burgoyne | 22 | keeper | 63 |
| B. Ashley-Seal | 20 | forward | 62 |
| C. Johnson | 21 | back | 62 |
| M. Kilman | 22 | back | 60 |
| J. Kitolan | o 19 | back | 60 |
| Bruno Jordão | 20 | mid | 60 |
| O. Rasmussen | 21 | back | 58 |
| D. Sanderson | 19 | back | 56 |
| T. Perry | 17 | mid | 55 |
Table A2: List of Players Being Hired
| name | age | club | position | rating |
|---|---|---|---|---|
| Z. Ibrahimović | 37 | LA Galaxy | forward | 83 |
| Aduriz | 38 | Athletic Club de Bilbao | forward | 81 |
| L. Modrić | 33 | Real Madrid | mid | 89 |
| D. De Rossi | 35 | Boca Juniors | mid | 81 |
| Bruno | 35 | Villarreal CF | mid | 77 |
| S. Sessègnon | 35 | Gençlerbirliği SK | mid | 75 |
| A. Romao | 35 | Stade de Reims | mid | 74 |
| G. Chiellini | 34 | Juventus | back | 88 |
| Pepe | 36 | FC Porto | back | 82 |
| N. Pallois | 31 | FC Nantes | back | 78 |
| Bruno Alves | 37 | Parma | back | 71 |
| Benjamin Meseira | 35 | Chapecoense | back | 72 |
| M. Marić | 35 | FC Lugano | back | 66 |
| R. Jarstein | 34 | Hertha BSC | keeper | 82 |
Table A3: The Upgraded Wolverhampton Wanderers Roster
| name | age | 2020 rating | 2021 rating | player_positions |
|---|---|---|---|---|
| L. Modrić | 33 | 90 | 89 | CM |
| João Moutinho | 32 | 84 | 83 | CM |
| Rúben Neves | 22 | 82 | 83 | CM |
| D. De Rossi | 35 | 82 | 81 | CDM |
| L. Dendoncker | 24 | 78 | 79 | CM, CB |
| Bruno | 35 | 78 | 77 | CM, CDM |
| R. Saïss | 29 | 77 | 76 | CDM, CB |
| S. Sessègnon | 35 | 76 | 75 | CAM |
| A. Romao | 35 | 75 | 74 | CDM |
| Rui Patrício | 31 | 83 | 82 | GK |
| R. Jarstein | 34 | 83 | 82 | GK |
| J. Ruddy | 32 | 70 | 70 | GK |
| Z. Ibrahimović | 37 | 85 | 83 | ST |
| Aduriz | 38 | 82 | 81 | ST |
| Diogo Jota | 22 | 80 | 81 | CF, LW |
| R. Jiménez | 28 | 80 | 80 | ST |
| P. Cutrone | 21 | 77 | 78 | ST |
| Adama Traoré | 23 | 74 | 75 | RW, RWB |
| Léo Bonatini | 25 | 72 | 72 | ST |
| G. Chiellini | 34 | 89 | 88 | CB |
| Pepe | 36 | 84 | 82 | CB |
| Jonny | 25 | 79 | 79 | LWB, LB |
| W. Boly | 28 | 79 | 79 | CB |
| N. Pallois | 31 | 79 | 78 | CB |
| M. Doherty | 27 | 78 | 78 | RWB |
| Vallejo | 22 | 77 | 78 | CB |
| C. Coady | 26 | 77 | 77 | CB |
| R. Bennett | 29 | 73 | 73 | CB |
| Bruno Alves | 37 | 73 | 71 | CB |
| Benjamin Meseira | 35 | 73 | 72 | RB |
| Rúben Vinagre | 20 | 70 | 72 | LWB |
| Roderick Miranda | 28 | 70 | 70 | CB |
| M. Marić | 35 | 67 | 66 | CB |
Figure 1: Forward_Correlation_Heatmap
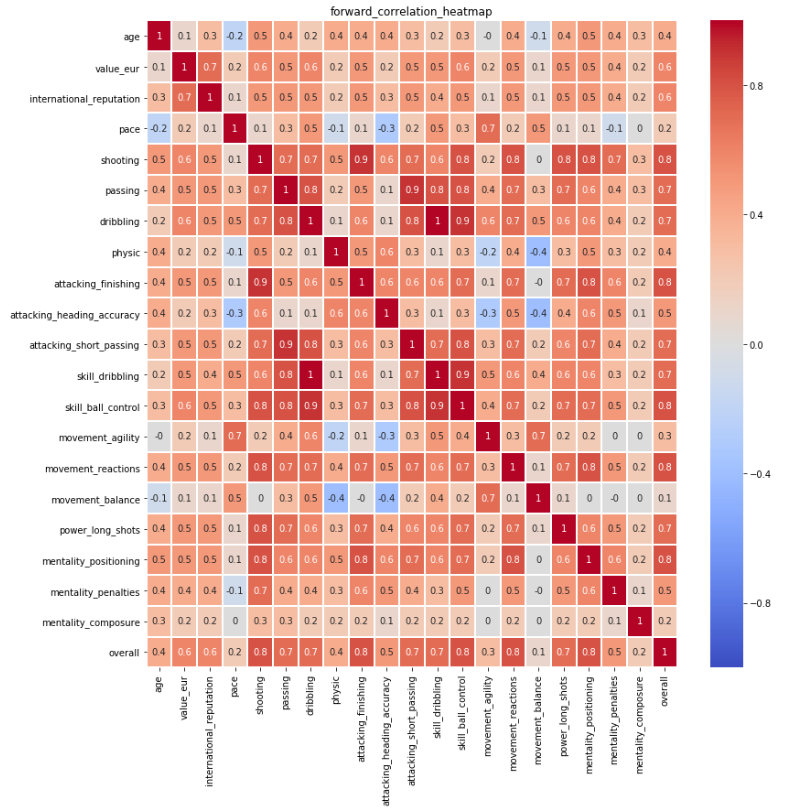
Figure 2: Mid_Correlation_Heatmap
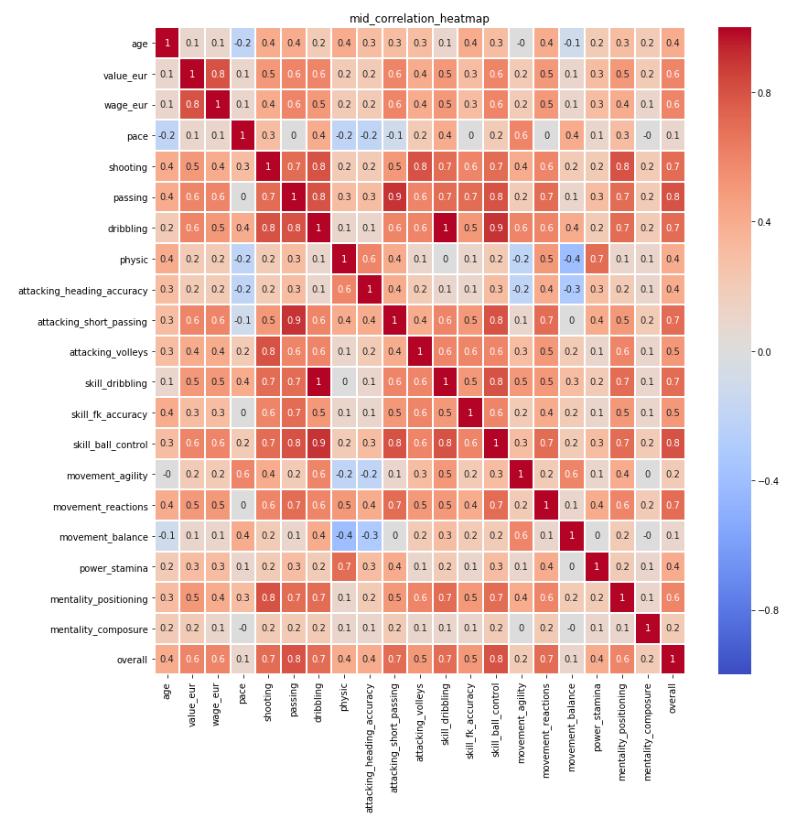
Figure 3: Back_Correlation_Heatmap
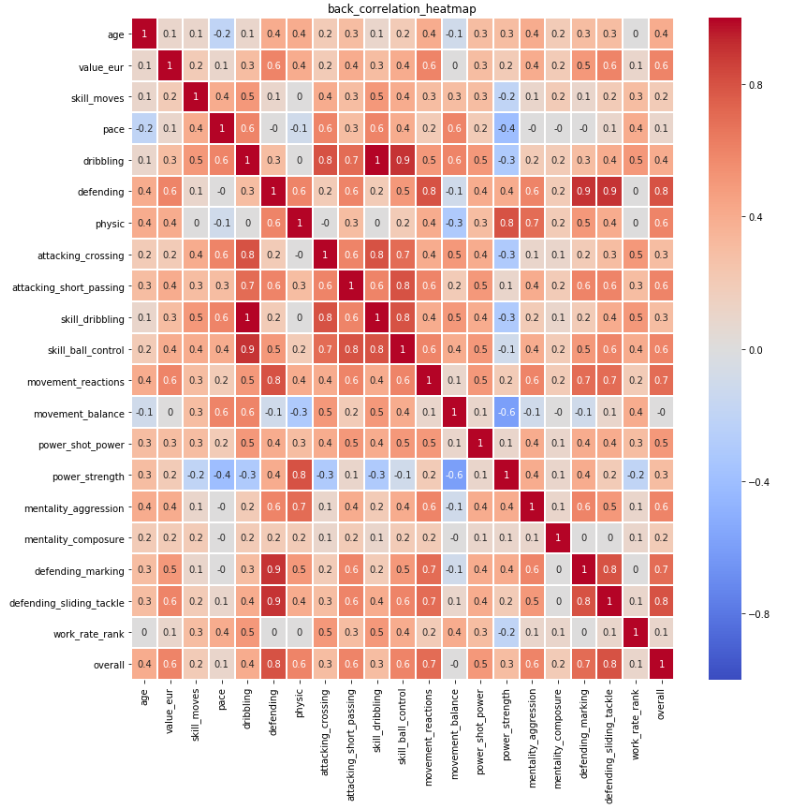
Figure 4: Keep_Correlation_Heatmap