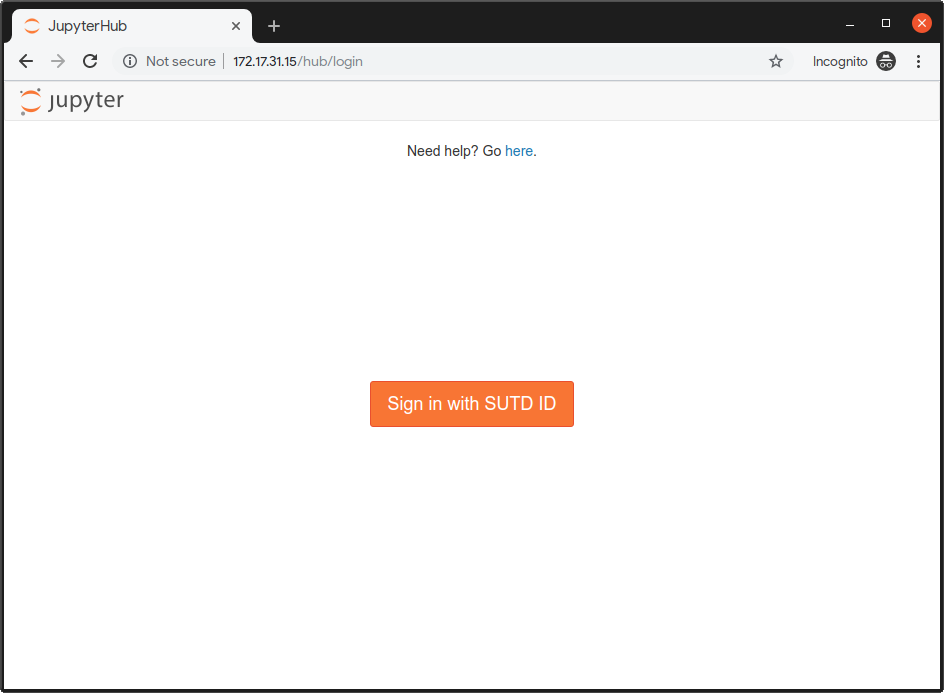
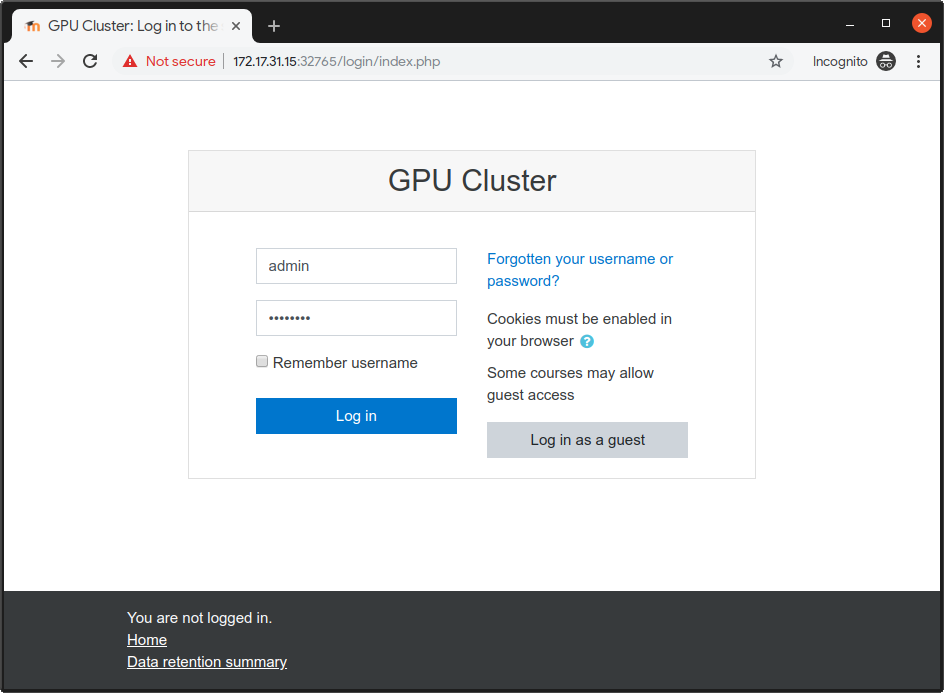
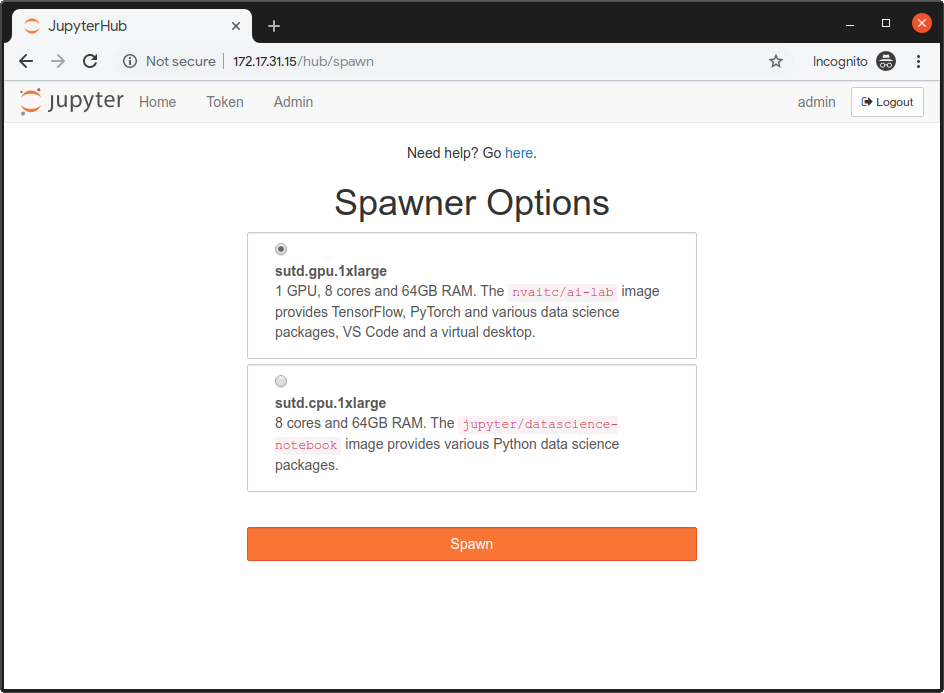
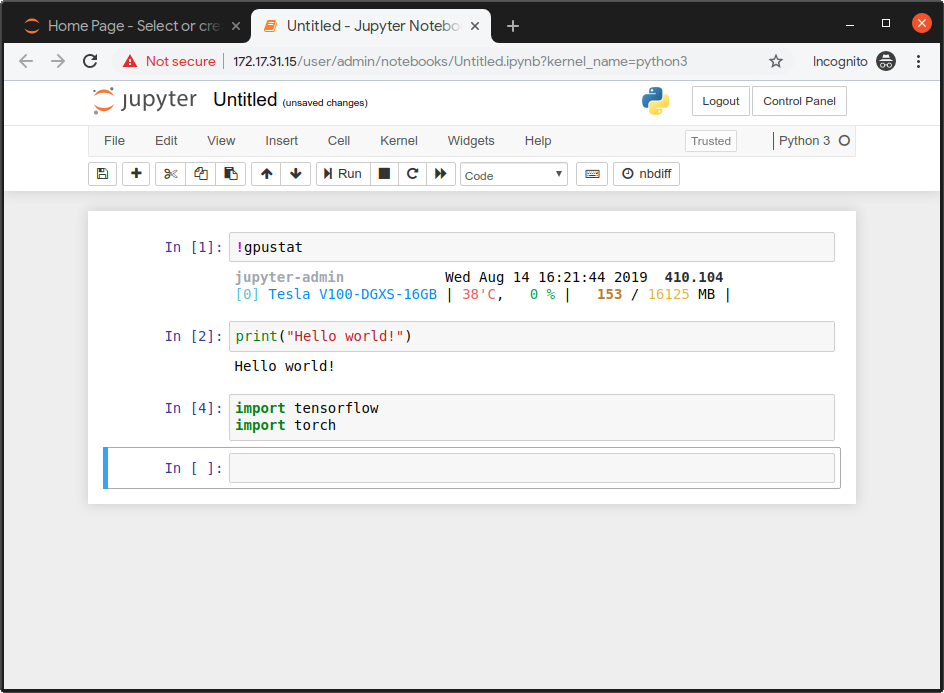
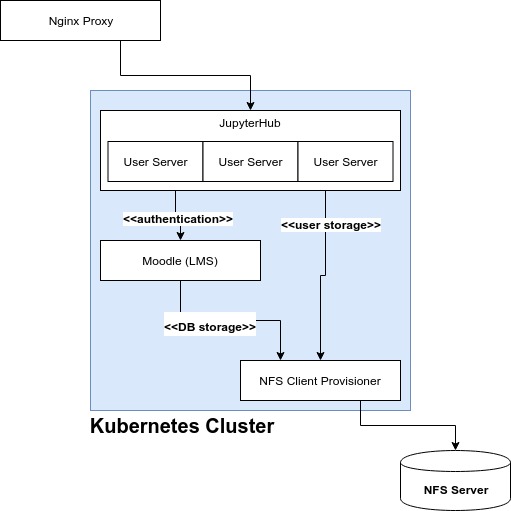
This is a setup guide to configure an On-prem JupyterHub cluster running on Kubernetes, with login and user management. It assumes you already have the physical cluster networking configured.
- Kubernetes provides the underlying infrastructure
- Moodle provides user management (geared towards schools) and OAuth authentication service
- JupyterHub provides a multi-user environment for Jupyter servers
- Dedicated NFS Server provides pods with persistent storage
This design assumes the Kubernetes cluster's physical network is isolated, with a proxy node used to provide a single entrypoint into the cluster. Nginx is used on this proxy node to provide the following proxies so that external users can access the cluster via proxy-ip, the external IP address of the proxy node.
proxy-ip:80-> JupyterHubproxy-ip:5050-> Moodleproxy-ip:3000-> Grafana (monitoring dashboard)
This is important as this will be part of the OAuth configuration (e.g. callback URL).
This section needs to be run on every new node prior to setting up the Kubernetes cluster.
- Install Ubuntu 18.04 LTS
- Run commands below:
sudo su root
# as root user
apt-get update && apt-get install -y curl
# baller one liner move
export NODE_SETUP_SCRIPT=https://raw.githubusercontent.com/NVAITC/onprem-gpu-cluster-setup/master/setup_node.sh
curl $NODE_SETUP_SCRIPT | bash
# system will automatically reboot after done
Post Install for GPU Nodes
After system reboot, perform the follow step to set the default container runtime to the NVIDIA Container Runtime and allow your default user to use Docker without sudo:
sudo usermod -aG docker $USER
sudo nano /etc/docker/daemon.json
Modify your file to look something like this:
{
    "default-runtime": "nvidia",
    "runtimes": {
        "nvidia": {
            "path": "nvidia-container-runtime",
            "runtimeArgs": []
        }
    }
}
Do sudo pkill -SIGHUP dockerd to restart the Docker daemon.
This section will deploy Kubernetes on the master node, and then provide you with the command to run on each worker node in order to join the Kubernetes cluster.
Reference: https://kubernetes.io/docs/setup/production-environment/tools/kubeadm/create-cluster-kubeadm/
TODO:
Change network plugin from Flannel to another which supports network security policies
Part 1: Master Node
sudo kubeadm init --pod-network-cidr=10.244.0.0/16

mkdir -p $HOME/.kube
sudo cp -i /etc/kubernetes/admin.conf $HOME/.kube/config
sudo chown $(id -u):$(id -g) $HOME/.kube/config

# you might want to check for an updated Flannel:
# https://kubernetes.io/docs/setup/production-environment/tools/kubeadm/create-cluster-kubeadm/#pod-network

kubectl apply -f https://raw.githubusercontent.com/coreos/flannel/2140ac876ef134e0ed5af15c65e414cf26827915/Documentation/kube-flannel.yml

# allow pods to schedule on master
kubectl taint nodes --all node-role.kubernetes.io/master-

# check pods to make sure all running
kubectl get pods --all-namespaces
Part 2: Other Nodes
Run the join command (included in output of kubeadm init in the previous section). If you need to get the join command again, you can generate a new one with: kubeadm token create --print-join-command.
Run kubectl get nodes as a sanity check. Every node should be in Ready state within 60s.
Post Install
Deploy NVIDIA device plugin:
kubectl create -f https://raw.githubusercontent.com/NVIDIA/k8s-device-plugin/1.0.0-beta4/nvidia-device-plugin.ymlYou can check for a newer version of the plugin here.
Within 60s, the GPUs should be visible to Kubernetes. You can run the follow command to check:
kubectl get nodes -o=custom-columns=NAME:.metadata.name,GPUs:.status.capacity.'nvidia\.com/gpu'Before following the instructions, you can check for the latest version of Helm here. The instructions below work for Helm 3.x and not 2.x!
wget https://get.helm.sh/helm-v3.1.2-linux-amd64.tar.gz
tar -xvf helm-v3.1.2-linux-amd64.tar.gz linux-amd64/
chmod +x linux-amd64/helm
sudo mv linux-amd64/helm /usr/local/bin/helm

# initialize Helm

helm repo add stable https://kubernetes-charts.storage.googleapis.com/
helm repo add bitnami https://charts.bitnami.com/bitnami
helm repo updateIn this section, you will deploy a NFS server if you don't already have one, and create the Kubernetes nfs-client-provisoner in order to access the NFS server from Kubernetes. This step is very important as any pods that requires persistent state (e.g. databases, user files etc.) will need this storage backend.
You will need an NFS storage server. This will not be managed by Kubernetes, but can run on one of your Kubernetes nodes.
If you are using a hard-disk array, you should use RAID 5, which gives you reasonable redundancy, good read speeds but relatively lousier write speeds. We prioritise read speeds as these could be a bottleneck during training. If using a hardware RAID card, be sure to enable the controller cache.
This is a simple procedure, you can follow guides online such as this one. Take note of your NFS server's IP address and system path to your NFS share, e.g. /mnt/RAID/. However, there are a few configuration details you need to take note of:
/mnt/RAID/ 10.12.0.0/16(rw,async,no_subtree_check,no_root_squash)
- Whitelisted IP address should be that of your physical nodes
- Add
asyncfor better performance at the cost of possible data corruption if the server reboots while still holding unwritten data in its caches no_root_squashis (unfortunately) needed since some containers will otherwise not be able to write their attached volumes since they run asroot
This will create a Kubernetes StorageClass for Pods to use to create persistent volumes (via PersistentVolume).
More Info
- https://github.com/helm/charts/tree/master/stable/nfs-client-provisioner
- https://www.kubeflow.org/docs/use-cases/kubeflow-on-multinode-cluster/
# replace with NFS Server IP Address
export NFS_IP=192.168.X.X
export NFS_PATH=/mnt/RAID

helm install \
  --set nfs.server=$NFS_IP \
  --set nfs.path=$NFS_PATH \
  --set storageClass.name=nfs \
  --set storageClass.defaultClass=true \
  nfs-client-provisioner stable/nfs-client-provisioner
Sanity Check
kubectl get storageclassPart 1: Install Moodle
Moodle is a LMS (learning management system). We are using Moodle as the authentication service because Moodle is a mature platform that provides bulk user management features suitable for educational institutions. We will be deploying Moodle on Kubernetes with a Helm chart with default settings.
For more information on the helm chart, see helm/charts/tree/master/stable/moodle.
export MOODLE_ADMIN=admin
export MOODLE_PASSWORD=password
helm install \
  --set moodleSkipInstall=yes,global.storageClass=nfs,persistence.storageClass=nfs,moodleUsername=$MOODLE_ADMIN,moodlePassword=$MOODLE_PASSWORD,resources.requests.cpu=1,resources.requests.memory=1Gi,mariadb.requests.resources.cpu=1,mariadb.requests.resources.memory=1Gi \
  moodle bitnami/moodle
After a while, Moodle will start up. Run kubectl get pods to check.
Part 2: Install OAuth Plugin
Install the Moodle OAuth plugin:
- Download: https://github.com/projectestac/moodle-local_oauth/archive/master.zip
- Install by uploading the zip file at
Site administration > Plugins > Install plugins - Head over to
Site administration > Server > OAuth provider settings > Add new client - Set callback URL to
http://proxy-ip/hub/oauth_callback
Reference: zero-to-jupyterhub
Create a config file jh-config.yaml. Below is a template you can follow:
hub:
  extraEnv:
    OAUTH2_AUTHORIZE_URL: http://proxy-ip:5050/local/oauth/login.php?client_id=jupyterhub&response_type=code
  extraConfig:
        announcementConfig: |
          c.JupyterHub.template_vars = {"announcement": "New here? <a href='#'>Get help here</a>"}
proxy:
  secretToken: # generate this with `openssl rand -hex 32`
auth:
  type: custom
  custom:
    className: oauthenticator.generic.GenericOAuthenticator
    config:
      login_service: "SUTD ID"
      client_id: "jupyterhub"
      client_secret: "secret-key"
      oauth_callback_url: "http://proxy-ip/hub/oauth_callback"
      token_url: "http://proxy-ip:5050/local/oauth/token.php"
      userdata_url: "http://proxy-ip:5050/local/oauth/user_info.php"
      userdata_method: "GET"
      extra_params: {"scope":"user_info","client_id":"jupyterhub","client_secret":"secret-key"}
  admin:
    users:
      - gpuadmin
    access: true
singleuser:
  profileList:
    - display_name: "sutd.gpu.1xlarge"
      description: "1 GPU, 4 cores and 16GB RAM. The <code>nvaitc/ai-lab</code> image provides TensorFlow, PyTorch and various data science packages, VS Code and a virtual desktop."
      kubespawner_override:
        image: nvaitc/ai-lab:20.01-vnc
        extra_resource_limits:
          nvidia.com/gpu: "1"
      default: true
    - display_name: "sutd.cpu.1xlarge"
      description: "4 cores and 16GB RAM. The <code>jupyter/datascience-notebook</code> image provides various Python data science packages."
      kubespawner_override:
        image: jupyter/datascience-notebook:latest
  storage:
    extraVolumes:
      - name: shm-volume
        emptyDir:
          medium: Memory
    extraVolumeMounts:
      - name: shm-volume
        mountPath: /dev/shm
  extraEnv:
    JUPYTER_ENABLE_LAB: "yes"
  memory:
    limit: 16G
    guarantee: 8G
  cpu:
    limit: 6
    guarantee: 2
  networkPolicy:
    enabled: true
    egress:
      - ports:
          - port: 53
            protocol: UDP
      - ports:
          - port: 80
            protocol: TCP
      - ports:
          - port: 443
            protocol: TCP
cull:
  enabled: true
  timeout: 7200
  every: 360
You'll need Helm (already configured in the previous step). Check for the latest release of the JupyterHub helm chart (version of Helm chart is not version of JupyterHub!) at this link. Replace the env variable RELEASE with the version of the Helm chart that you desire.
helm repo add jupyterhub https://jupyterhub.github.io/helm-chart/
helm repo update

export RELEASE=0.9.0-beta.3

helm upgrade --install jhub jupyterhub/jupyterhub \
  --version=$RELEASE \
  --values jh-config.yaml
After the Helm chart is applied, you will see some output.
Use kubectl get pods to check and see if all the pods are running:
NAME                                                    READY   STATUS    RESTARTS   AGE
hub-7c57d4c987-tpzd7                                    1/1     Running   0          39s
moodle-85db564ccb-6mwrb                                 2/2     Running   0          4m44s
moodle-mariadb-0                                        1/1     Running   0          4m43s
proxy-5f7c857cd9-djrrx                                  1/1     Running   0          39s
wistful-jackal-nfs-client-provisioner-8c6b99c9f-24cdr   1/1     Running   0          5m46s
We will expose the relevant services via NodePort services since LoadBalancer services are geared towards managed cloud services.
Check the services running with kubectl get services:
NAME             TYPE           CLUSTER-IP       EXTERNAL-IP   PORT(S)                      AGE
hub              ClusterIP      10.104.13.35     <none>        8081/TCP                     90s
kubernetes       ClusterIP      10.96.0.1        <none>        443/TCP                      20m
moodle           LoadBalancer   10.109.72.235    <pending>     80:31614/TCP,443:30718/TCP   5m35s
moodle-mariadb   ClusterIP      10.105.174.183   <none>        3306/TCP                     5m35s
proxy-api        ClusterIP      10.102.6.196     <none>        8001/TCP                     90s
proxy-public     LoadBalancer   10.110.167.173   <pending>     80:31895/TCP,443:30922/TCP   90s
Expose moodle and proxy-public.
kubectl expose service/moodle --type=NodePort --name=moodle-service
kubectl expose service/proxy-public --type=NodePort --name=jh-service
Run kubectl get services | grep NodePort again to see which are the exposed NodePorts:
jh-service       NodePort       10.106.50.222    <none>        80:31626/TCP,443:30301/TCP   38s
moodle-service   NodePort       10.107.36.166    <none>        80:30670/TCP,443:32038/TCP   41s
In this case, JupyterHub is exposed at port 31626 and Moodle at port 30670.
Now, let's set up the Nginx proxy.
sudo apt install nginx -yModify Nginx config
sudo nano /etc/nginx/sites-enabled/defaultModify the file to look like this. In particular, modify the proxy_pass fields accordingly.
server {
        listen 80 default_server;
        listen [::]:80 default_server;

        server_name _;

        location / {
                proxy_pass http://localhost:31895;
                proxy_set_header X-Real-IP $remote_addr;
                proxy_set_header Host $http_host;
                proxy_http_version 1.1;
                proxy_set_header Upgrade $http_upgrade;
                proxy_set_header Connection "upgrade";
        }
}

server {
        listen 5050 default_server;
        listen [::]:5050 default_server;

        server_name moodle;

        location / {
                proxy_pass http://localhost:30670;
                proxy_set_header X-Real-IP $remote_addr;
                proxy_set_header Host $http_host;
                proxy_http_version 1.1;
                proxy_set_header Upgrade $http_upgrade;
                proxy_set_header Connection "upgrade";
        }
}
This Nginx configuration will create the following proxy:
proxy-ip:80-> JupyterHubproxy-ip:5050-> Moodle
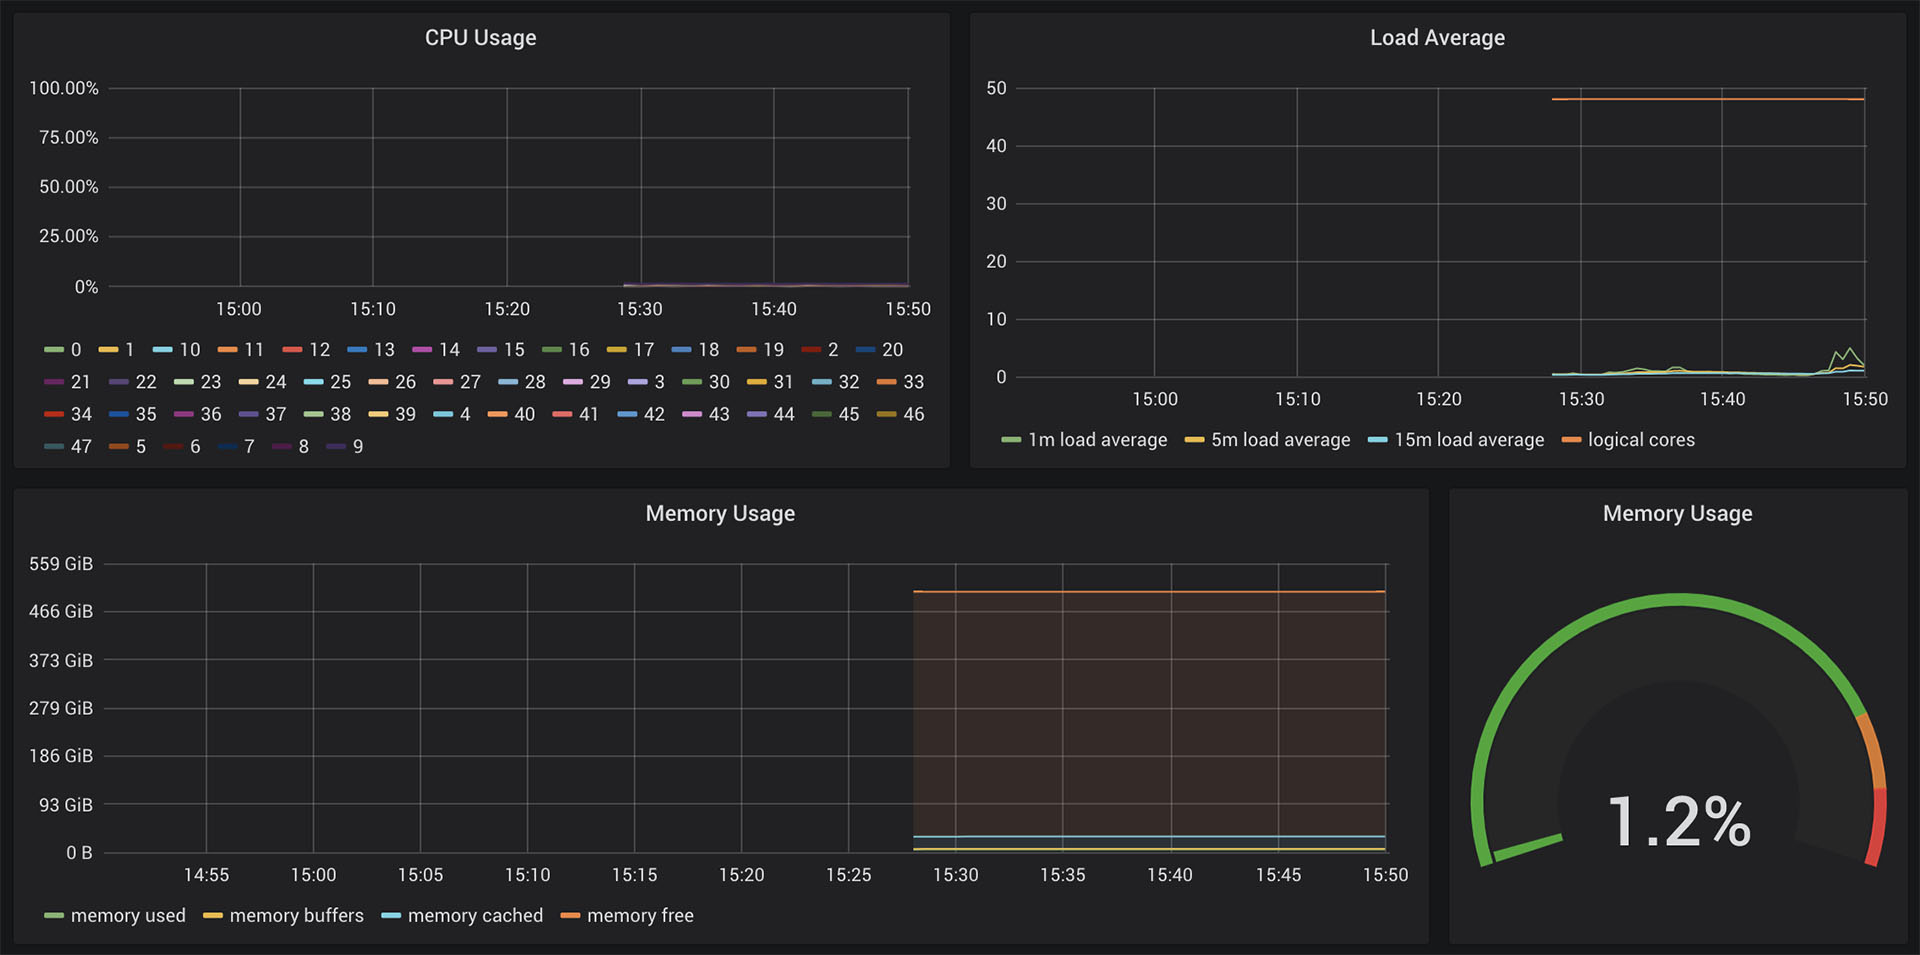
We will deploy Prometheus and Grafana to set up our monitoring system and dashboard. The helm chart we are deploying is stable/prometheus-operator, which will contain all the components we need.
helm install promop stable/prometheus-operatorAfter the deploy has completed, we can check to see if the Grafana pod is running.
$ kubectl get pods | grep grafana
# you should see something like the following
promop-grafana-5d8b84b688-9hrjr                          2/2     Running   0          16m
Now, we need to expose the Grafana pod so we can use the web interface.
$ kubectl expose pod/promop-grafana-5d8b84b688-9hrjr --type=NodePort --name=grafana-service
service/grafana-service exposed
You should now be able to see grafana-service. We need to use the NodePort attached to port 3000. In the example below, it is 30154.
$ kubectl get services | grep grafana
grafana-service                           NodePort       10.96.148.224   <none>        80:32181/TCP,3000:30154/TCP   19m
promop-grafana                            ClusterIP      10.96.66.60     <none>        80/TCP                        20m
When you browse to localhost:30154, you will see the Grafana web UI. You can log in with the credentials admin / prom-operator and see the preconfigured dashboards.
To remove the monitoring system and start over, run helm delete promop and additionally delete the service that you created.
- Configure Moodle users
