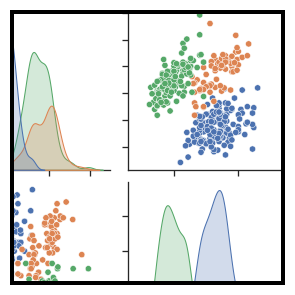
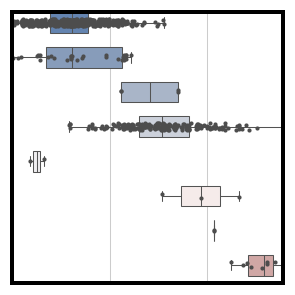
Seaborn is a Python visualization library based on matplotlib. It provides a high-level interface for drawing attractive statistical graphics.
Online documentation is available at seaborn.pydata.org.
The docs include a tutorial, example gallery, API reference, and other useful information.
Seaborn supports Python 2.7 and 3.4+.
Installation requires numpy, scipy, pandas, and matplotlib. Some functions will optionally use statsmodels if it is installed.
The latest stable release (and older versions) can be installed from PyPI:
pip install seaborn
You may instead want to use the development version from Github:
pip install git+https://github.com/mwaskom/seaborn.git#egg=seaborn
To test seaborn, run make test in the source directory.
This will exercise both the unit tests and docstring examples (using pytest).
Seaborn development takes place on Github: https://github.com/mwaskom/seaborn
Please submit any reproducible bugs you encounter to the issue tracker.
