
Motivation
You may have seen a sign like the one pictured above while on the highway in Illinois, displaying how many deaths there have been on the road. The sign above says there had been 957 traffic deaths in 2012. That number is scary, but what does it really mean? Where did they happen and under what conditions? Besides avoiding texting while driving, what else should I be watching out for?
As a non-driver myself, and feeling pressure from family to get my driver's license, I feel all the more sensitive to statistics like this. I don't drive precisely because of the risk of accidents. If we were all driving bouncy bubble cars, I would have gotten my license many years ago. I'm still considering getting my license anyway and I'd feel a lot better if I could pinpoint where the really awful accidents happened.
Where's The Data?
Download ZIP archives of each of the years, from 1975 to 2012, from my Google Drive.
Re-host it somewhere better and tell me about it so I can update this documentation.
Where'd The Data Come From?
The National Highway Traffic Safety Administration operates something they call the Fatality Analysis Reporting System, which provides extensive data on all accidents that result in deaths on the roadway. They don't report trauma and death in the hospitals, because at that point it's health information and private.
NHTSA FARS FTP DBF WUT (Getting The Data)
FARS has data for the years 1975 to 2012 (inclusive). To get data for 2012:
./get_data_for_year_XXXX.sh 2012
This will create a 2012 folder, download a ZIP file from FARS to it, and unzip the DBF files there.
DBF -> CSV with Python
DBF is the dBASE file format, and it's as ancient as Time itself. There are several Python modules that read it, but I used dbfpy because it had the best documentation.
Let's say you downloaded data for 2012. Here's how you convert the accident list into a CSV file you can open with, well, almost anything:
python dbf_to_csv.py ./2012/accident.dbf ./2012/accident.csv
Trim The Data
Umm, that CSV file is 4.7 megabytes and thirty-three thousand rows. That's a bit unwieldly if we want to visualize it on the web. Let's cut it down so we have just
- The date and time of the accident. Fields: MONTH, DAY, HOUR, MINUTE
- The number of fatalities reported. Field: FATALS
- The geographic location. Fields: LATITUDE, LONGITUD
To trim accident.csv from the previous step into something a little more manageable:
python simplify_csv.py ./2012/accident.csv ./2012/accident_simplified.csv
The new file is still thirty three thousand rows but it's about 25% its former size at 1.2 megabytes.
Do Something With It
Try uploading to CartoDB or Google Fusion Tables to map this data and explore.
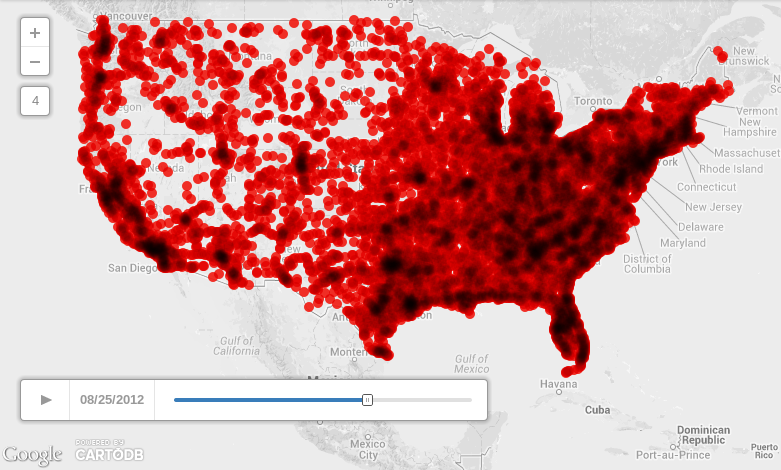
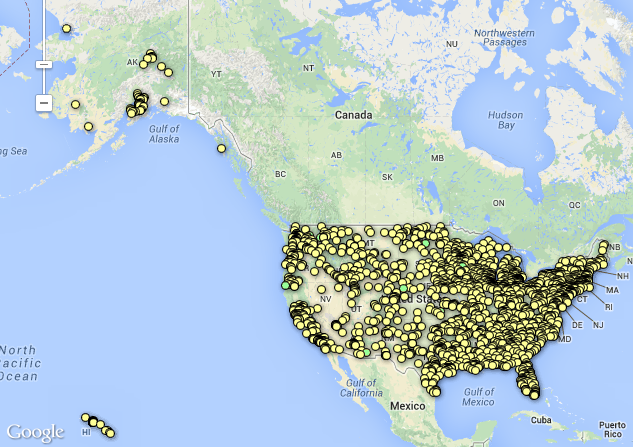
Check out what the 2012 data looks like below.
CartoDB Visualize
Google Fusion Tables
People, Not Data
We should not let the numbers go to our heads. After all is said and done, there were still at least 33000 violent and assuredly unexpected deaths of people in 2012. That's like the population of a township just dying tragically in one year. It's mind-boggling. I struggle to comprehend or describe that kind of loss.
Please read Jake Solomon's essay People, Not Data.
Setup on PythonAnywhere
You can create a free account on PythonAnywhere and get access to a bash console and an IPython shell in just a few minutes. It's a great way to experiment with Python and git without investing time and energy into creating a development environment.
If you're just creating an account now, choose the option to clone and work on a Github repo. Otherwise, go to your Dashboard and open a bash console. In the console, clone this repository:
git clone https://github.com/tothebeat/fatal-car-crashes.git
If you have trouble copy and pasting into your console, read their guide on that.
Change directory into the new clone and run the setup script to create a Python virtualenv and install the requirements:
cd fatal-car-crashes
./setup.sh
The accident.dbf file for 2012 is included in the repository. If you'd like to see how to convert that to CSV, or see how that conversion works, take a look at this from dbf_to_csv.py:
def dbf_to_csv(dbf_path, csv_path):
    with open(dbf_path, 'rb') as dbf_file:
        database = dbf.Dbf(dbf_file, readOnly=True)
        with open(csv_path, 'wb') as csv_file:
            dict_writer = csv.DictWriter(csv_file, fieldnames=sorted(database[0].asDict().keys()))
            dict_writer.writeheader()
            for record_number, record in enumerate(database):
                dict_writer.writerow(record.asDict())
            print 'Converted {n} rows of DBF file {f}'.format(n=record_number, f=dbf_path)
Talk to me
I talked about this project at the Chicago Python Users Group meeting on January 9:

I also regularly attend the Open Gov Hack Night in Chicago, which is held at 6pm every Tuesday at 1871 in the Merchandise Mart. Please come say hello to me, I'd love to know what you're working on and what challenges you're facing.