A Node-RED node to provide charts for plotting things on. Implemented by Chart.js

This nodes package permit to use Chart.js charts from Node-RED. The objective is create a new url path for each chart created, this url path could be configured and updated at runtime.
For the latest updates see the CHANGELOG.md
npm install node-red-contrib-chartjs --save
- Line Chart

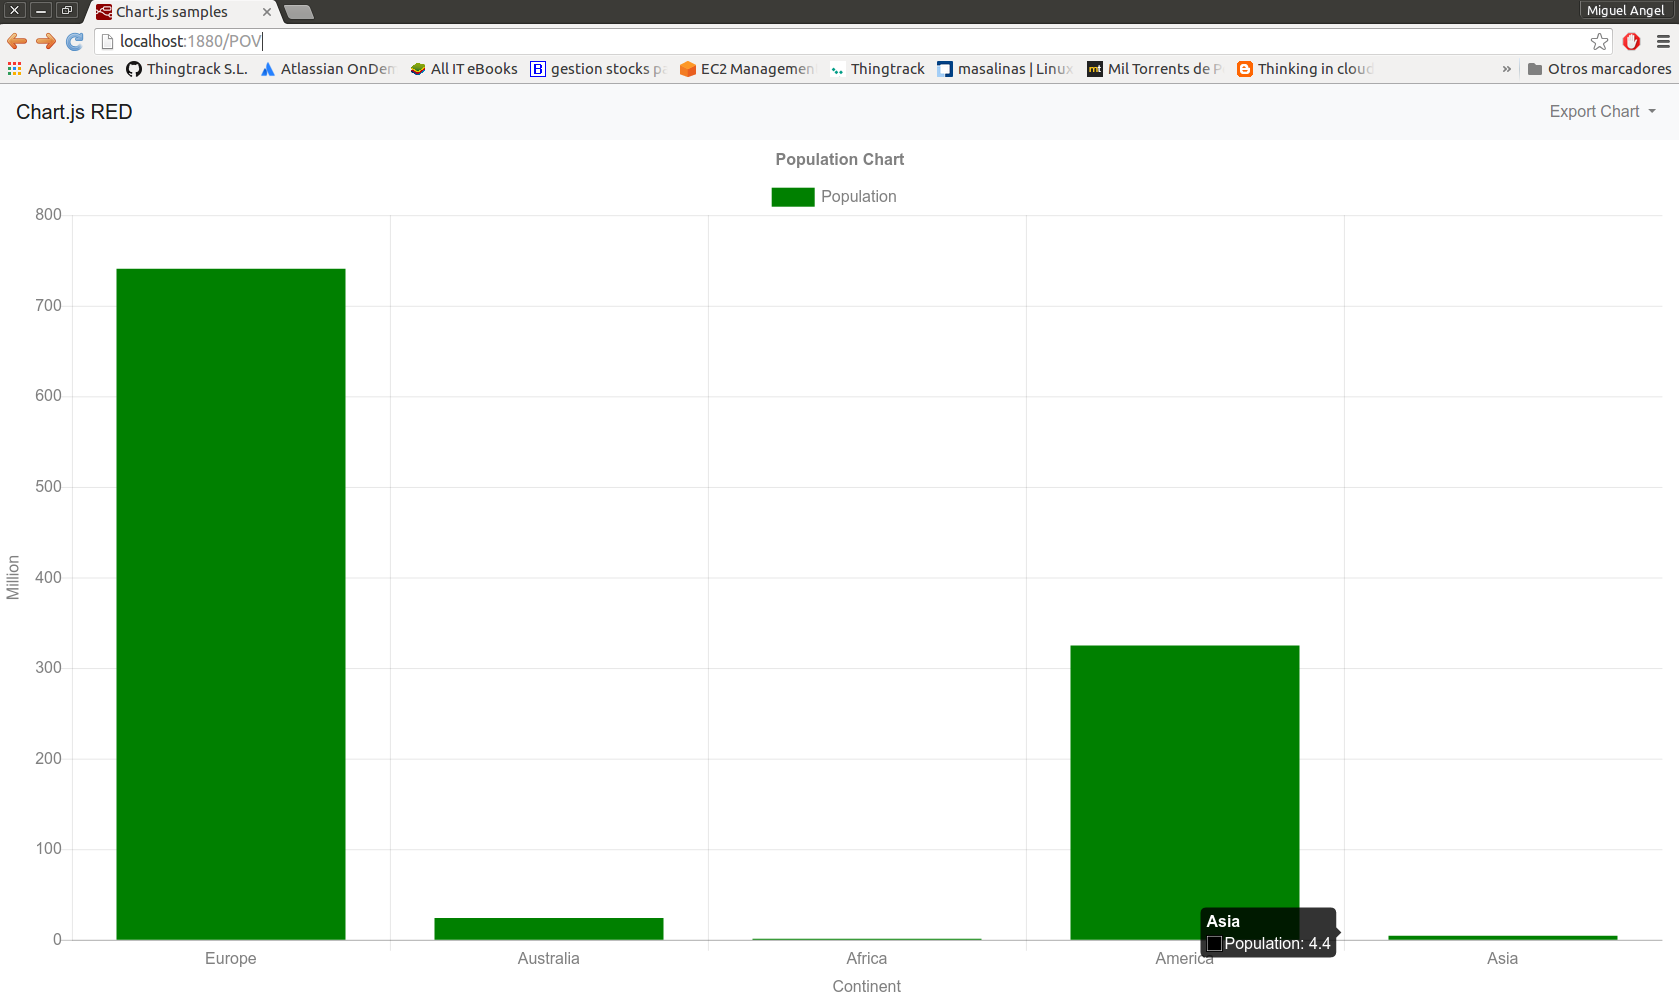
- Vertical Bar Chart
- Horizontal Bar Chart

- Pie Chart

- Doughnut Chart

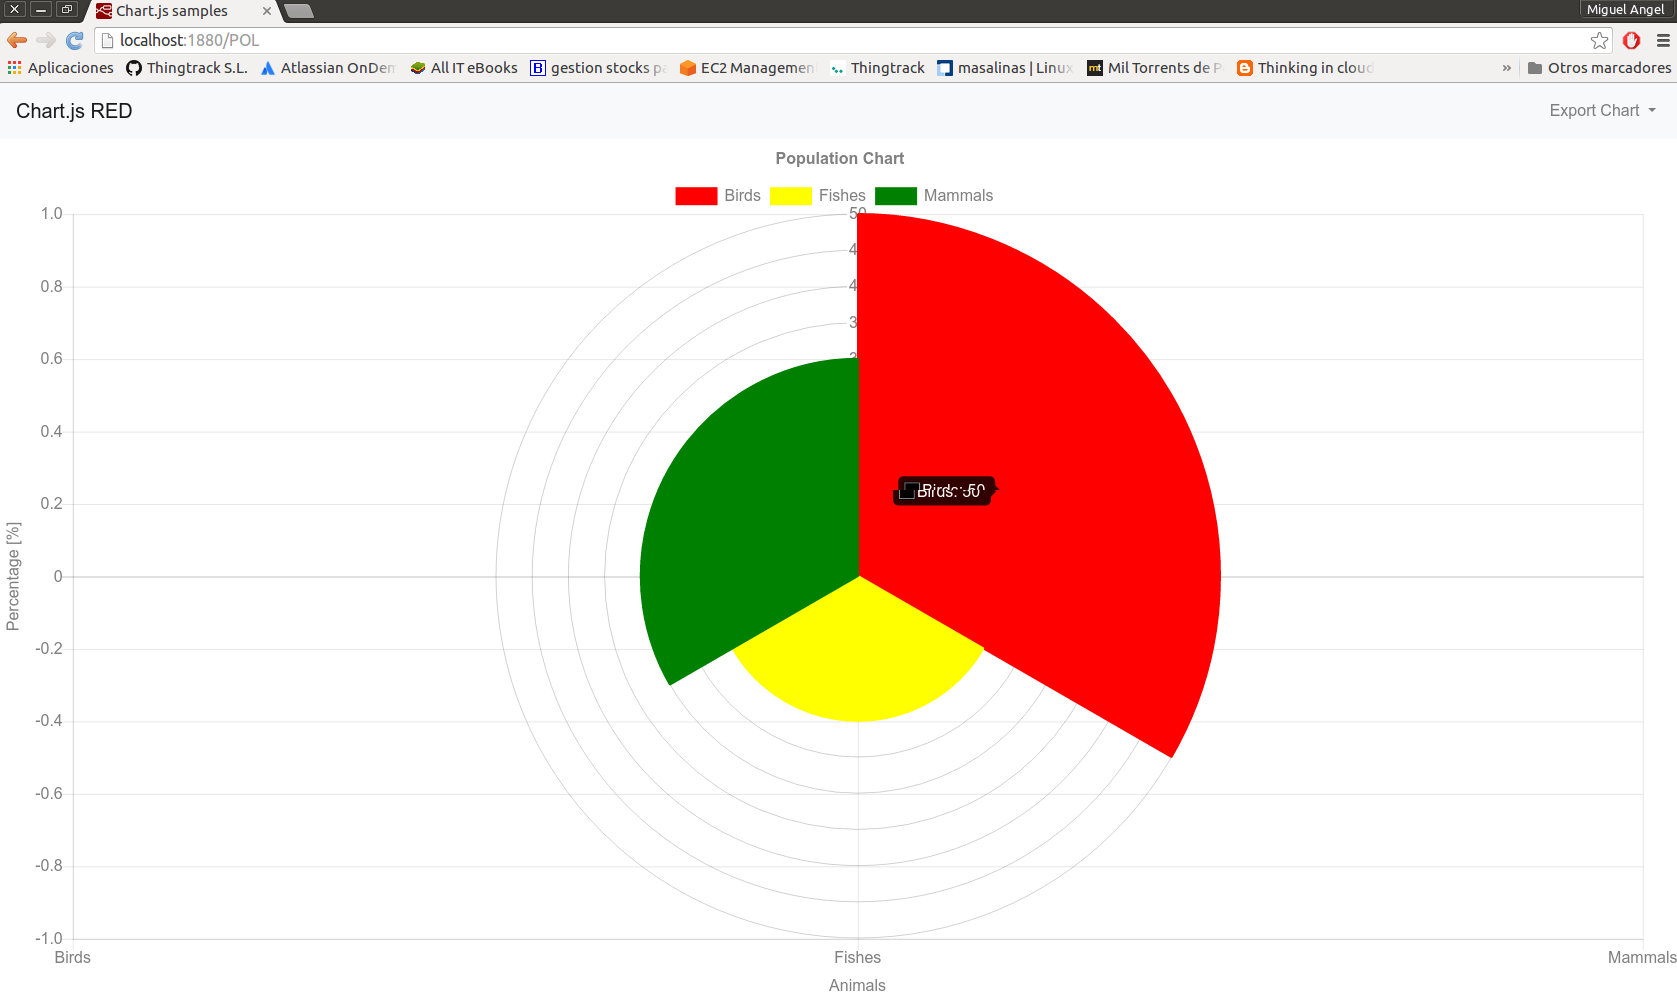
- Polar Area Chart
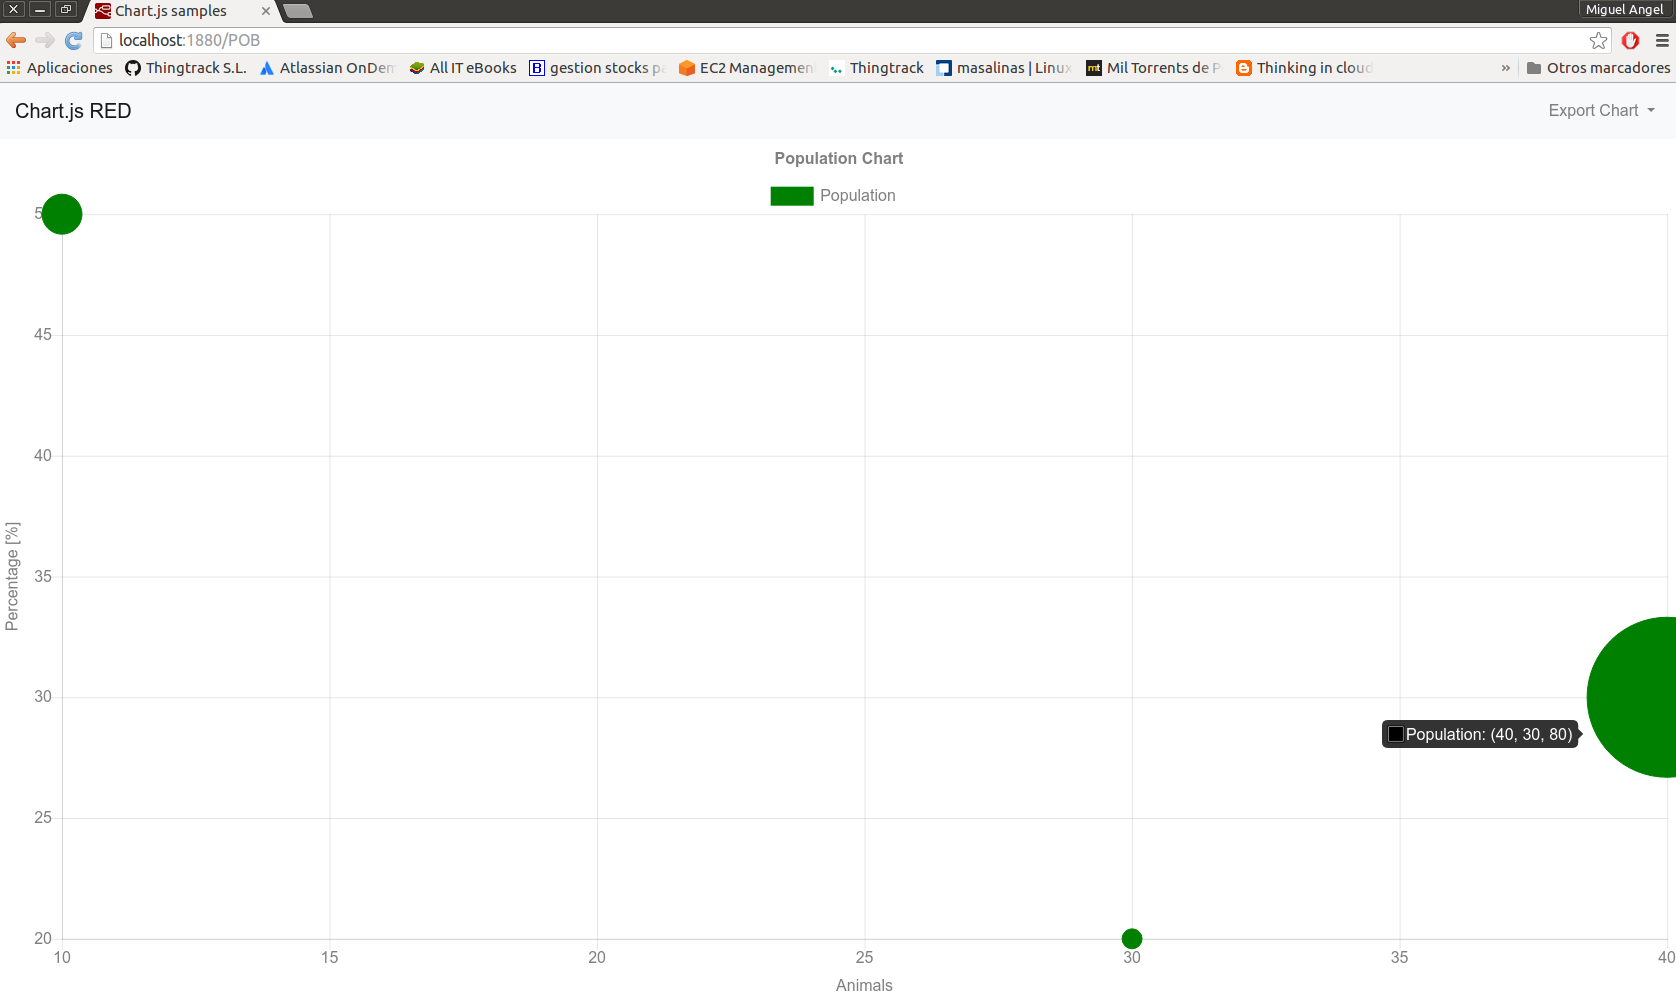
- Bubble Chart
- Radar Chart

The Chart attributes are:
- Path: The Chart Url to be access. An example where path is TP01 could be:
http://localhost:1880/TP01
- Tittle: The chart title
- X Axis: The X axis label
- Y Axis: The Y axis label
- Payload: The chart dataset object
The chart payload attributes are:
- channel: The channel legend
- color: The chart color line
- dataset: The chart dataset
The payload dataset attributes are:
- x: x axis dataset value
- y: y axis dataset value
Read node help to check the dataset structure for each chart. A Line Chart dataset could be like this:
{
    "channel": "Population",
    "color": "Green",
    "dataset": [
        {
            "x": "Europe",
            "y": 741
        },
        {
            "x": "Australia",
            "y": 24
        },
        {
            "x": "Africa",
            "y": 1.2
        },
        {
            "x": "America",
            "y": 325
        },
        {
            "x": "Asia",
            "y": 4.4
        }
    ]
}
- socker.io: socket.io server side
- serve-static: Serve static files
- cors: Node.js CORS middleware
- socker.io-client: Socket.io client side
- jquery: Multipurpose javascript library
- bootstrap4: Build responsive, mobile-first projects on the web
- popper.js: A kickass library used to manage poppers in the web applications
- Chart.js: Simple yet flexible JavaScript charting for designers & developers
- jsPDF: The leading HTML5 client solution for generating PDFs
Under example folder you have a json flow to be imported in your node-red instance to test the nodes.