- A Global Good Project
- Soil Data Research
- START: Connecting to the OSSL
- Exporting the OSSL as CSV
- WIP --> Building a Data Pipeline
- END
A Global Good Project
Introduction

Created with DALL·E
The purpose of this series of articles is to explore a path from data collection to data visualization and machine learning.
My background is in operations, analysis, and mathematics. Particular interest to me is the environment and the field of soil science concerning the health of the soil system.
Coincidentally, Hackers News led me to an article about the open soil spectral database.
The Open Soil Spectral Library (OSSL)
The Open Soil Spectral Library (OSSL) is a global good project which serves collections of soil properties derived from spectral data. OSSL is also a network that delivers robust statistical models, calibration and prediction models, research tools, and opportunities to collaborate across borders.
The initiative received a funding award through the National Institute of Food and Agriculture (USDA). NIFA has invested over $7 Million in Big Data, Artificial Intelligence, and Other Cyberinformatics Research.
Among other valuable resources, the OSSL project offers beautifully developed software:
OSSL Explorer
And the user manual, which is open for contributions:
OSSL manual

Soil Data Research
Spectroscopy
The importance of spectroscopy is centered around the fact that every element in the periodic table has a unique light spectrum.
Soil spectroscopy is the measurement of light absorption when a light in the visible, near-infrared or mid-infrared (Vis–NIR-MIR) regions of the electromagnetic spectrum is applied to a soil surface.

The reflected infrared radiation is converted to electrical energy and fed to a computer for interpretation. Each major organic component of the soil absorbs and reflects light differently. By measuring these different reflectance characteristics, the Spectroradiometer and a computer determine the ingredients in the soil sample.
A typical soil spectrum in the (A) visible, (B) near-infrared, and (C) mid-infrared portion of the Electromagnetic Spectrum:
 Image Source: Advances in Agronomy
Light absorption in the VIS region is due to the excitation of electrons. For longer wavelengths, NIR-MIR, the absorption is due to vibrations in the chemical bonds within molecules: symmetrical stretch, asymmetrical stretch, and bending vibrations.
The spectra will show overtones and combinations of these vibrations, mainly in the NIR region.
Water has unique soil spectral features (Absorbance vs. Wavelength):

Soil
Soil is a living system working as a life-sustaining resource. It teams up with billions of bacteria, fungi, and other microbes to create an abundant soil community filled with diverse soil biota.
Soils have 4 essential components:
- Mineral particles: sand, silt, and clay
- Organic matter
- Water
- Air
Organism abundance, diversity, and activity are not randomly distributed in the soil but vary in a patchy fashion both horizontally across a landscape and vertically through the soil profile.

Most soils evolve slowly over centuries through the weathering of underlying rocks and the decomposition of organic matter. Other soils are formed from deposits laid down by rivers, seas, or wind forces.
A sample of typical topsoil contains about
- ~50% pore space filled with varying proportions of air and water, depending on the soil's current moisture content.
- ~50% of the volume is made up of mineral particles and organic matter
Organic soils formed in marshes, bogs, and swamps contain 30-100% organic matter.
Minerals
Soil minerals give soil different texture attributes and colors. Minerals are classified by size:


The most common mineral in soils is quartz; it is not very reactive. But on the other hand, clay is very reactive. Clay particles can form strongly protected structures that store soil C for long periods.
These protected structures made with clay ensure good water-holding capacity and provide a good source of plant nutrients.
Organic Matter (SOM)
Soil organic matter SOM is composed mainly of carbon, hydrogen and oxygen, and has small amounts of other elements, such as nitrogen, phosphorous, sulfur, potassium, calcium and magnesium contained in organic residues. It is divided into ‘living’ and ‘dead’ components and can range from very recent inputs, such as stubble, to largely decayed materials that might be many hundreds of years old. About 10% of below-ground SOM, such as roots, fauna and microorganisms, is ‘living’:
SOM exists as 4 distinct fractions which vary widely in size, turnover time and composition in the soil (Table 1):
- dissolved organic matter
- particulate organic matter
- stable organic matter or humus
- resistant organic matter
Structure
Soil structure refers to the proportions of solids and voids. A key aspect of soil structure is the aggregation of individual mineral and organic particles into larger units.
Aggregates are separated into size classes: macroaggregates (250 μm–2 mm) and microaggregates (53–250 μm).
Macroaggregates are formed when light fraction SOM, which is composed of fresh plant residue, is decomposed by fungi and bacteria.
Bacterial secretion of high-molecular-weight sugar-based polymers (EPSs). These EPSs and fungal hyphae serve as nucleation cores to accrete larger masses of slightly decayed SOM that become macroaggregates. These macroaggregates are constantly weathering in the soil to produce microaggregates within SOM.

 Image Source: American Society of Microbiology
Organic Carbon (SOC)
Soil Organic Carbon SOC refers to the carbon components in organic compounds. Soil organic matter (SOM) is challenging to measure directly, so laboratories tend to measure and report SOC. Soil organic carbon is a measurable component of soil organic matter which contributes to nutrient retention and turnover, soil structure, moisture retention and availability, degradation of pollutants, and carbon sequestration. SOC has been identified as a global indicator for monitoring soil health and productivity.
Visual Analysis of Soil Example

Below are four Swedish soils samples demonstrating the interaction of sand-and-clay textures versus SOM compositions
Image Source: FAO(min: 37:42)

- The Left samples are 100% sand, 0% clay.
- The Right samples are illite clay soil samples; thus, they appear brighter in color.
- The Bottom samples have no organic matter
- The Top samples have very little organic matter; thus, they appear darker.
Soil Health
The basic principles of soil health:
- Maximize Presence of Living Roots
- Maximize Soil Cover
- Maximize Biodiversity
- Minimize Disturbance

START: Connecting to the OSSL
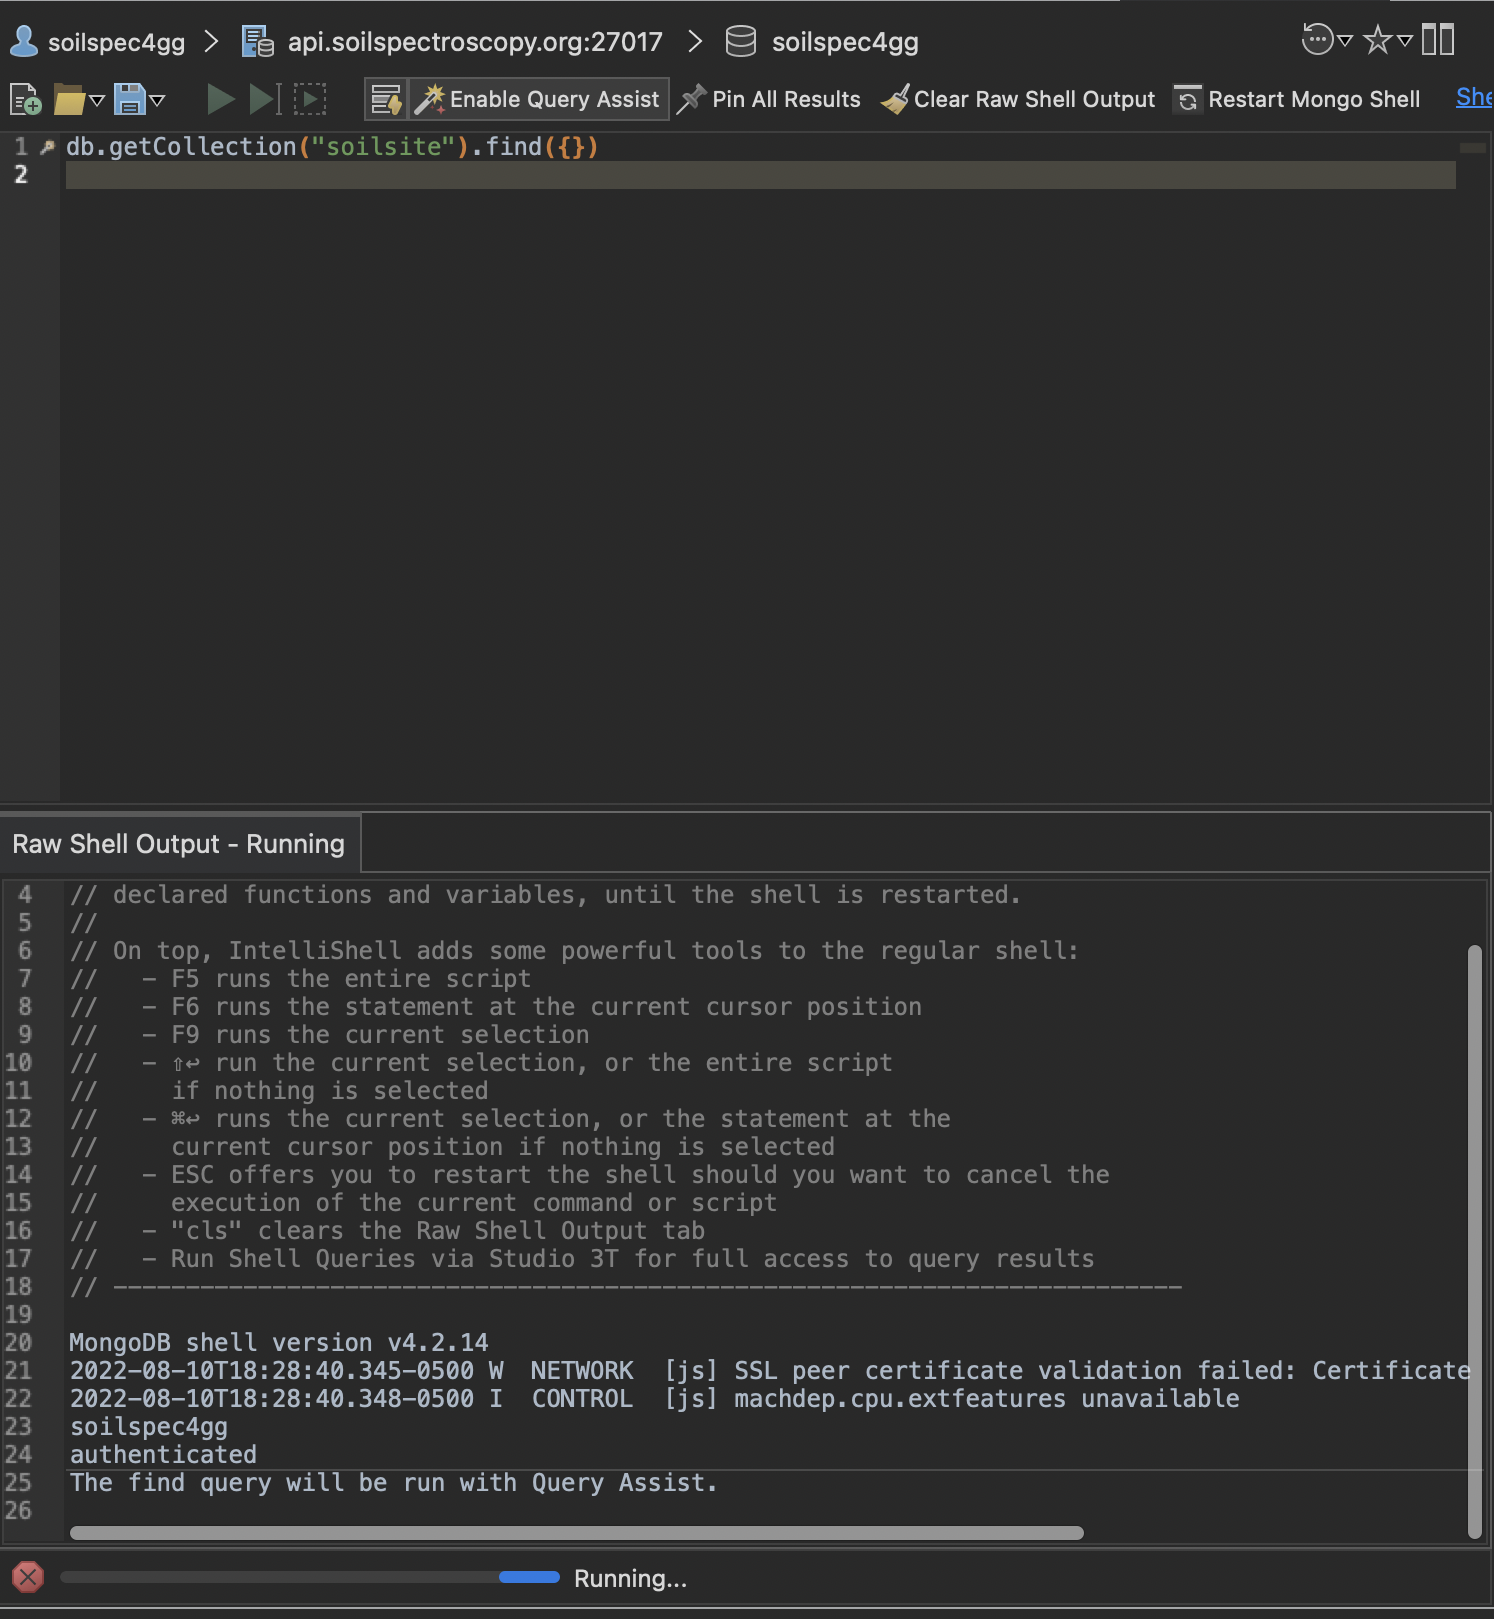
The OSSL manual mentioned two ways to access the data. The first method uses MongoDb via R; however, the last yields a certification error. See the image below:

As an alternative, we tried to connect directly with Javascript through NodeJS, but we also ran into another certificate error.
/Users/dev/code/soil_data_research/node_modules/mongodb/lib/utils.js:419
                    throw error;
                    ^

MongoServerSelectionError: certificate has expired
    at Timeout._onTimeout (/Users/dev/code/soil_data_research/node_modules/mongodb/lib/sdam/topology.js:293:38)
    at listOnTimeout (node:internal/timers:564:17)
    at process.processTimers (node:internal/timers:507:7) {
  reason: TopologyDescription {
    type: 'Unknown',
Lastly, we used the second method from the OSSL manual to access the data with Studio 3T and inserted the following parameters:
- Connection Name:
soilspec4gg - Server:
api.soilspectroscopy.org - Authentication DB:
soilspec4gg - User name:
soilspec4gg - Password:
soilspec4gg - Use SSL:
true - Accept any SSL certificates:
true
Step 1: Free download Studio 3T and complete installation.
Step 2: In Studio 3T,
-
Click on the New Collection icon:

-
select the
manually configure my connection settingoption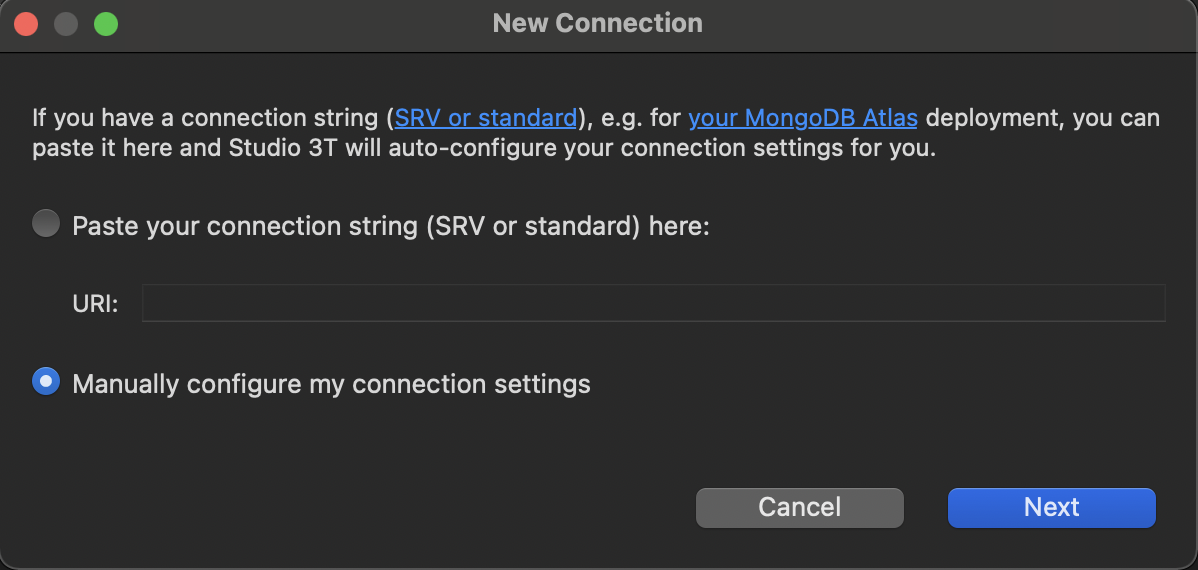
-
Fill in the Connection name:
soilspec4ggand, in theServertab, fill with OSSL's given address:api.soilspectroscopy.org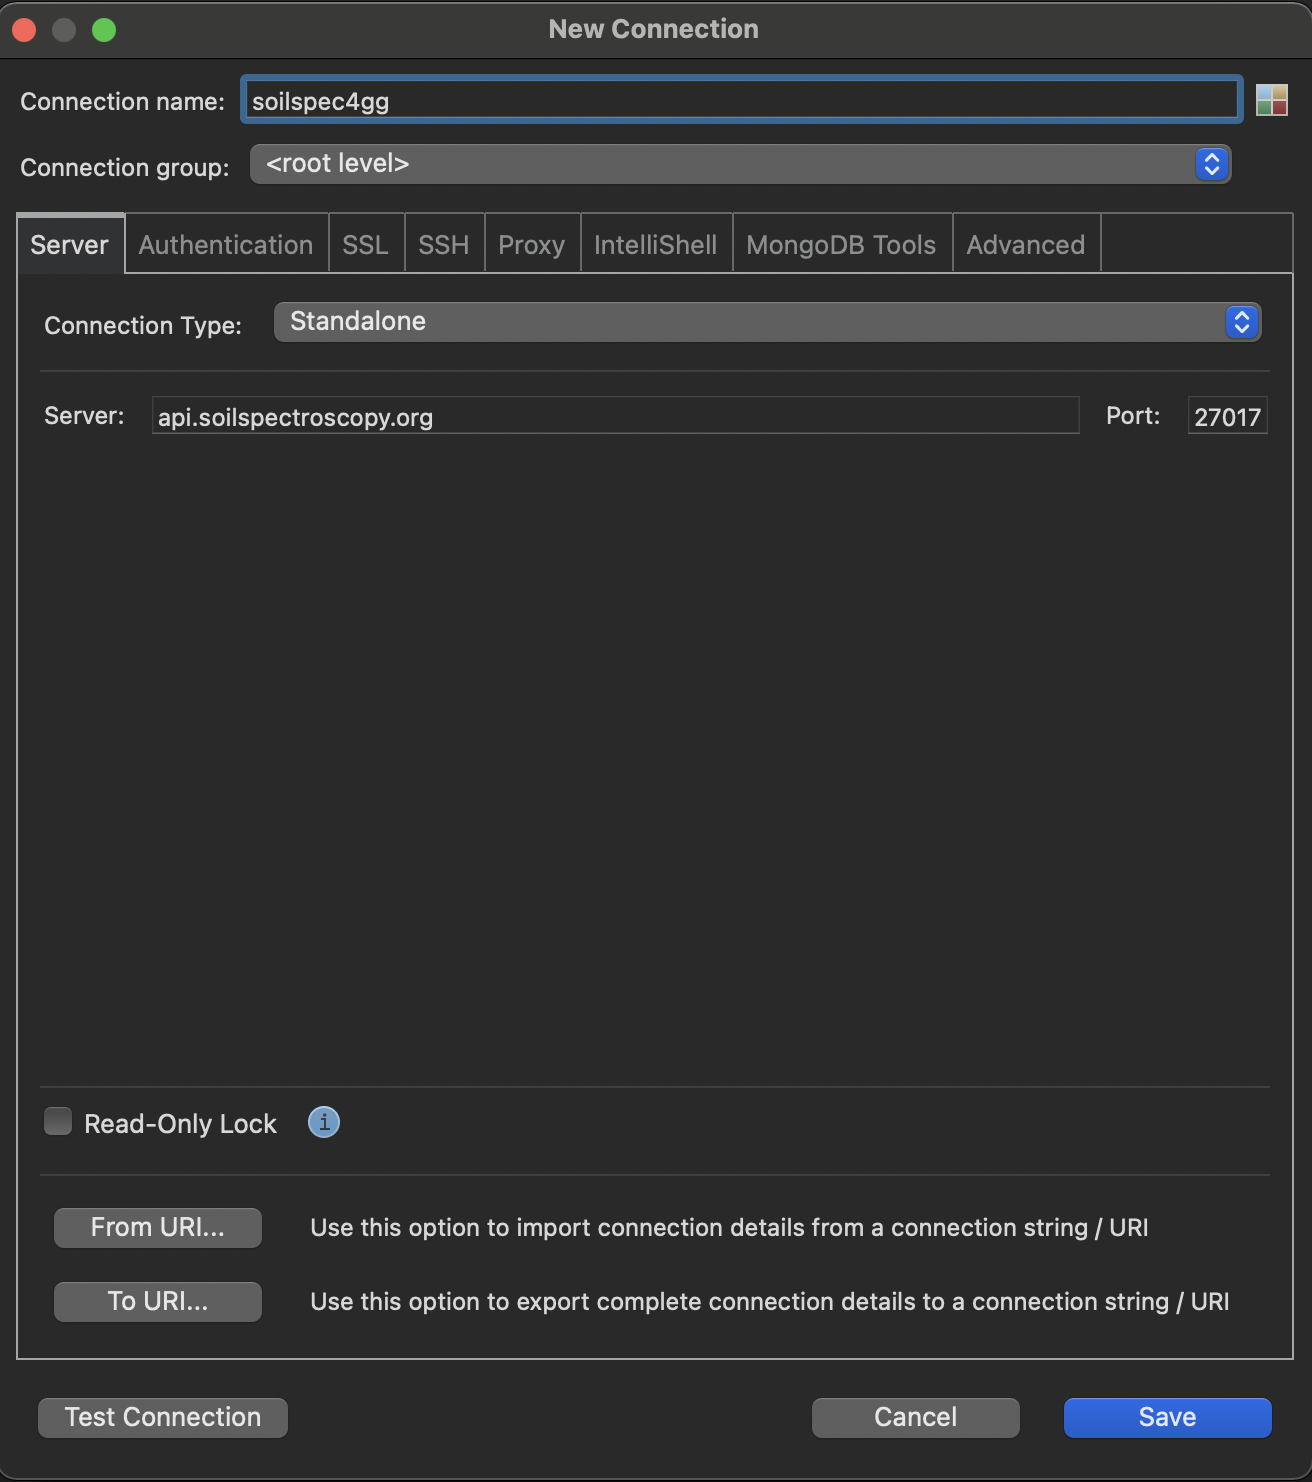
-
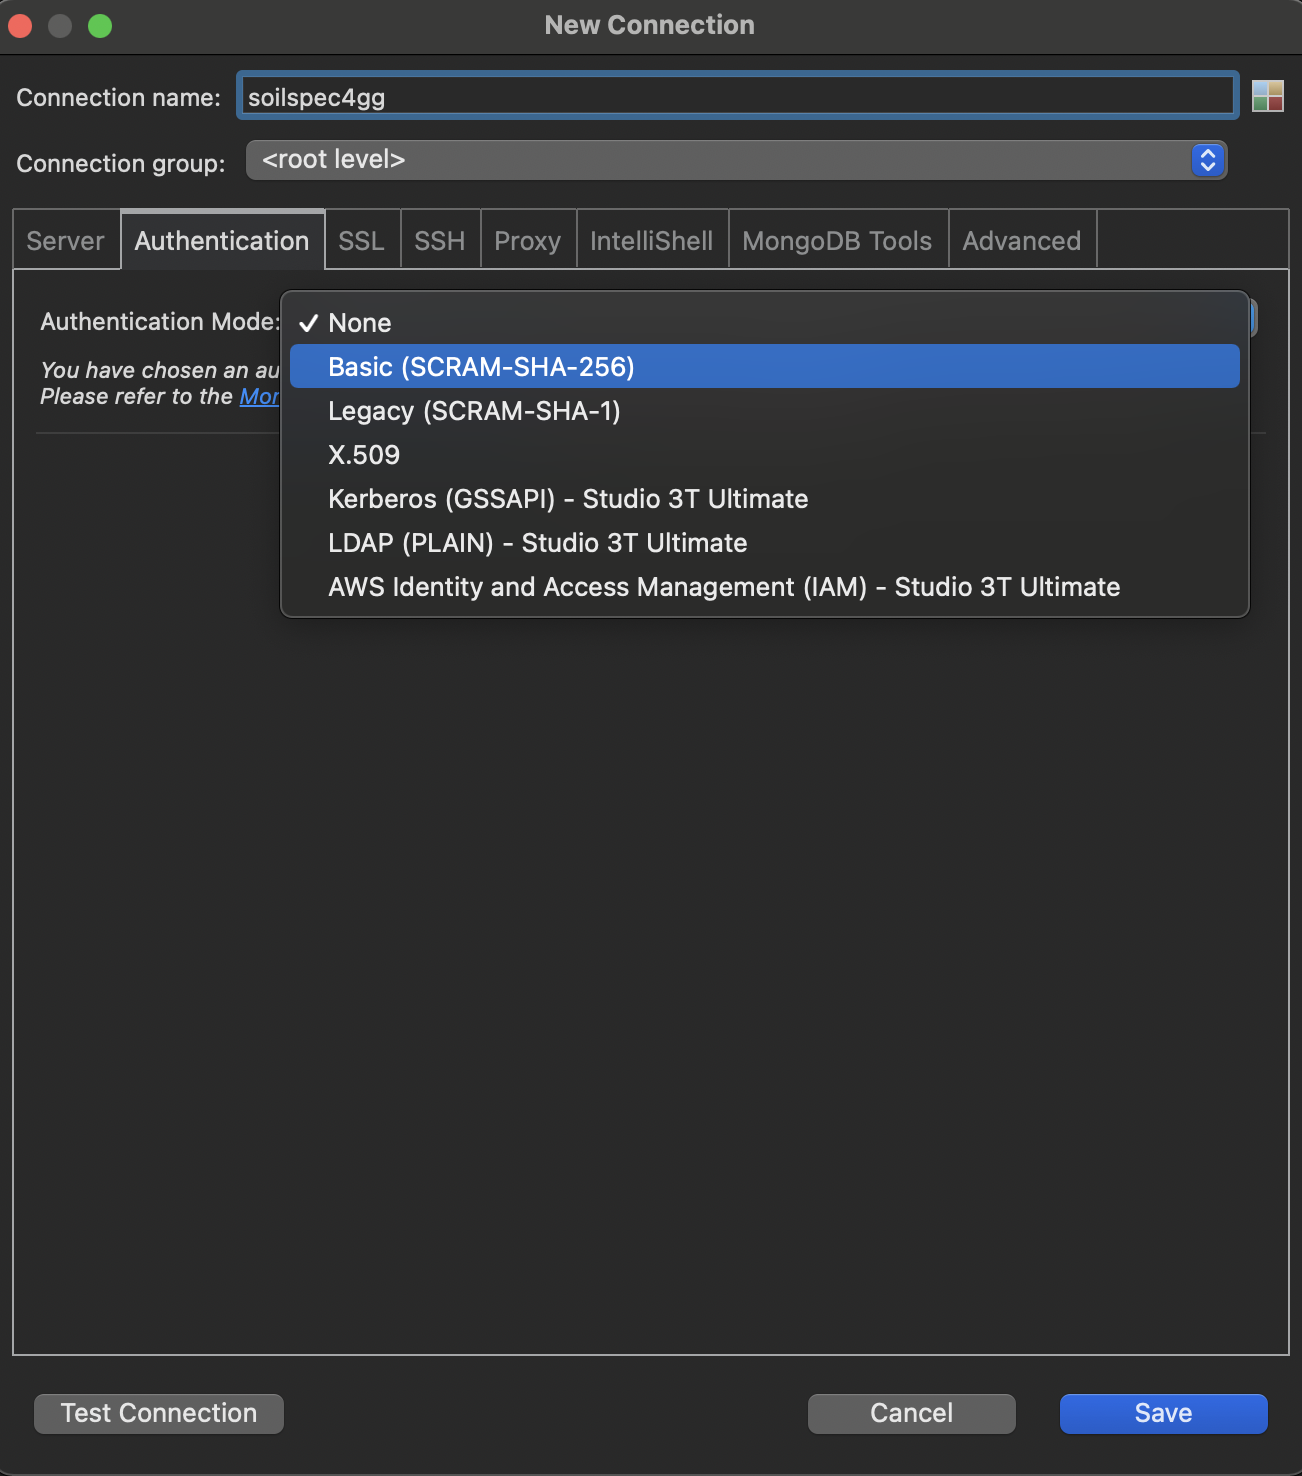
Go to the Authentication tab and select Basic Authentication Mode:
- Fill in the User name, Password, and Authentication DB with
soilspec4gg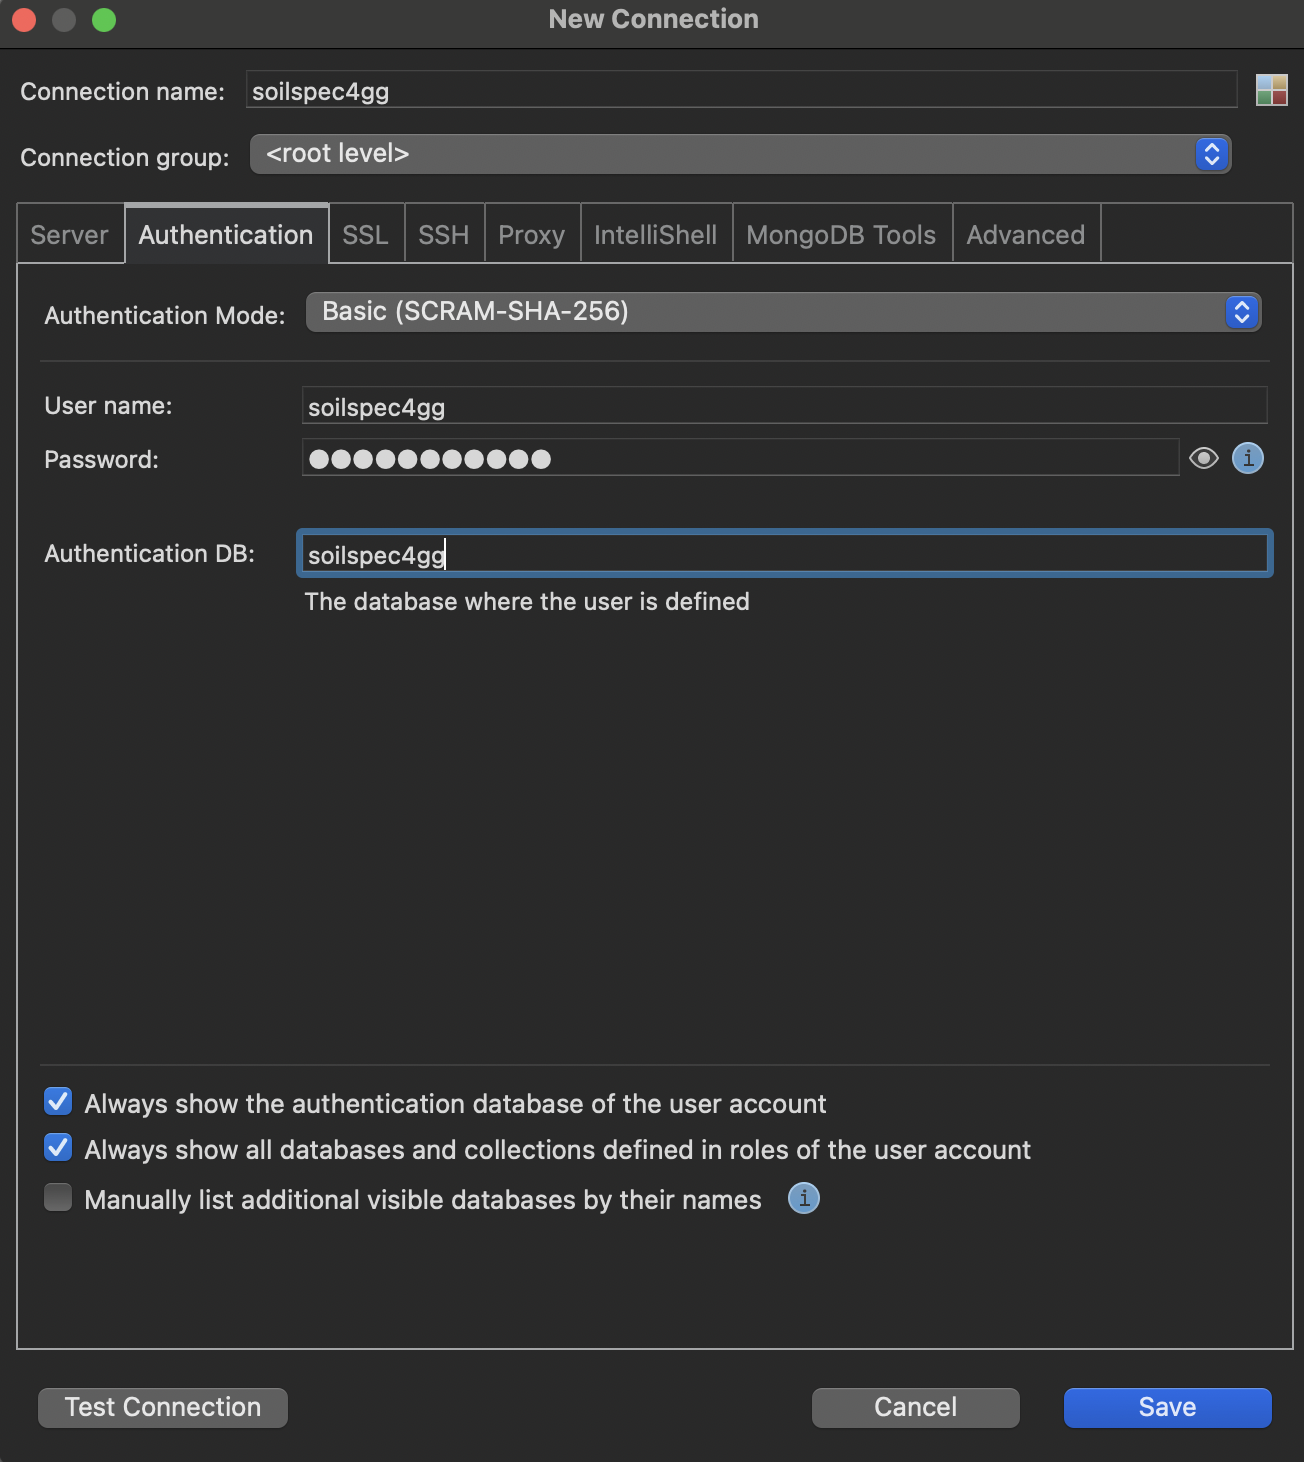
- Fill in the User name, Password, and Authentication DB with
-
- Under the SSL tab, select
Use SSL protocol to connectand `accept any server SSL certificates.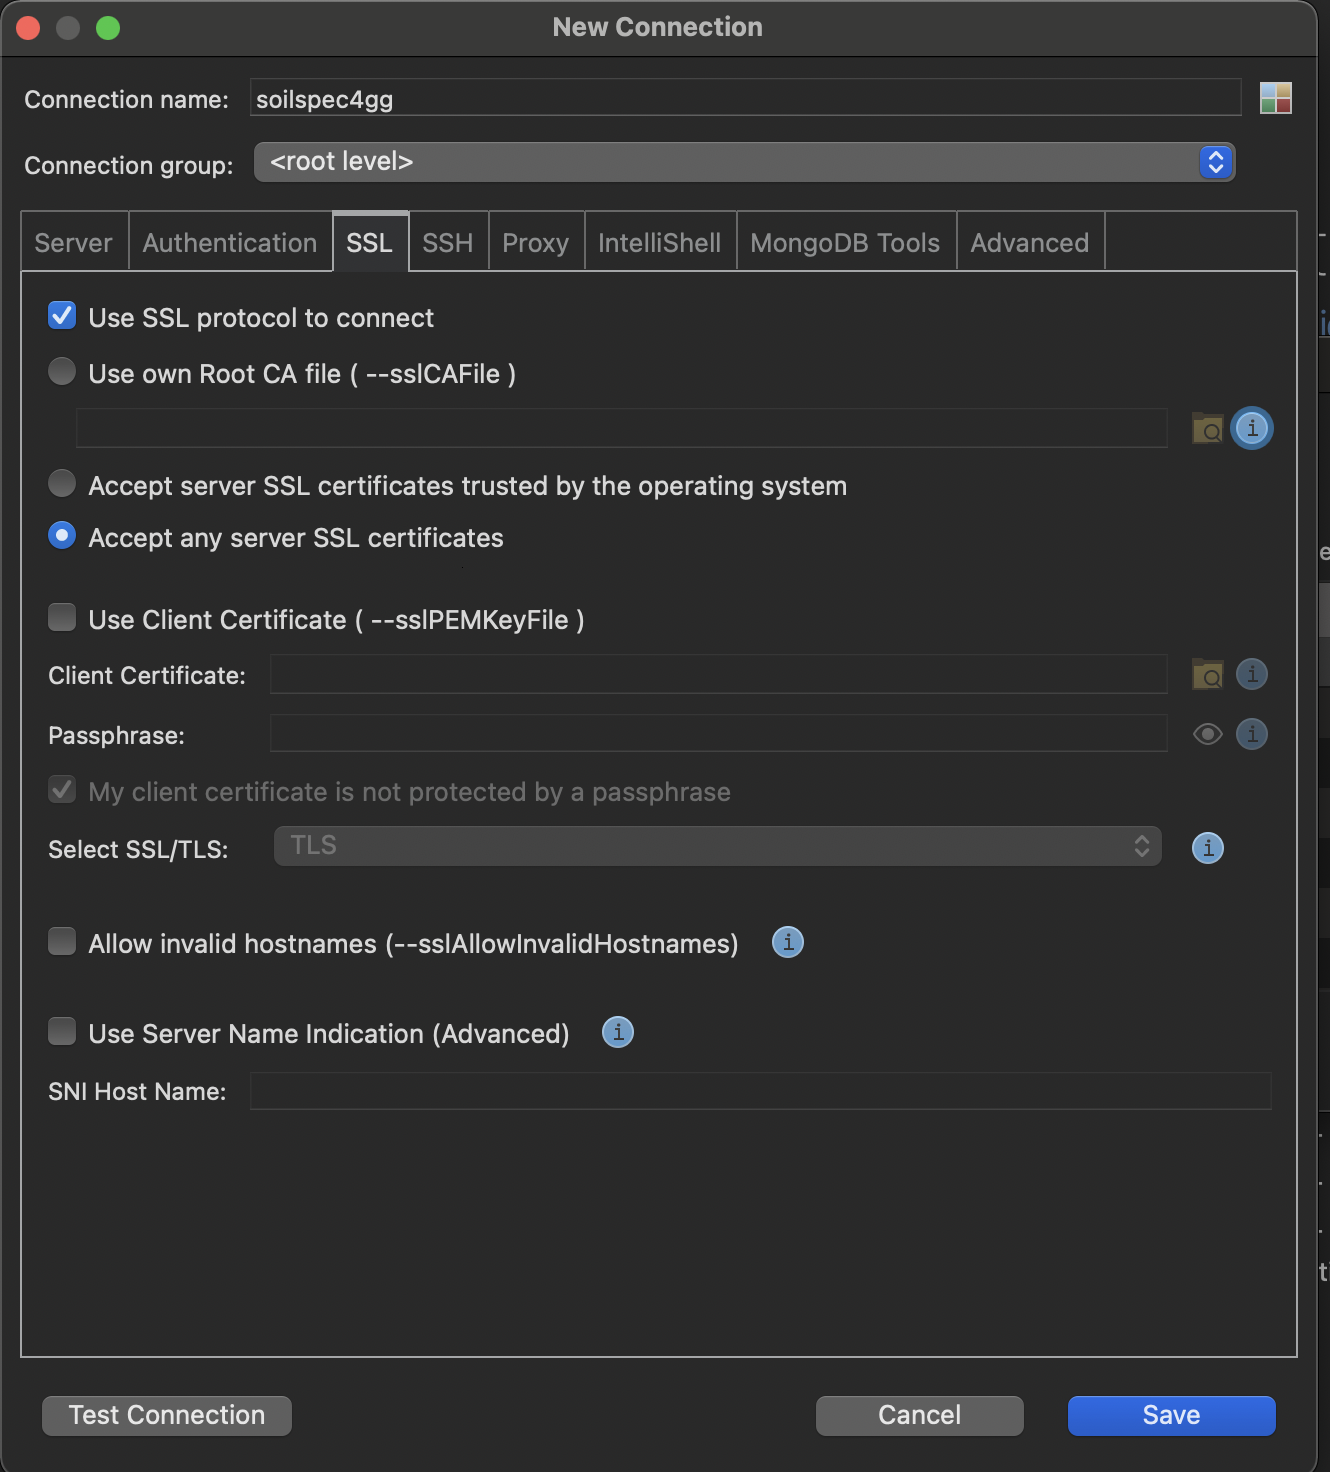
- Under the SSL tab, select
-
Test Connection before saving:
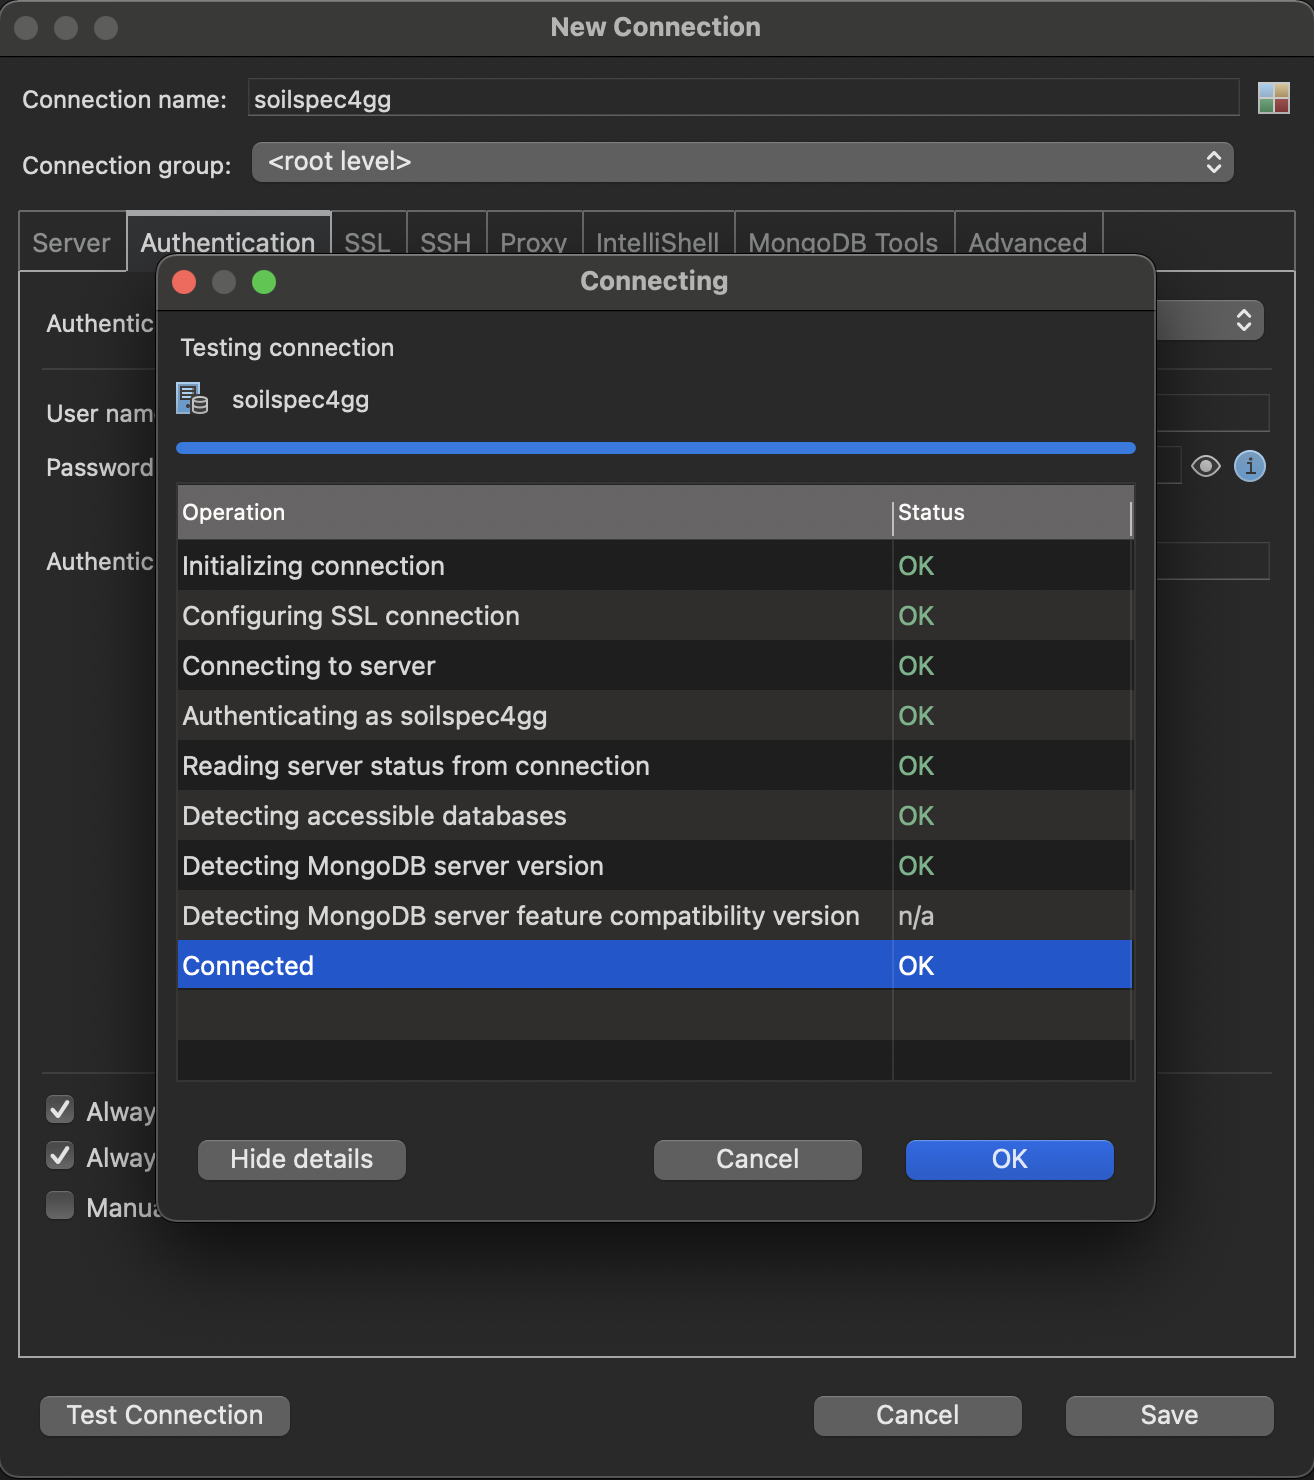
-
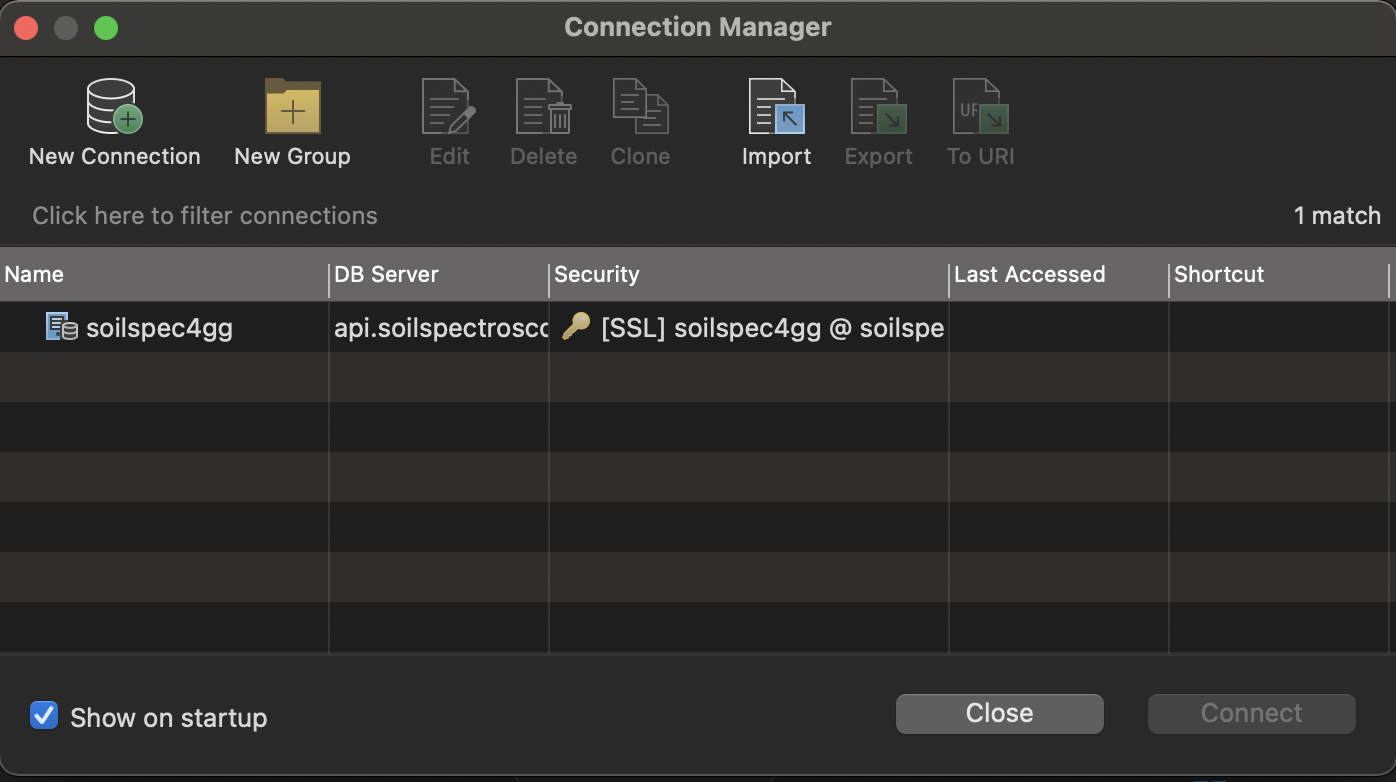
Finally, click save and connect.


Exporting the OSSL as CSV
-
Find the
soilsitecollection insoispec4gg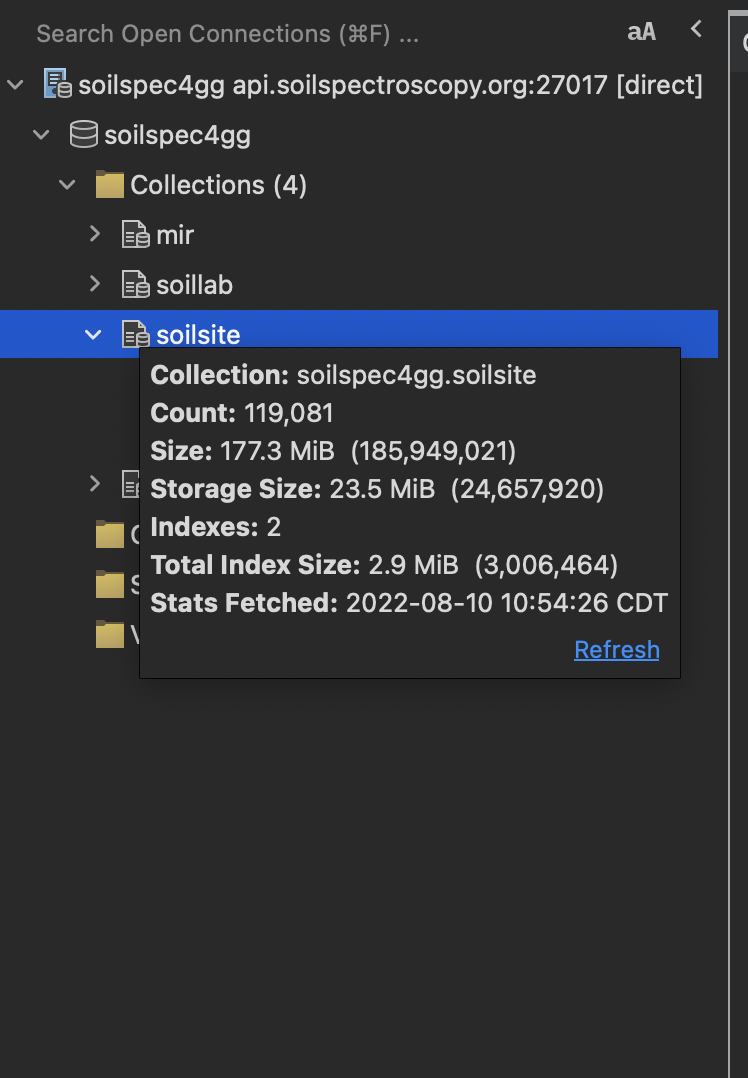
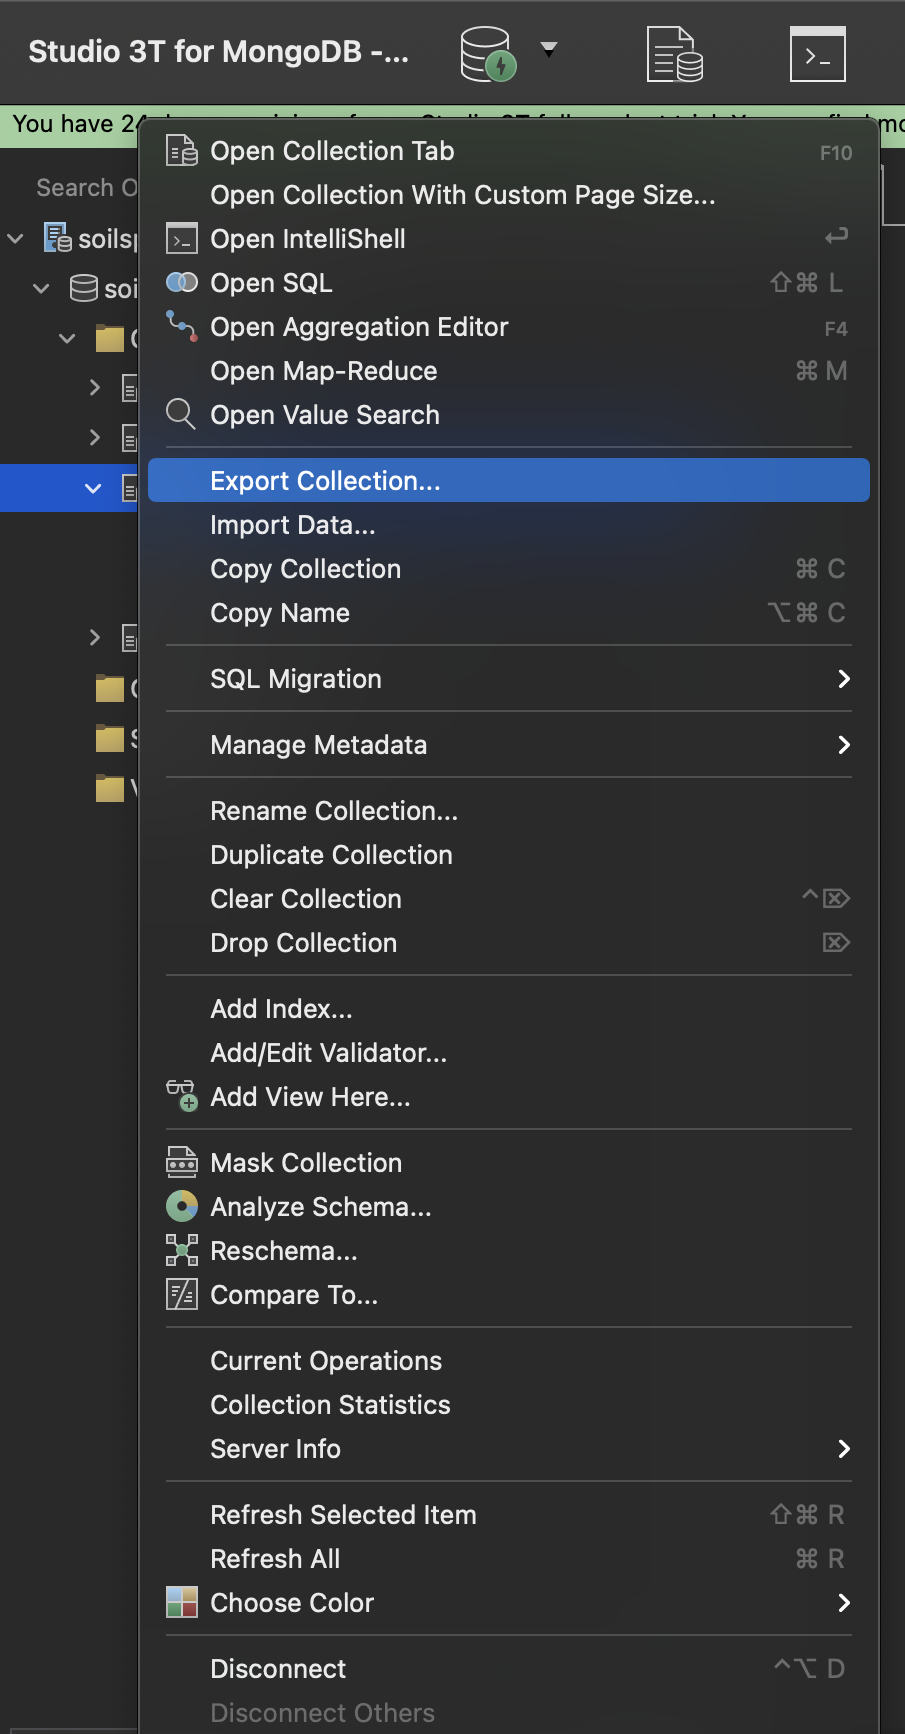
-
Select
CSVand clickConfigure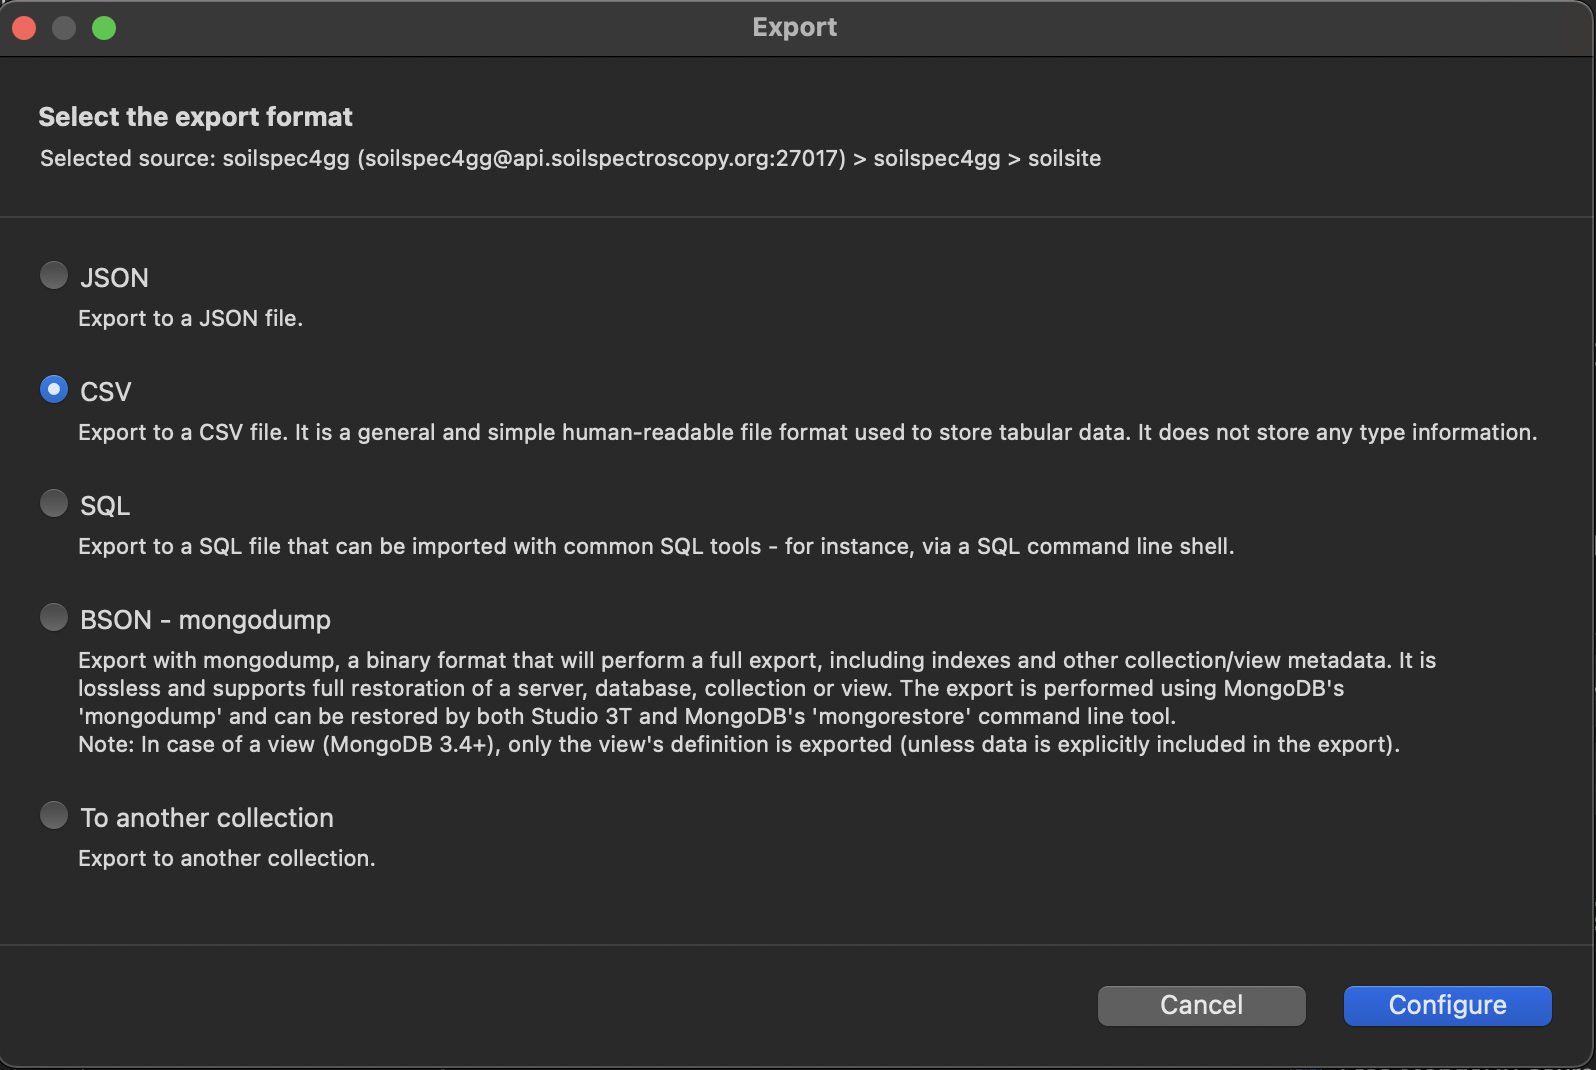
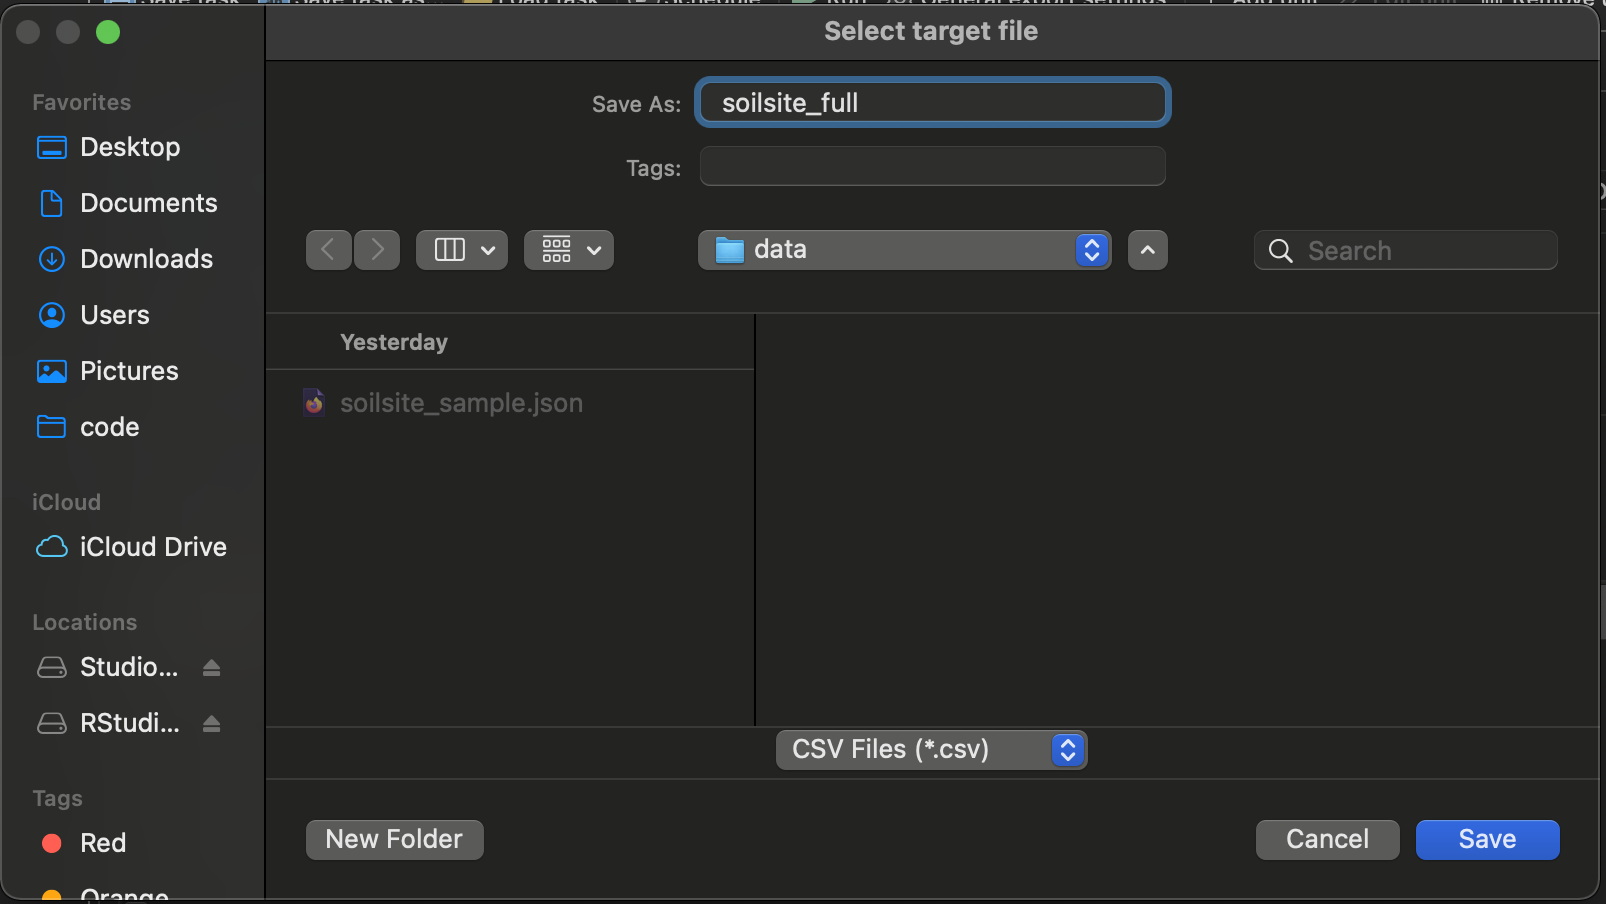
-
Set the
Export Targetto be the current working directory. For instance, name the filesoilsite.csvand save it.
-
Click
Run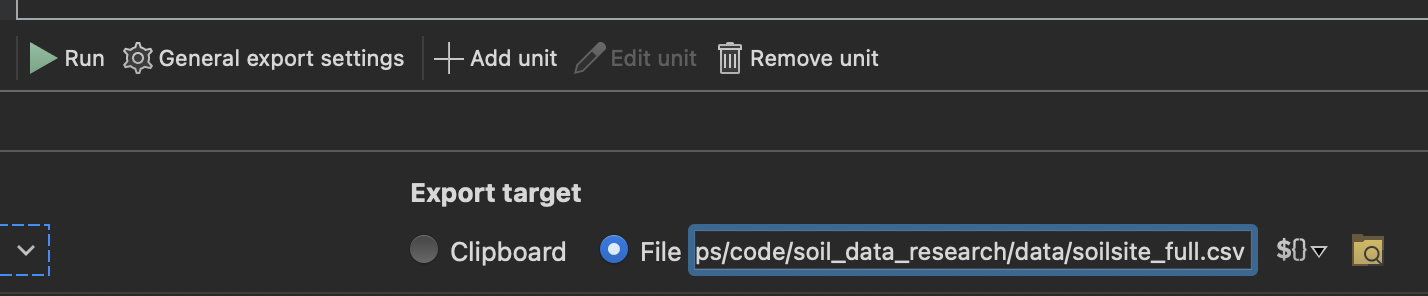
-
Results from the export are shown in the console.
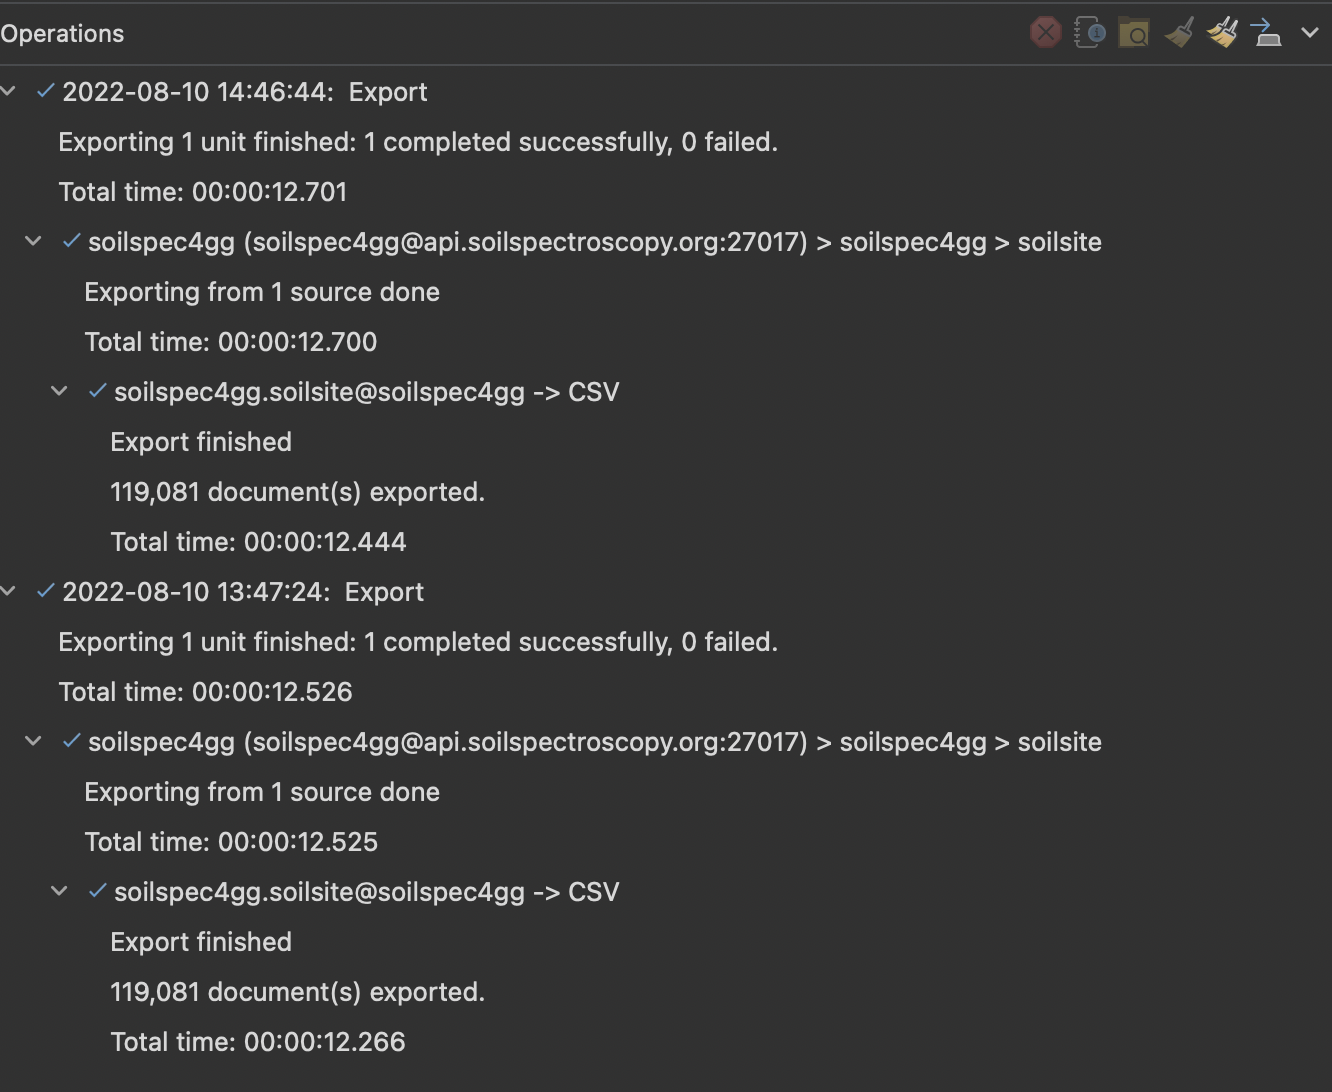
-
The data
soilsite_full.csvis now exported to the current working directory.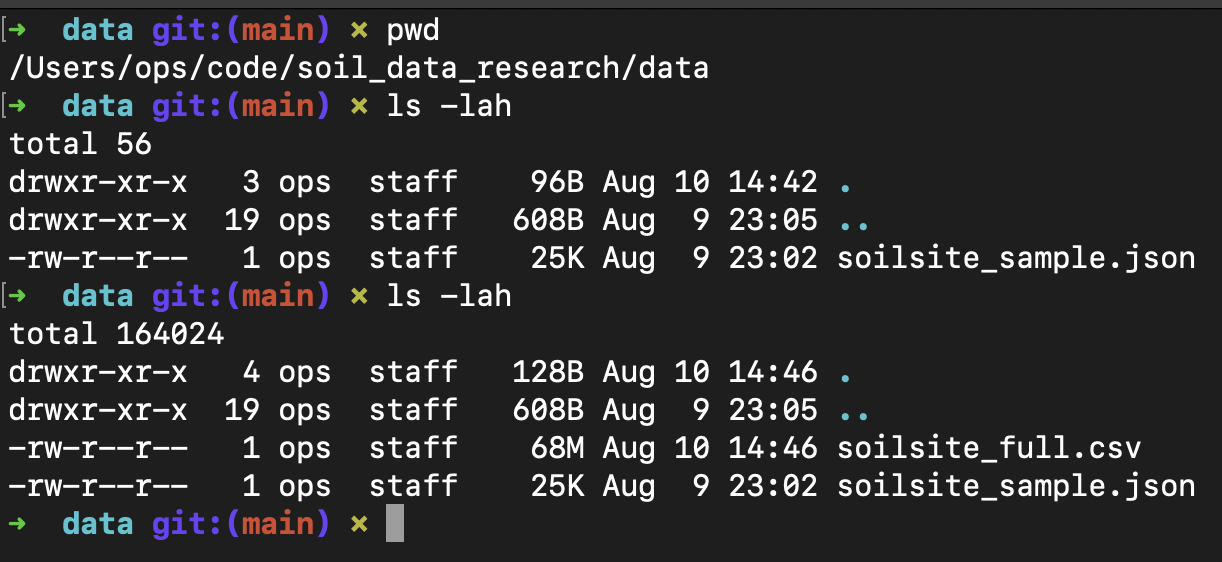


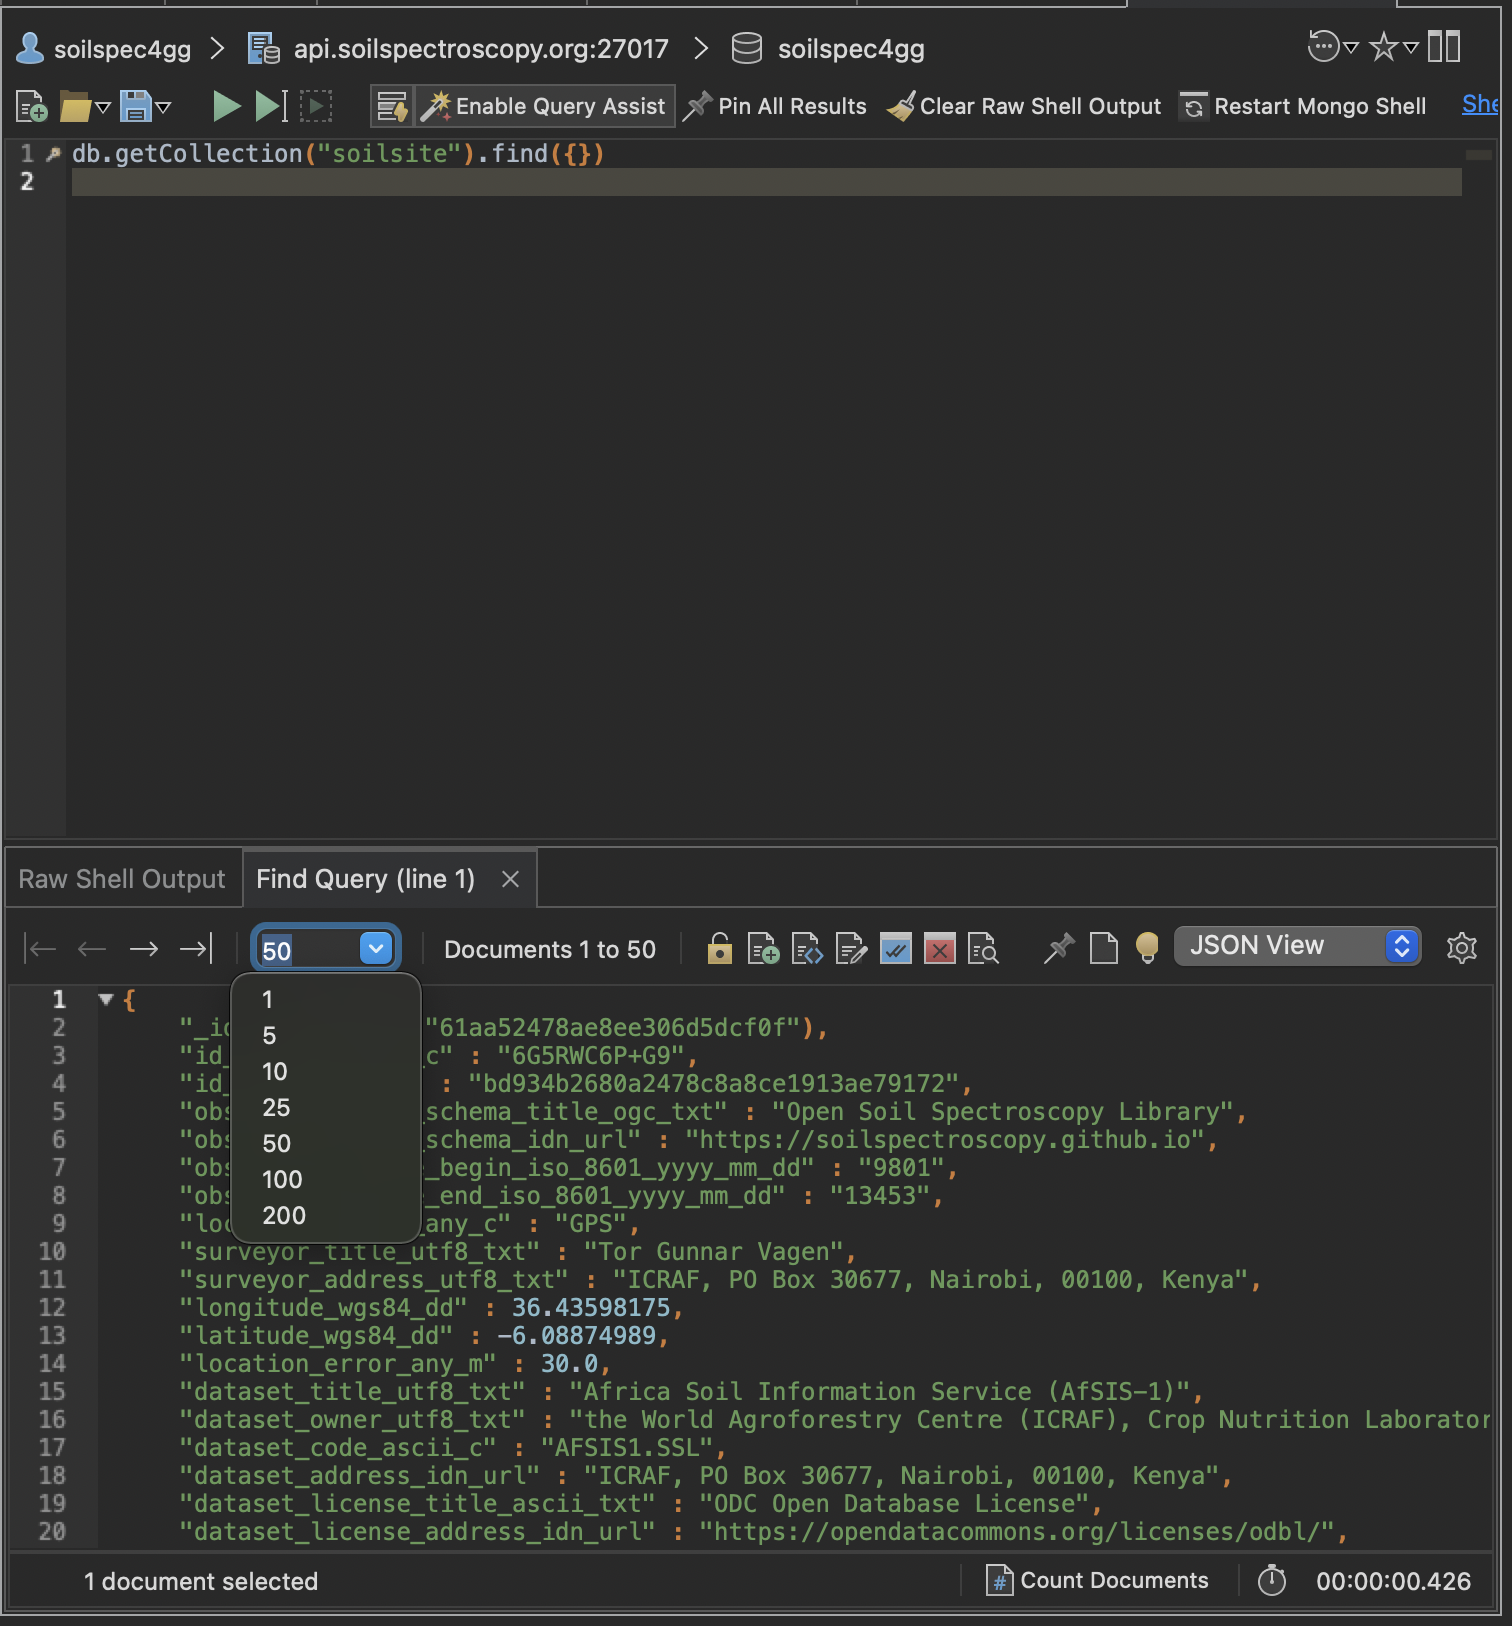
Exporting a Sample of the OSSL as CSV
To export a sample of the data, query a sample of 10 soil sites from the soilsite collection.
-
Double click the
soilsitecollection.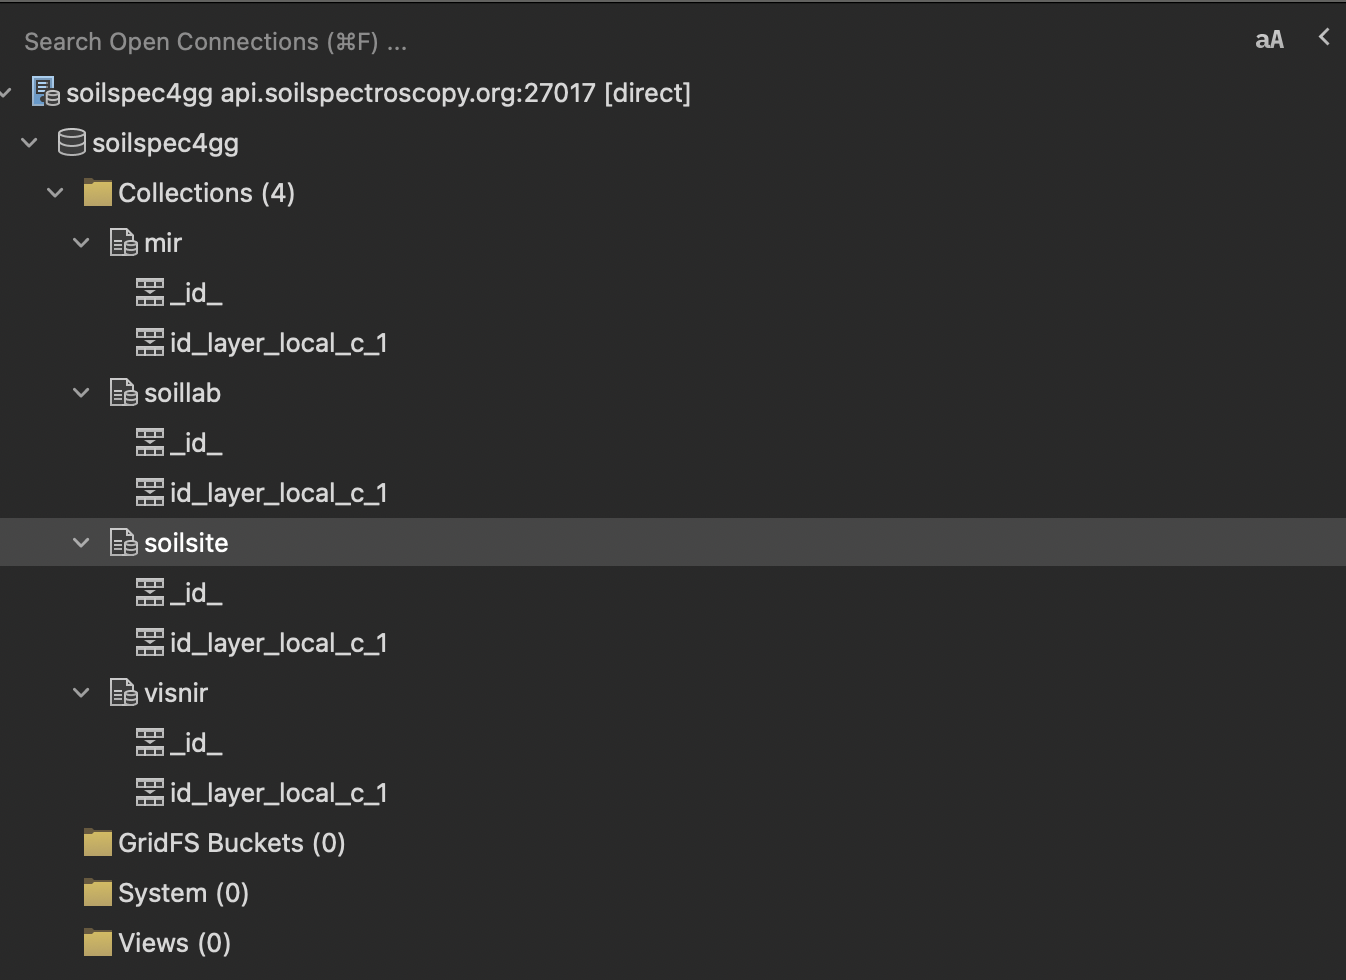
-
Run the entire script (
F5)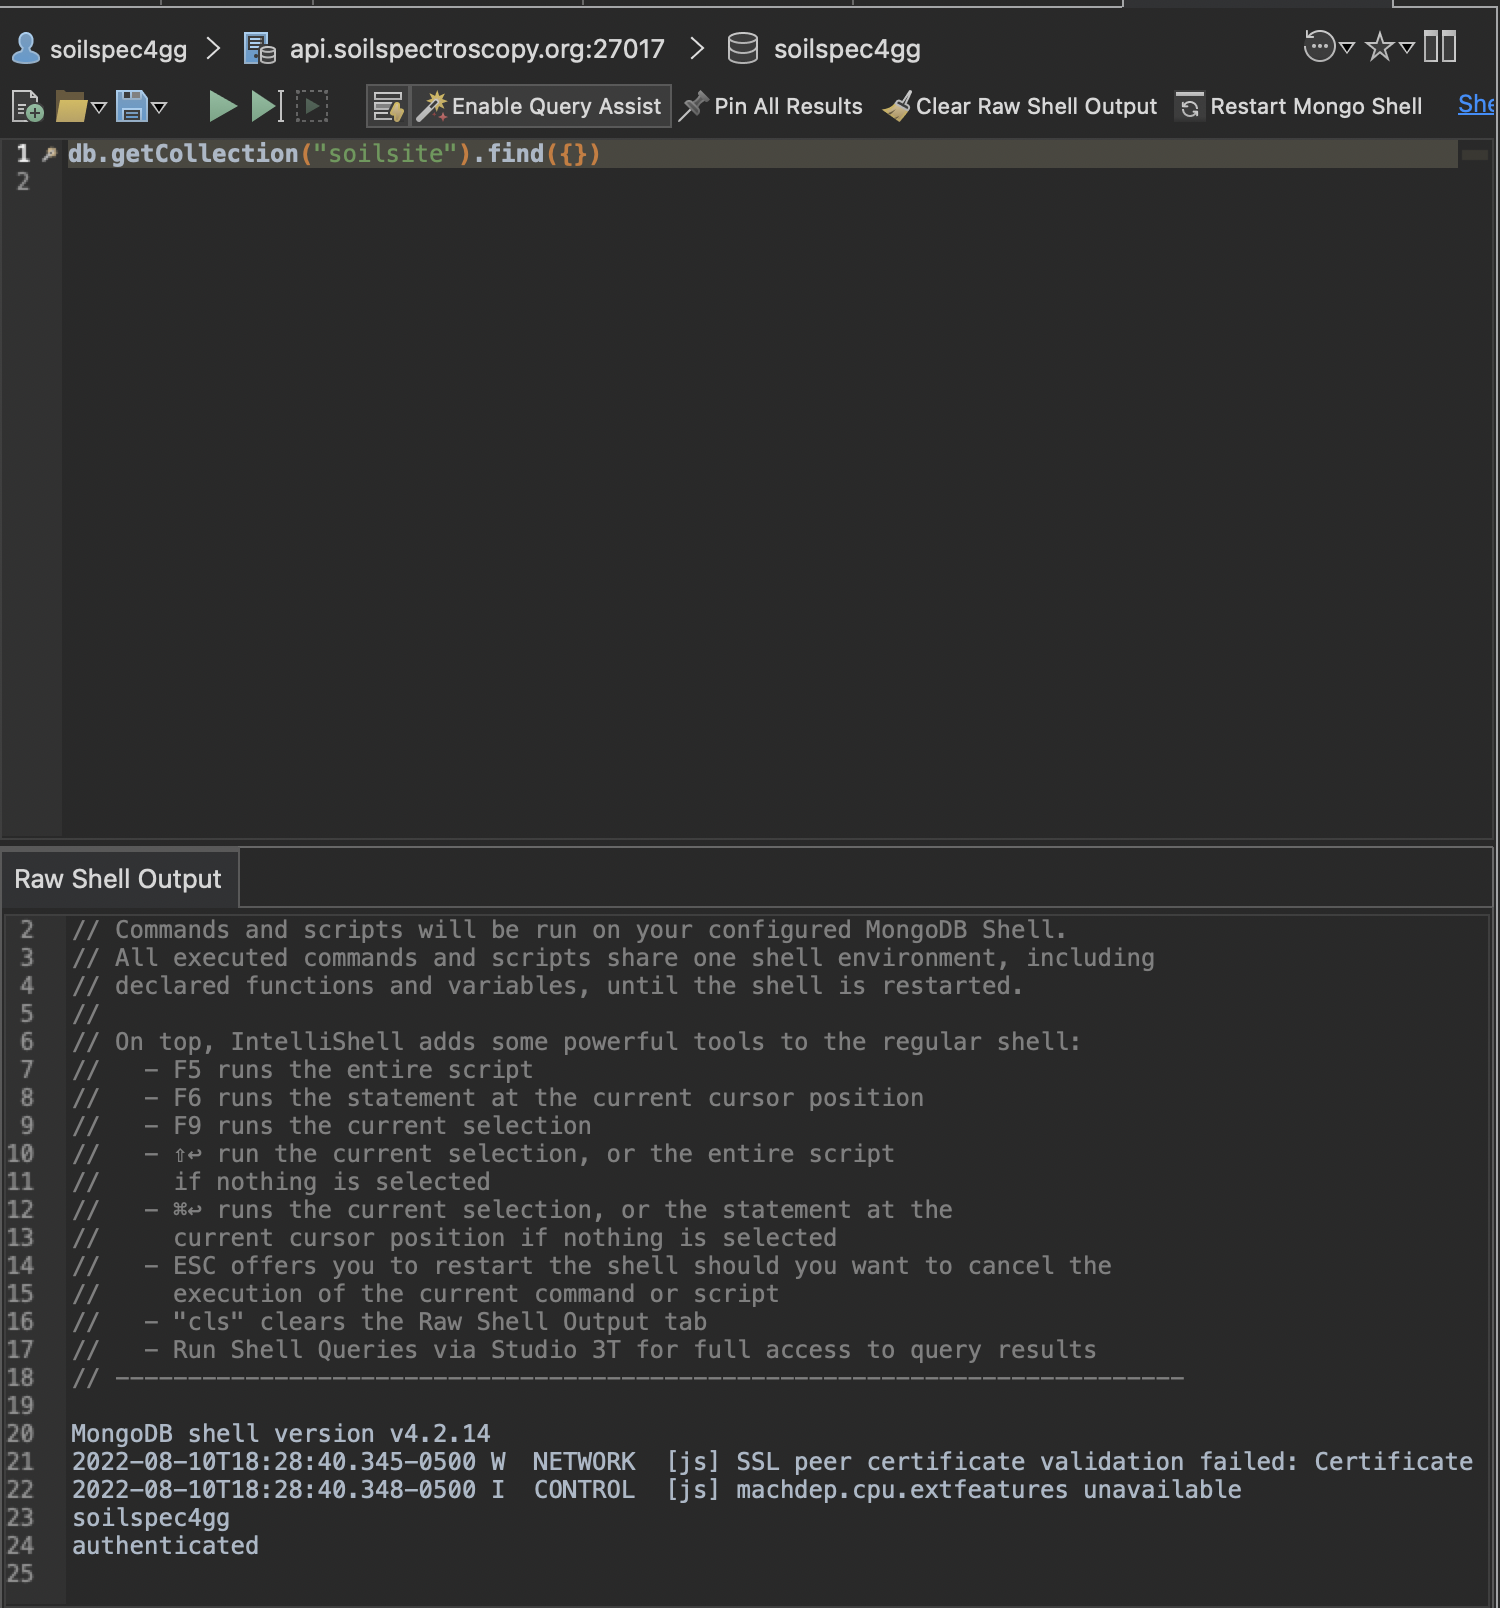
-
Select 10 soil sites
-
Right-click anywhere inside the 10 sample query and select
Export Documents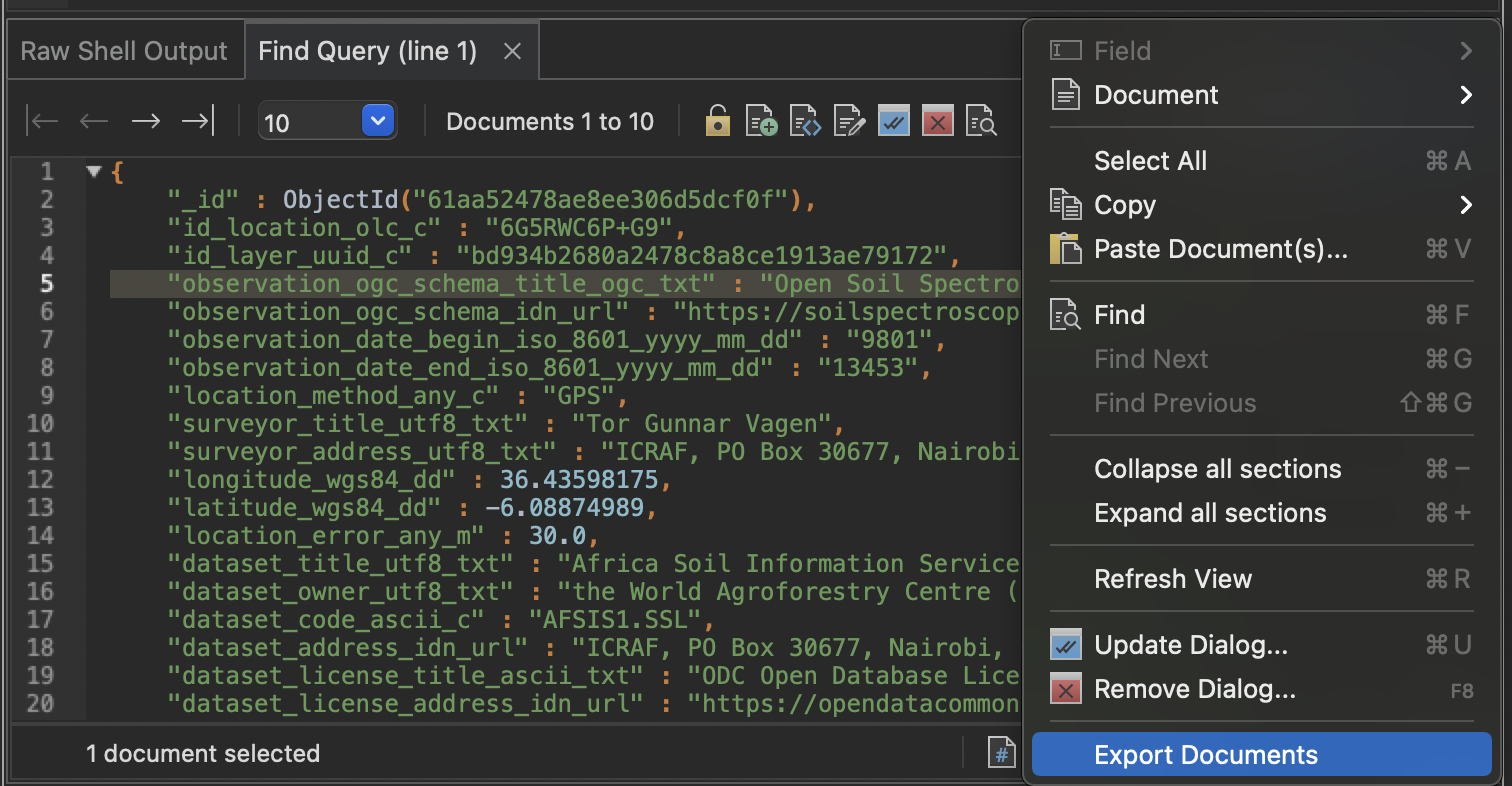
-
Select
Current Query Result. Then follow the same steps to select and configure the CSV file described earlier.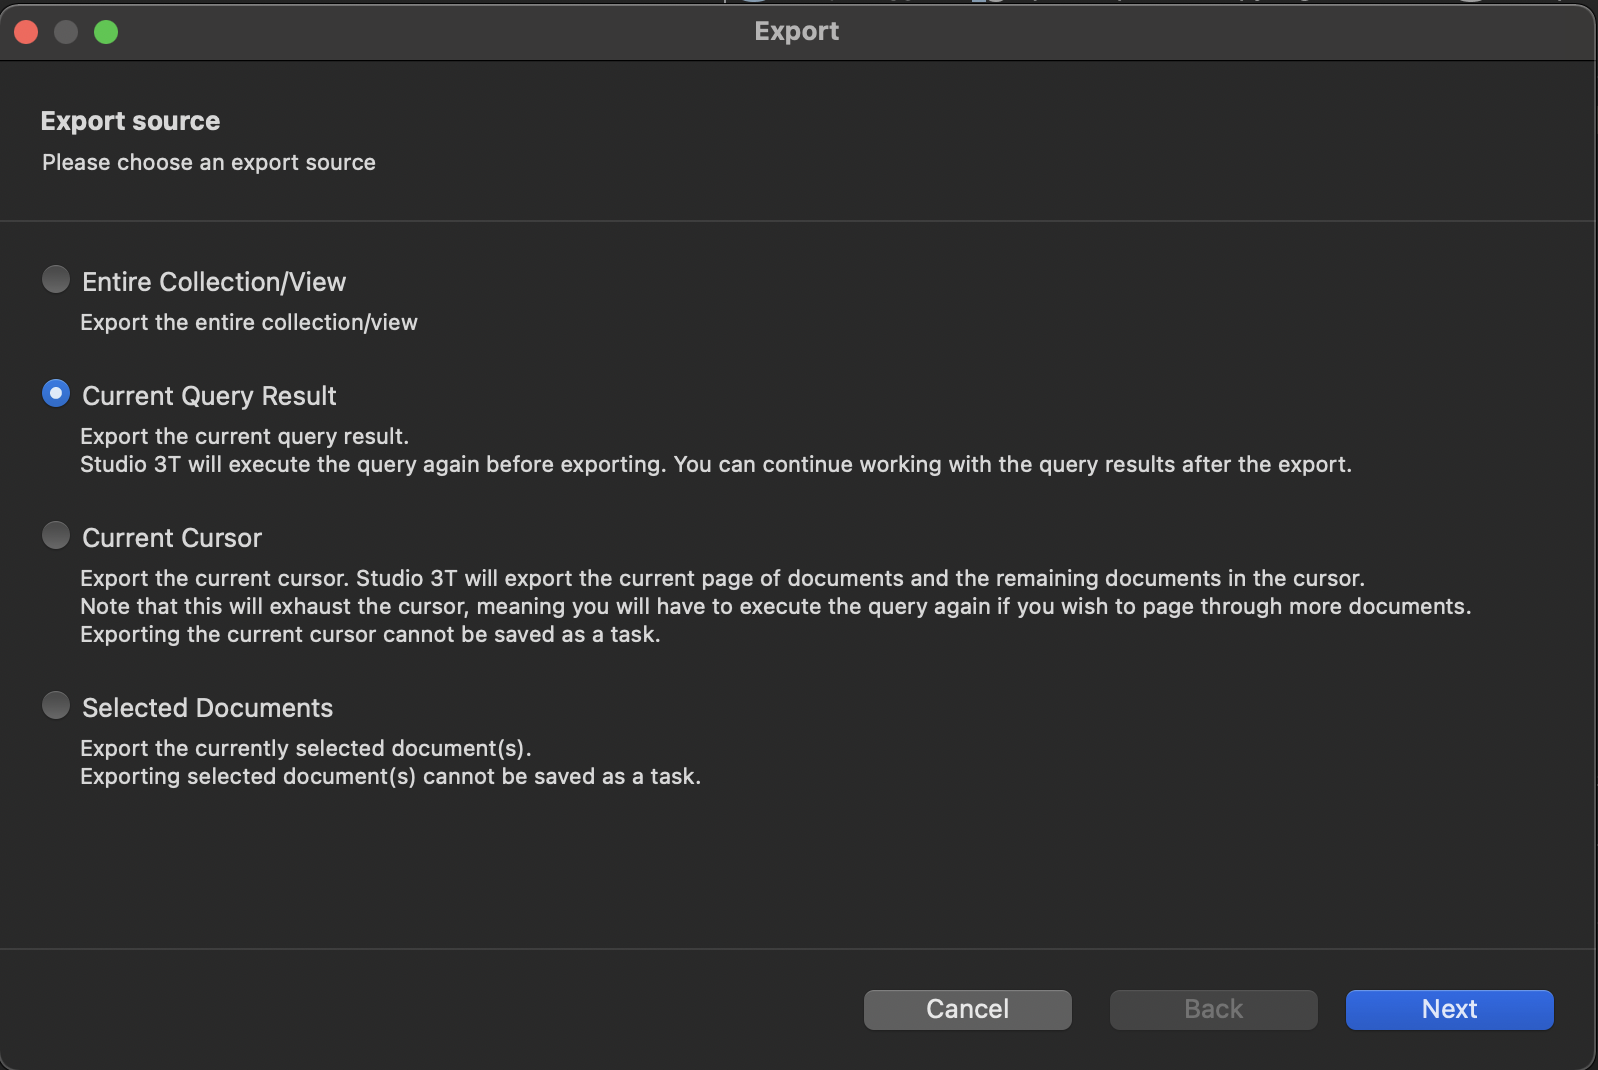


WIP --> Building a Data Pipeline
Because the VSC are long files, we decided to build a data pipeline to stream the data using SQLite:
=============
=============
And we used this SQL to query behind the web server:
=============
=============
Then we connected the database to PyScript and called the soil database with this code:
=============
=============
We use D3 to build this globe based on some modified instructions and added Uber/h3, a hexagonal grid to partition the globe into hexagons (and a few pentagons).
Here is a link to the JSON file:
D3 plot and PyScript plot
END
Visualizing the OSSL
About Us
Highlights of my background
- Worked for Goldman Sachs
- Learning to program with other technologies machine learning technologies
- Working with a team of developers to build a web application
- Experience in People Ops
- Enjoy preparing, growing and studying food plants
- People Operations complete cycles and Total Compensations Analisus
- JS, HTML, CSS, Python, SQL
I am available for contract work or full-time employment. I am also applying for environmental research graduate programs.
This I am collaborating with a team chromatic.systems
Here is a link to this project's code
The following post will explore a simple Machine Learning model.