BE_OpenWeatherMap
Introduction
Hello to the OpenWeatherMap Program,
OpenWeather is a team of IT experts and data scientists that has been practicing deep weather data science since 2014. For each point on the globe, OpenWeather provides historical, current, and forecasted weather data via light-speed APIs.
They provide data for any coordinates by utilizing our proprietary convolutional neural network/machine learning model that they use for weather forecasting and historical data calculation. On different levels, different data sources are used (such as radars and a vast network of weather stations, along with data from global/local providers such as NOAA, Environment Canada, and the Met Office).
They provide weather data through our API, they use their own numerical weather prediction (NWP) model, which uses several data sources:
- Global NWP models:
- NOAA GFS 0.25 and 0.5 grid sizes
- NOAA CFS
- ECMWF ERA
- Weather stations:
- METAR stations
- Users’ stations
- Companies’ stations
- Weather radar data
- Satellite data
They download and save data from these sources. Then it is processed by their in-house set of algorithms, to improve its quality and accuracy. This data processing is being done in real-time, to provide the latest nowcasts and forecasts. These programs are used to load the online data of OpenWeatherMap, create the JSON file, and analyze the data. They have already supported a library in Python named "pyowm". You can find more detailed information at this link here.
In order to use this data, we must create an account and get the personal API key. For more details, you can access this link here.
Purpose
This project aims to get the historical data, current data, forecast data from OpenWeatherMap platform. Then, we use this data to compare with the experimental data. For this reason, we created these following steps to visualize the progress:
- Understand the OpenWeatherMap syntax to get the data.
- Store the readable useful data.
- Analyze this data.
- Compare between the OpenWeatherMap data and the experimental data and fiving conclusion.
Data
Historical data
I had bought the package historical data of Chasseneuil-du-Poitou, France from 1979 until December 2020. The name of this file: ChasseneuilWeather2021.csv
However, the data was too much. For this reason, I selected the needed data and changed it to JSON type including time, temperature, pressure, humidity, wind speed, wind degree, and weather description.
ChasseneuilWeather_Final_Update_Need.json
After that, I need to update my data every day by the personal API key. I save the name following some rules:
| Name | Type | Description | Exemple |
|---|---|---|---|
| yyyy-mm-dd | Json | Historical every-hour data on 10th March, 2021 | 2021-3-10.json |
| exact_historical_ yyyy-mm-dd | Json | The needed data extracted from yyyy-mm-dd file | exact_historical_2021-3-10.json |
| Final_ yyyy-mm-dd | Json | The final file after appended the last data extend until the newest data | Final_2021-2-2.json |
Here is the link to my data warehouse: Historical Data
Forecast data
For the Forecast data, the OpenWeatherMap provides many ways to get data. There are some options for you:
- Data 3-hour interval for 5 days
- Data 1-hour interval for 48 hours
As the same as the historical data, here is how I named my files:
| Name | Type | Description | Exemple |
|---|---|---|---|
| threehoursforecast yyyy-mm-dd-hh | Json | Needed data 3-hour interval for 5 days | threehoursforecast2021-01-06-16.json |
| everyhourforecast yyyy-mm-dd-hh | Json | Detailed data 1-hour interval for 48 hours | everyhourforecast2021-01-06-16.json |
| exact_everyhourforecast yyyy-mm-dd-hh | Json | Needed data 1-hour interval for 48 hours | exact_everyhourforecast2021-01-06-16.json |
Here is the link to my forecast data warehouse: Forecast5days Forecast
Result Analysis
After stocking the data, we analyzed this. For this sector, we consider the historical and forecast data.
Current Data
For the current data, it has one value so we can ignore it.
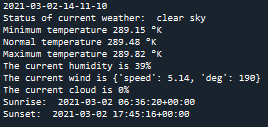
Figure 1: An example of current data.
Historical Data
Short period
First, we demonstrate the relation between time and temperature in a short time following some recent data. From these figures, we analyze the trend of the data. From figure 2, we consider the maximum variation of temperature and the time range where the temperature reached maximum or minimum values.
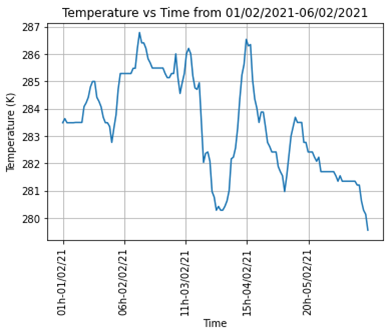
Figure 2: The relation between temperature and time from 01/02/2021 to 06/02/2021.
Second, it is possible to analyze any 2 aspects (except the weather_description) including time, temperature, pressure, humidity, wind_speed, and wind_deg. For example, we demonstrate the relation between humidity-temperature, pressure-humidity, wind_speed-wind_deg, etc. From figure 3, we see the distribution of the humidity is concentrated in the range of 87-93%.
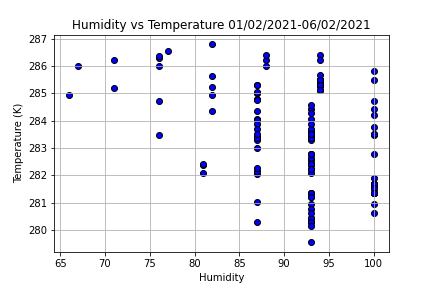
Figure 3: The relation between humidity and temperature from 01/02/2021 to 06/02/2021.
Long period
Third, I developed two ways to analyze the data for a long time. The first way aims to show the trend of temperature following the time in a year which analyzes the trend of temperature in one year. In this figure, we take an example of the year 1979. The second ways analyze the data for one month from 1979 until the present which demonstrates the temperature variation for a long time.
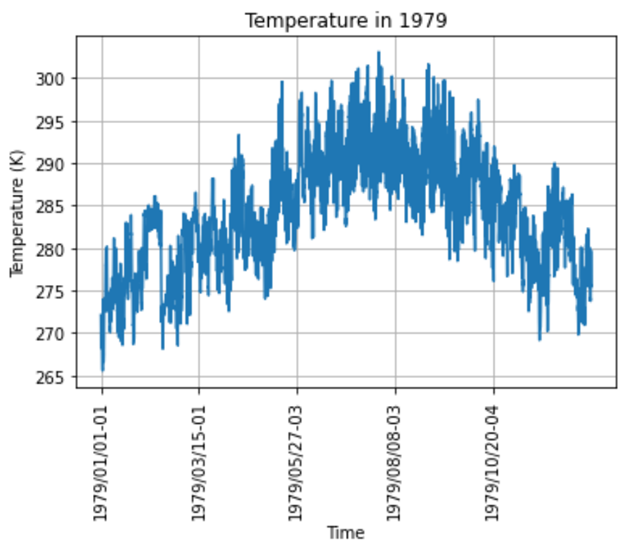
Figure 4: The temperature in 1979.
From figure 4, we see the maximum temperature was recorded in summer and the minimum temperature was recorded in winter.
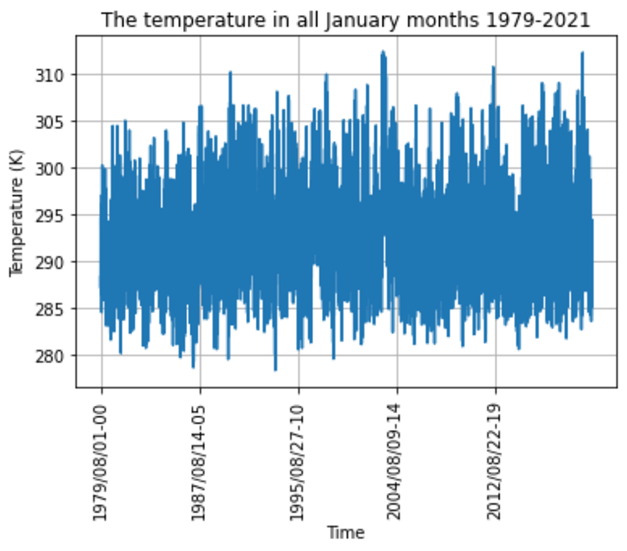
Figure 5: The temperature in all January months 1979-2021.
As we can see in figure 5, the trend of temperature was increasing progressively following the time.
Forecast Data
As we mentioned in the Data section, there are two ways to get the forecast data. In the 48-hour data, the figures are nearly similar to the appearance of figure 2. Next, we consider forecast 5-day data which allows us to predict the weather. There are 3 examples to demonstrate forecast data which I took one previous day of their current date.
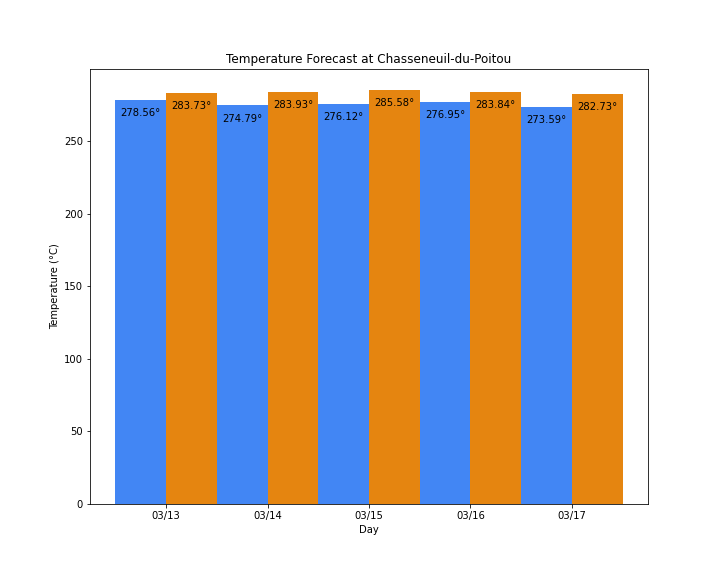
Figure 6: The forecast temperature was taken on 12th March 2021.
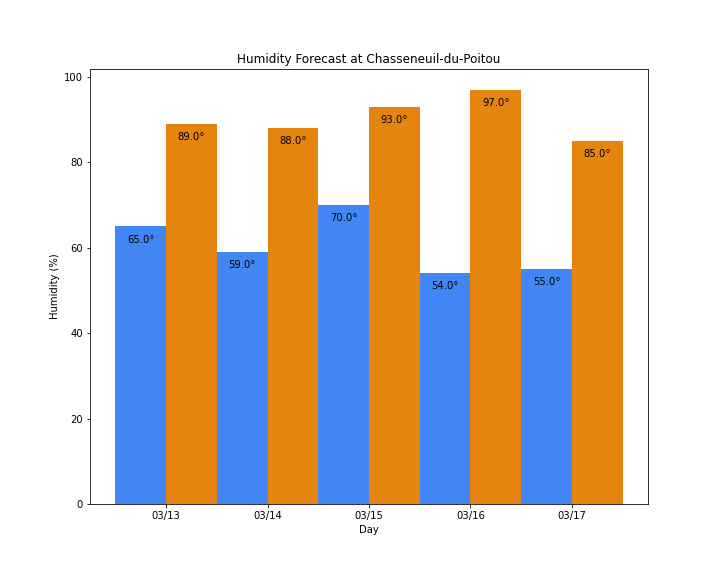
Figure 7: The forecast humidity was taken on 12th March 2021.
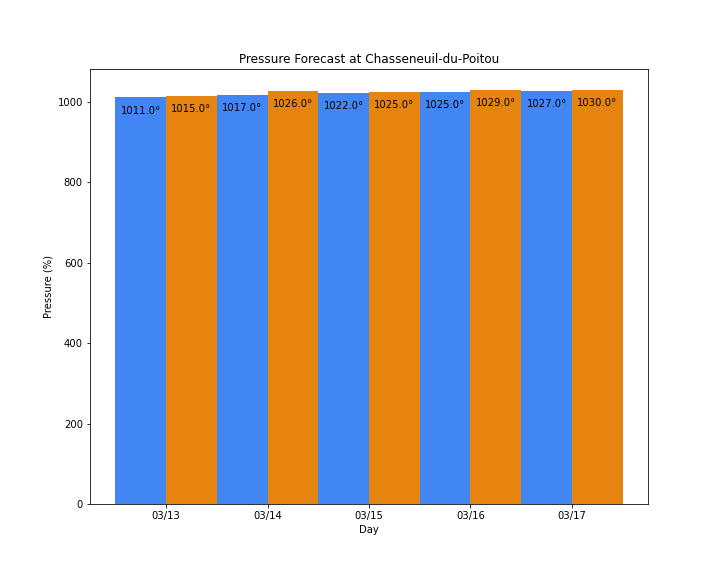
Figure 8: The forecast pressure was taken on 12th March 2021.
The errors between historical and forecast data
In this sector, we analyze the different historical and forecast data of the same period of time. This analysis concludes the accuracy of the OpenWeatherMap deep-learning program.

Figure 9: The comparison of historical and forecast data 06/02/2021-07/02/2021.
From figure 9, the difference between historical and forecast data is not really significant. We can conclude their program is predictably exact.
Python Programming code
OpenWeatherMap
api_key.py
First, we need to have an API key of OpenWeatherMap to use their services. In my part, we have the api "db8b55378d950841ba215808e438c082". We add this API key to the OS environment. This program is to call this key.
location.py
There are 4 ways to identify a location following the OpenWeatherMap library. There are:
- name
- id
- latitude - longitude
- zipcode
weatherPy.py
This program aims to take the data following locations. For example, we can get all data of cities from longtitude 0-50.
Current data
current.py
This program allows you to get all the current weather data. We can use it when we need data at the current time of the experiment. It also provides the current weather description.
Historical data
This part is aimed to create a historical database from 01/01/1979 to the present focused on the temperature and humidity factors. It is required to update everyday from the website because of the limitation of the free account. So we created a program to store and analyze the data in the JSON type. There are 2 programs:
learningjson.py
A draft illustrates many functions and examples of JSON files and a 'list of dictionaries' analysis.
historicaldata.py
This program is one of the most important parts in order to store and analyze the historical data.
- Change the Unix timestamp to normal time and vice versa.
- Get the online data in the previous 5 days.
- Store it as a JSON file.
- Extract wanted data from the new JSON file.
- Change the data to the same type as the old data.
- Check if existing any duplicated data.
- Append the wanted data to the old data.
- Create the updated JSON file.
Forecast data
weatherforecast.py:
- Get the forecast weather in the next 5 days, 3-hour interval.
- Get the forecast weather in the next 48 hours, 1-hour interval.
- Write all data as the JSON type.
- Get Weather At a Specific Time.
- Get Weather at a Specific Time of tomorrow.
- Check for certain weather conditions in a forecast.
- Check if a particular weather condition exists at a specified time for 5 days.
timezone_conversation.py
Change the Unix timestamp to normal time and vice versa.
pyown_helper.py
Use the Pyown library to transform forecast data.
Analysis data
weatherGUI.py
Draw the bar chart of forecast data.
Figure.py
This program draws almost all figures in this project.
- Draw a line time-temperature chart of 1-hour interval data of one year.
- Draw a line time-temperature chart of 1-hour interval data of one month for 40 years.
- Draw a scatter plot of temperature and time.
- Draw a scatter plot of temperature and humidity.
- Draw a line plot of temperature and time.
- Draw the comparison of historical and forecast data.