The purpose of this repo is to provide sample instructions for installing Open Data Hub (ODH) in Azure Red Hat OpenShift (ARO). We'll do a smoke test of the components to ensure Open Data Hub components operate as expected.
- Azure Red Hat OpenShift 4 cluster
- Admin access to OpenShift
- OpenShift CLI
Login to the cluster using oc login and admin credentials.
Create a new project for ODH
oc new-project odhWe will deploy ODH using the Operator.
Login to the cluster using the console and admin credentials.
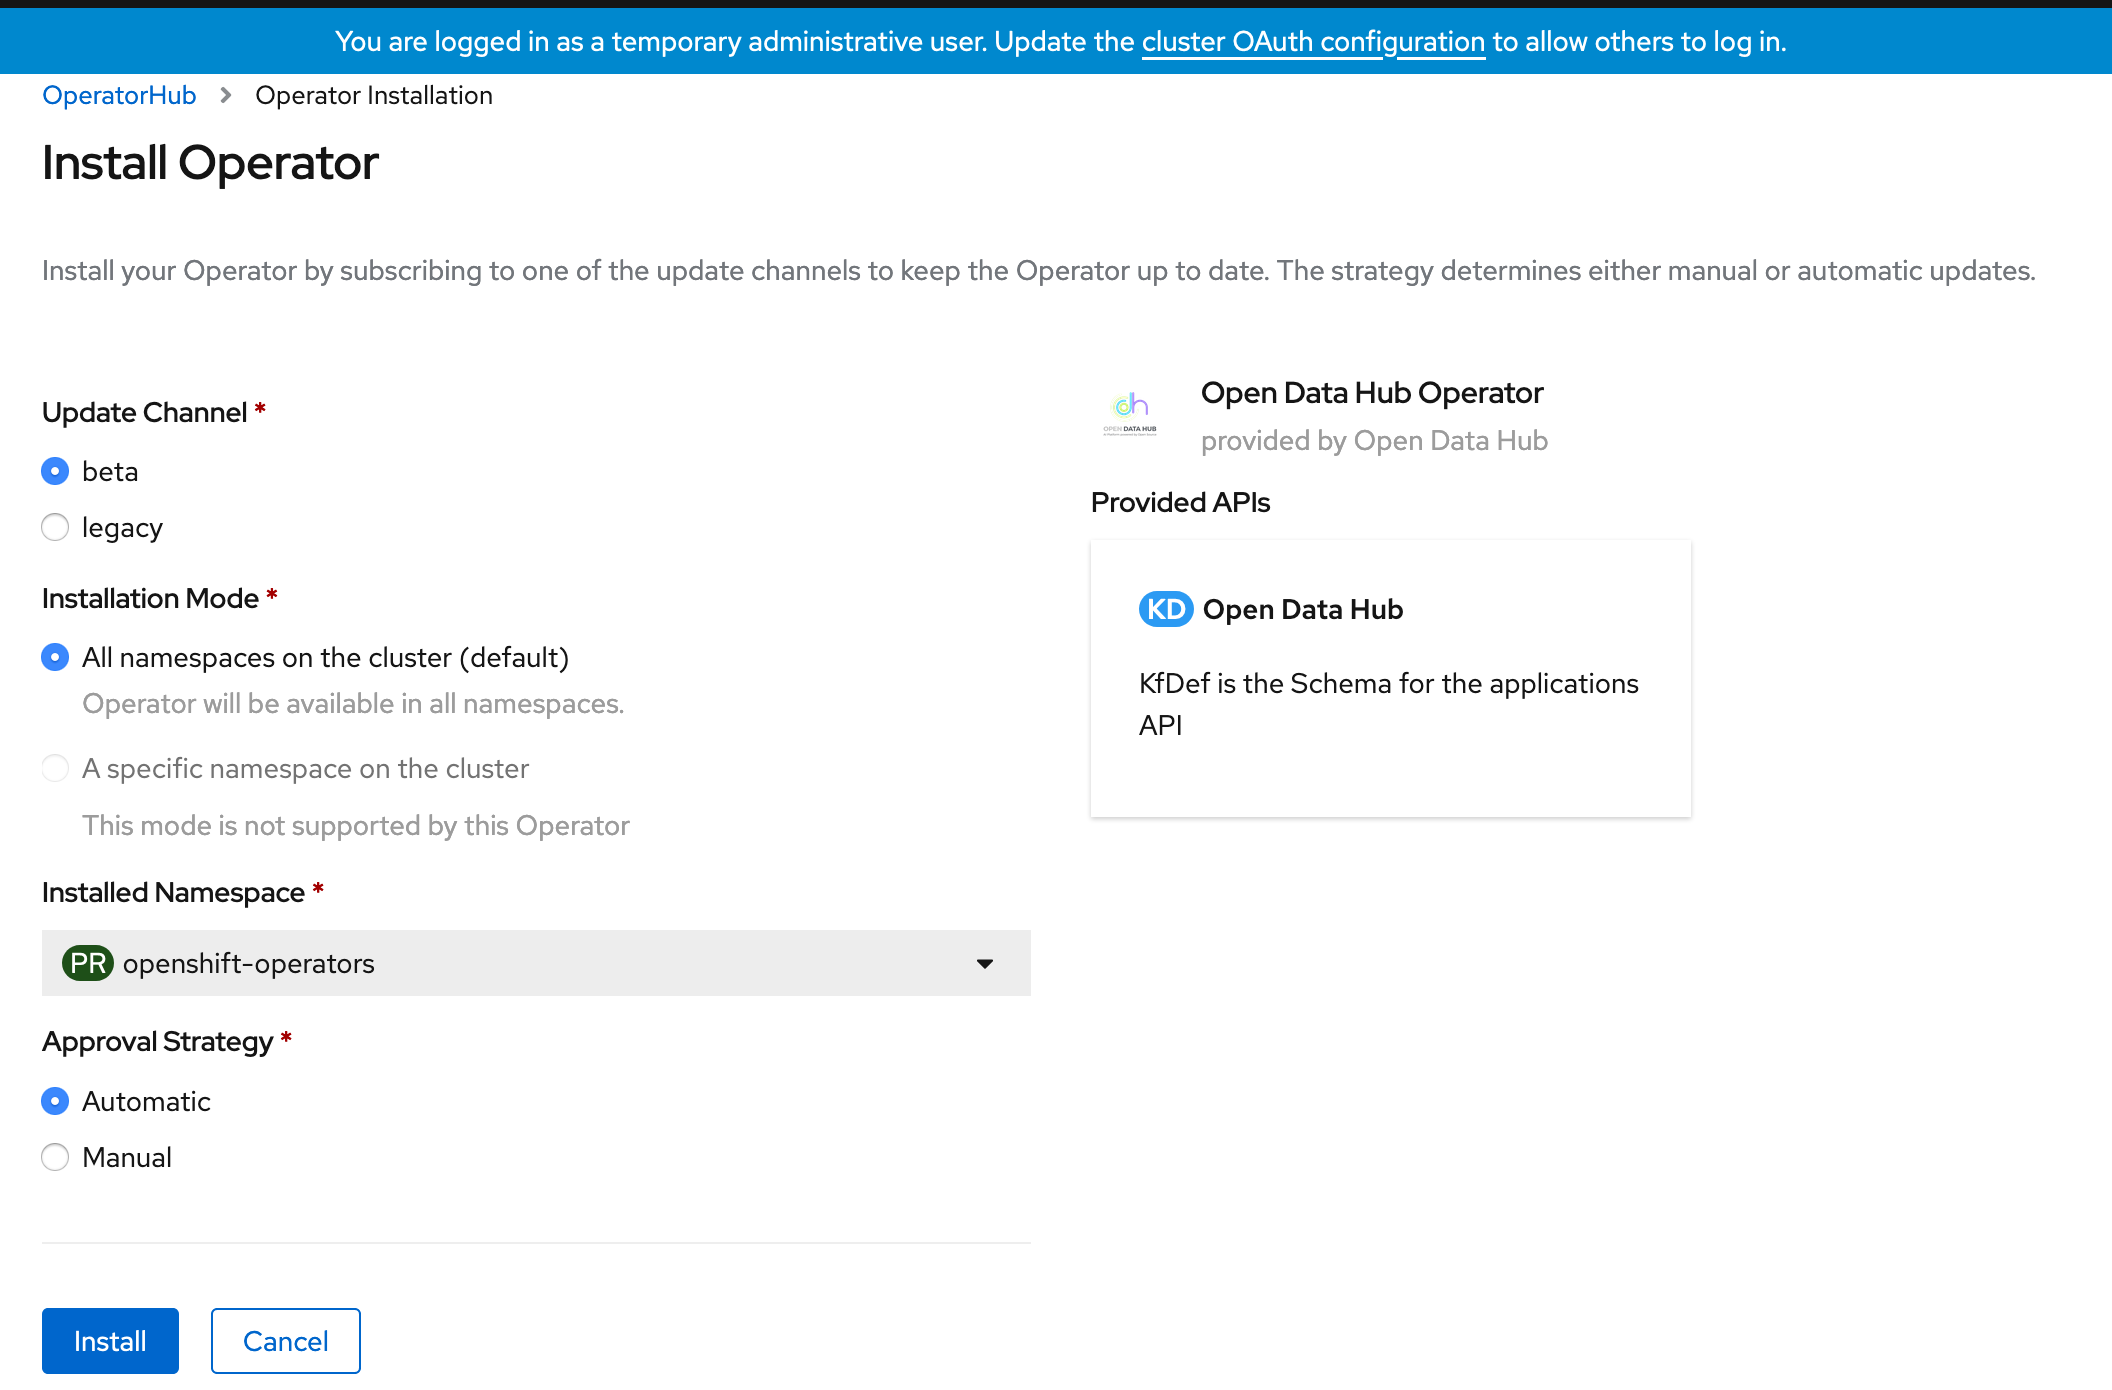
Navigate to OperatorHub and search for Open Data Hub Operator. Install using the beta channel. The version installed in this guide is 0.9.
Under the install operators, you should see the status of the operator change to Succeeded.
You can also run
oc wait --for=condition=Available deploy/opendatahub-operator -n openshift-operators
Make sure you are in the odh project. Once the operator is running, click on Open Data Hub under the Provided APIs.
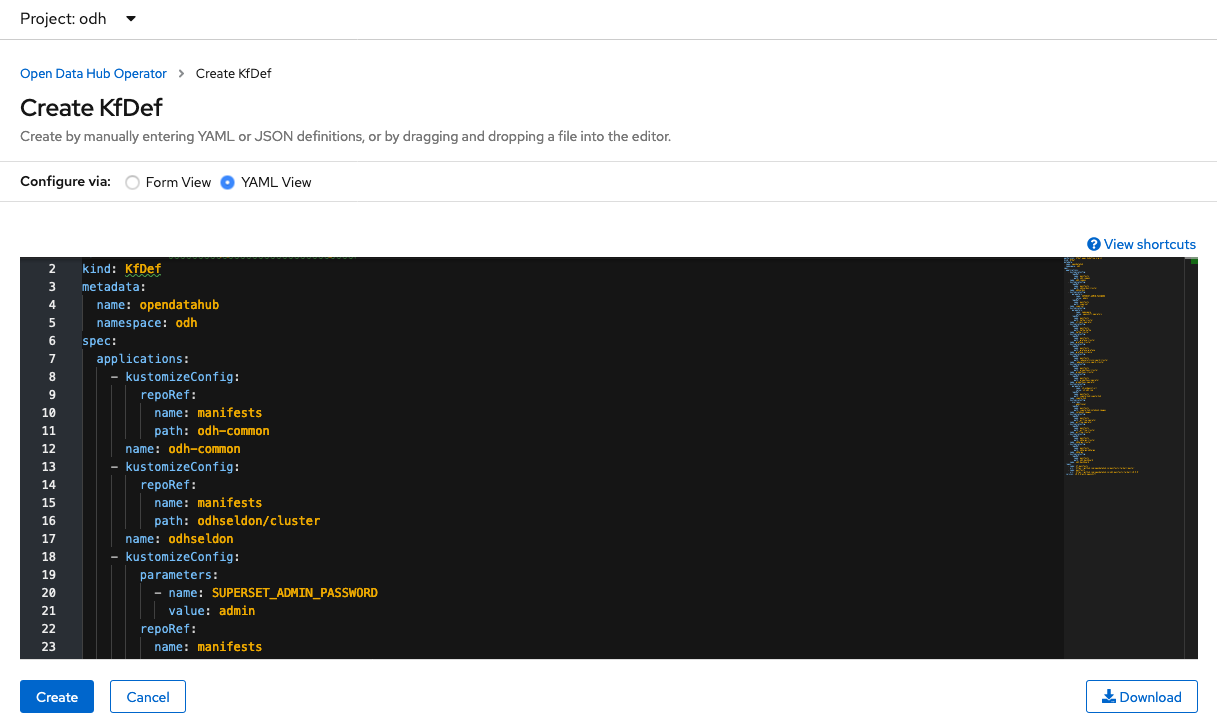
Select Create KfDef
Switch to the YAML view if you would like to see the underlying components. We'll stick with the defaults and install. Click Create.
Wait until all the components are deployed and running
oc get pods -n odh
Output
NAME                                                          READY   STATUS      RESTARTS   AGE
airflow-on-k8s-operator-controller-manager-557945bd5c-mkqz8   1/1     Running     0          4h48m
argo-server-6dfb7f65f9-jbkbh                                  1/1     Running     0          4h48m
grafana-deployment-db6c8989c-hrsxz                            1/1     Running     0          4h47m
grafana-operator-69f449bf54-n7fq9                             1/1     Running     0          4h47m
jupyterhub-1-deploy                                           0/1     Completed   0          4h48m
jupyterhub-1-tcwvj                                            1/1     Running     0          4h47m
jupyterhub-db-1-deploy                                        0/1     Completed   0          4h48m
jupyterhub-db-1-wtmr9                                         1/1     Running     0          4h47m
jupyterhub-nb-kube-3aadmin                                    2/2     Running     0          4h28m
odh-dashboard-645579c66d-92jdg                                1/1     Running     0          4h47m
odh-dashboard-645579c66d-hd6tg                                1/1     Running     0          4h47m
odh-message-bus-entity-operator-6bfb9b9749-9mgxj              3/3     Running     0          5h20m
odh-message-bus-kafka-0                                       2/2     Running     0          5h21m
odh-message-bus-kafka-1                                       2/2     Running     0          5h21m
odh-message-bus-kafka-2                                       2/2     Running     0          5h21m
odh-message-bus-zookeeper-0                                   1/1     Running     0          5h22m
odh-message-bus-zookeeper-1                                   1/1     Running     0          5h22m
odh-message-bus-zookeeper-2                                   1/1     Running     0          5h22m
prometheus-operator-7dbf9b587c-t7kdl                          1/1     Running     0          4h47m
prometheus-prometheus-0                                       3/3     Running     1          4h47m
seldon-controller-manager-7d9b7d5b87-h62ds                    1/1     Running     0          4h48m
spark-operator-746dd44db5-pxk76                               1/1     Running     0          4h47m
superset-1-bg792                                              1/1     Running     0          5h22m
superset-1-deploy                                             0/1     Completed   0          5h22m
workflow-controller-fc6b4dcff-mjhhs                           1/1     Running     0          4h48m
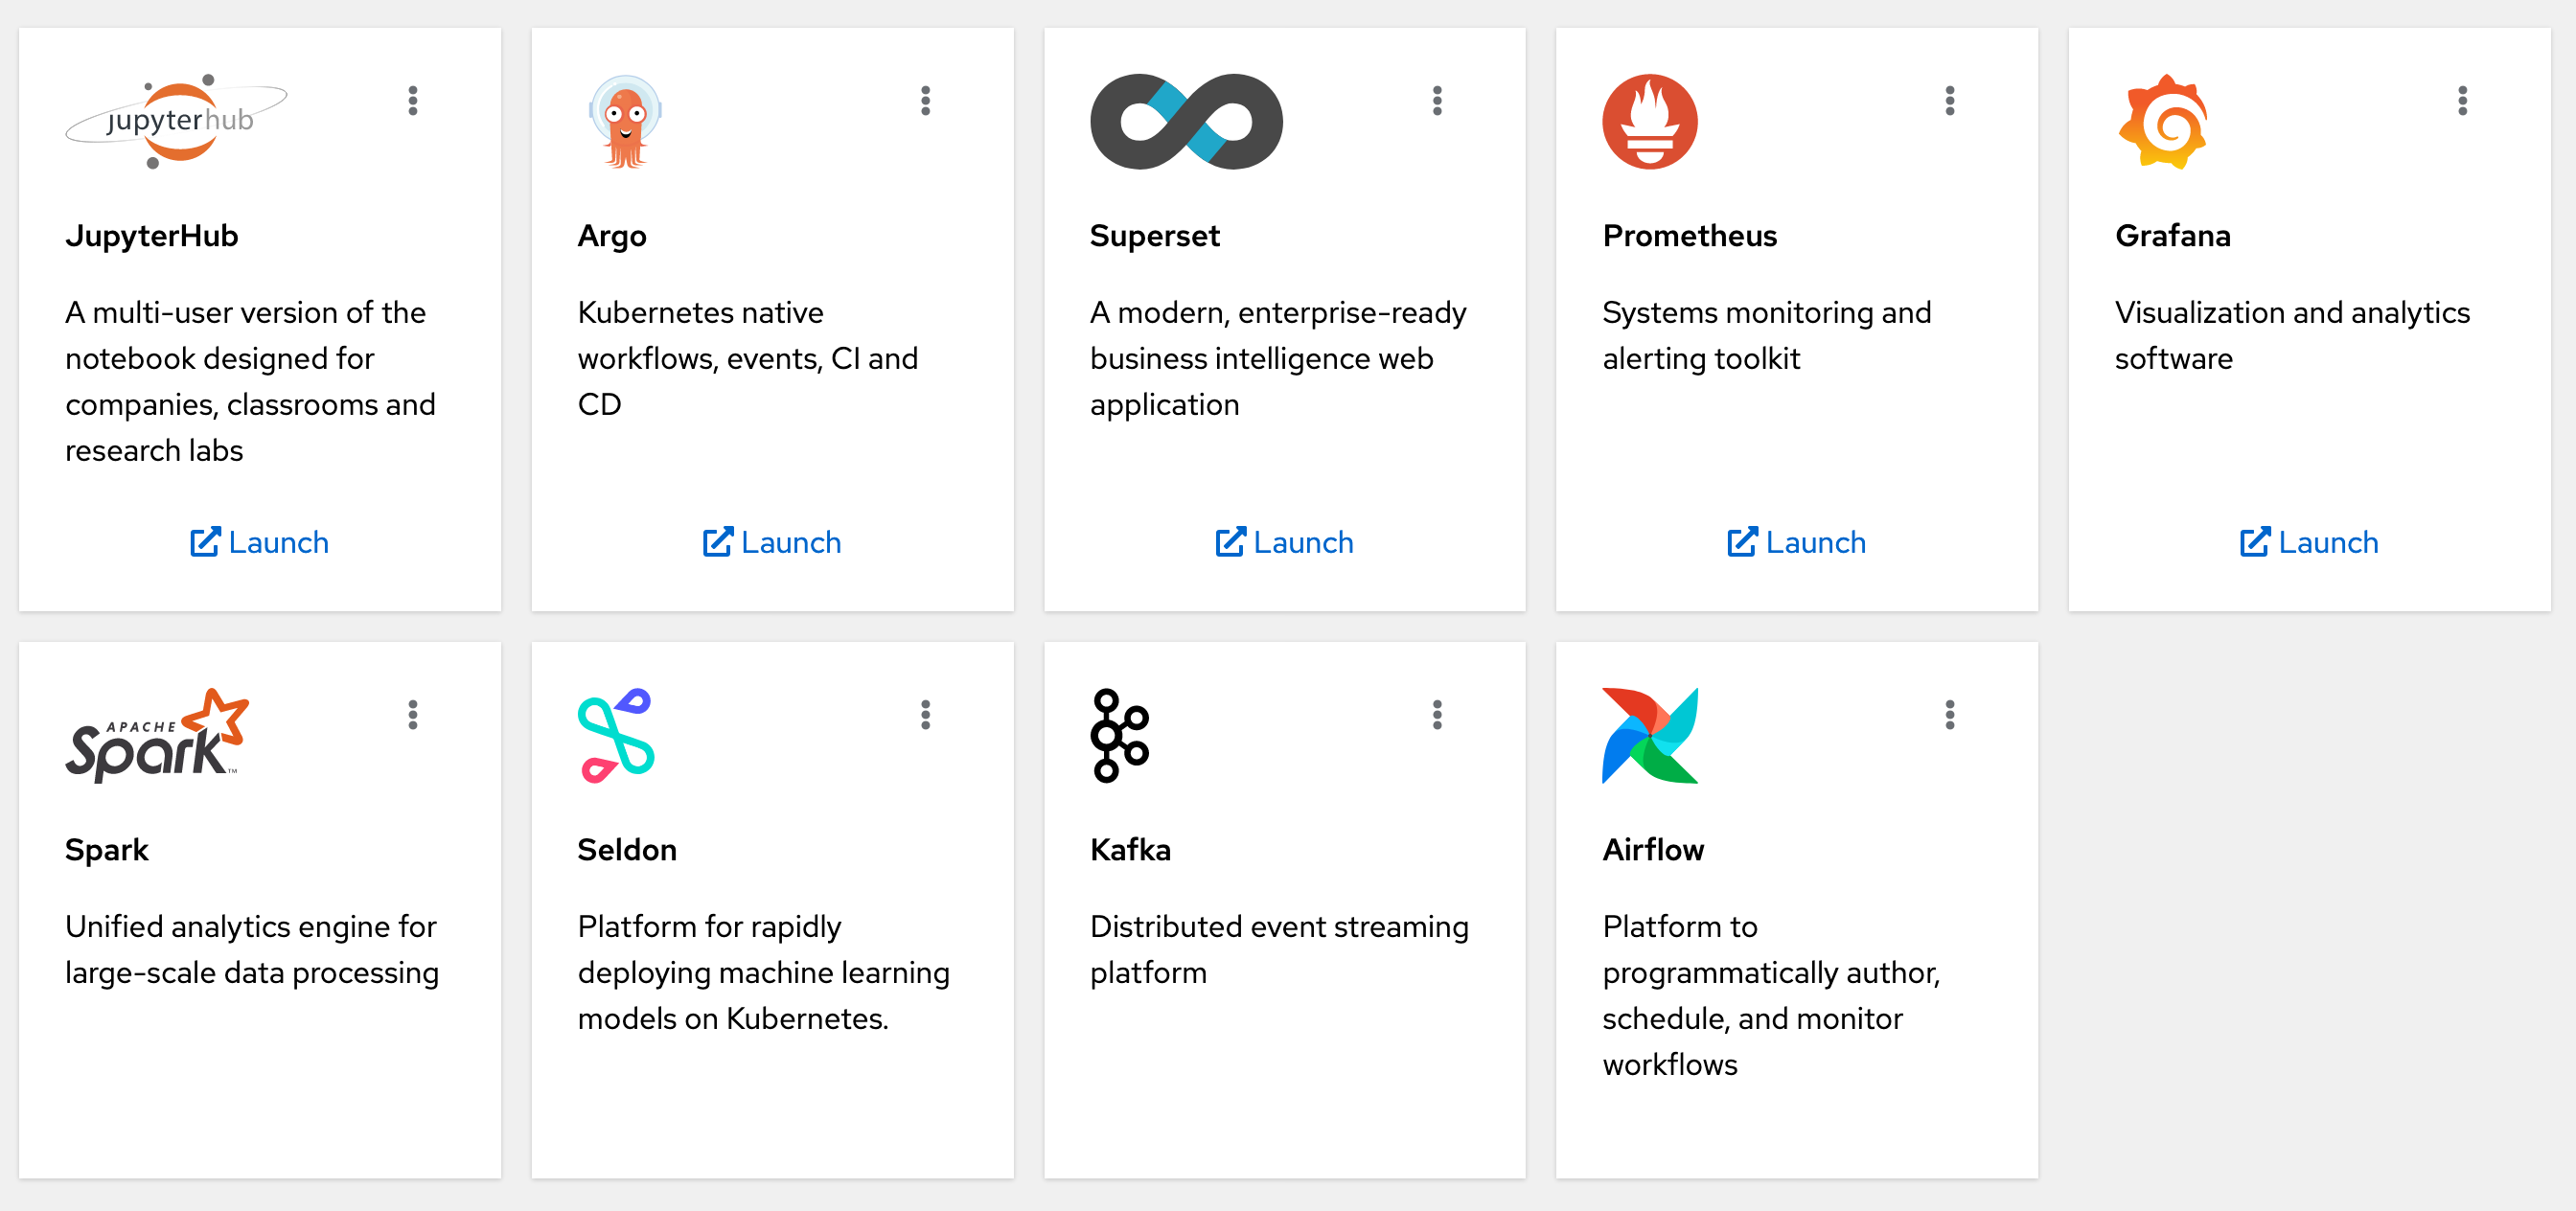
You can also view the ODH components you installed in the ODH dashboard. Grab the public route and open it in your browser.
echo $(oc get route odh-dashboard -n odh --template='http://{{.spec.host}}')
You should see:
Let's smoke test each component.
Launch JupyterHub from the ODH Dashboard. Alternatively, you can grab the public route and open it in your browser.
echo $(oc get route jupyterhub -n odh --template='http://{{.spec.host}}')
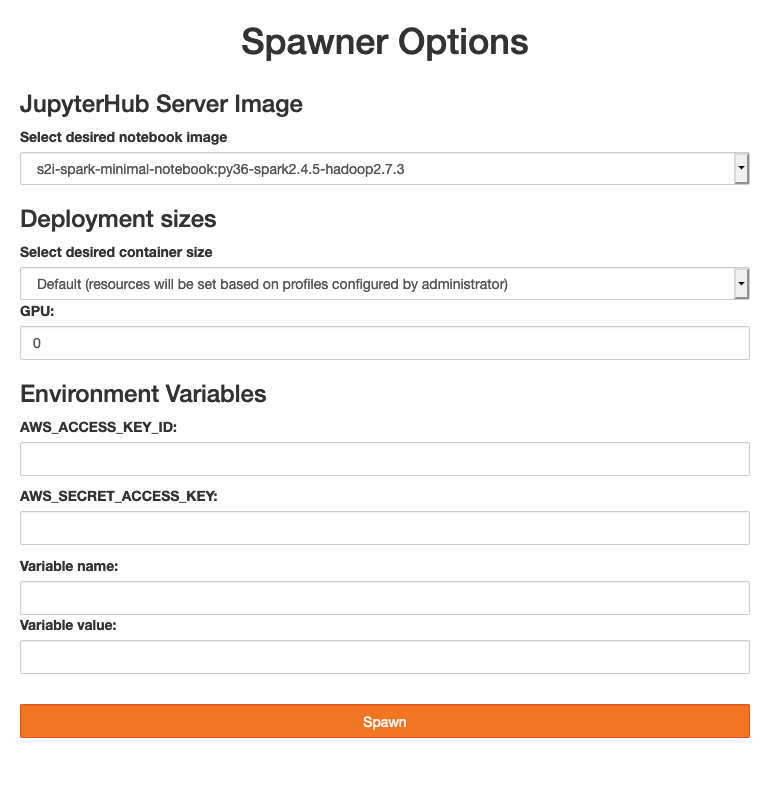
Select the s2i-spark-minimal-notebook image and spawn the server. Leave the other settings as they are.
Wait a few minutes for the server to start.
Try refreshing the browser if you don't see any progress after a couple minutes.
Start a Python 3 notebook:
In the JupyterHub notebook, let's run a simple Spark application.
Copy this code and execute
from pyspark.sql import SparkSession, SQLContext
import os

# create a spark session
spark_cluster_url = f"spark://{os.environ['SPARK_CLUSTER']}:7077"
spark = SparkSession.builder.master(spark_cluster_url).getOrCreate()

# run a sample computation on the spark cluster
data = [1, 2, 3, 4, 5]
distData = spark.sparkContext.parallelize(data)
distData.reduce(lambda a, b: a + b)
Output
15
Let's test Seldon Core with a pre-packaged model.
Deploy a pre-packaged model
oc apply -f - << END
apiVersion: machinelearning.seldon.io/v1
kind: SeldonDeployment
metadata:
  name: iris-model
spec:
  name: iris
  predictors:
  - graph:
      implementation: SKLEARN_SERVER
      modelUri: gs://seldon-models/sklearn/iris
      name: classifier
    name: default
    replicas: 1
END
Wait until the model is ready
oc wait --for=condition=Available deploy/iris-model-default-0-classifierExpose the model with a public route
oc expose svc iris-model-defaultSend a sample request
MODEL_URL=$(oc get route iris-model-default --template='http://{{.spec.host}}')
curl -X POST $MODEL_URL/api/v1.0/predictions \
    -H 'Content-Type: application/json' \
    -d '{ "data": { "ndarray": [[1,2,3,4]] } }'
Output (sample)
{
    "data": {
        "names": [
            "t:0",
            "t:1",
            "t:2"
        ],
        "ndarray": [
            [
                0.0006985194531162841,
                0.003668039039435755,
                0.9956334415074478
            ]
        ]
    },
    "meta": {}
}
Test Argo with a sample workflow.
Create a workflow role
oc create -f - << END
apiVersion: rbac.authorization.k8s.io/v1
kind: ClusterRole
metadata:
  name: workflow-role
rules:
# pod get/watch is used to identify the container IDs of the current pod
# pod patch is used to annotate the step's outputs back to controller (e.g. artifact location)
- apiGroups:
  - ""
  resources:
  - pods
  verbs:
  - get
  - watch
  - patch
# logs get/watch are used to get the pods logs for script outputs, and for log archival
- apiGroups:
  - ""
  resources:
  - pods/log
  verbs:
  - get
  - watch
END
Bind the role to the default service account
oc adm policy add-role-to-user workflow-role -z default -n odhCreate the workflow
oc create -f https://raw.githubusercontent.com/argoproj/argo/master/examples/hello-world.yamlLook at the workflow
oc get workflow
Output (sample)
NAME                STATUS      AGE
hello-world-tx4mk   Succeeded   34s
You can also navigate to the Argo UI.
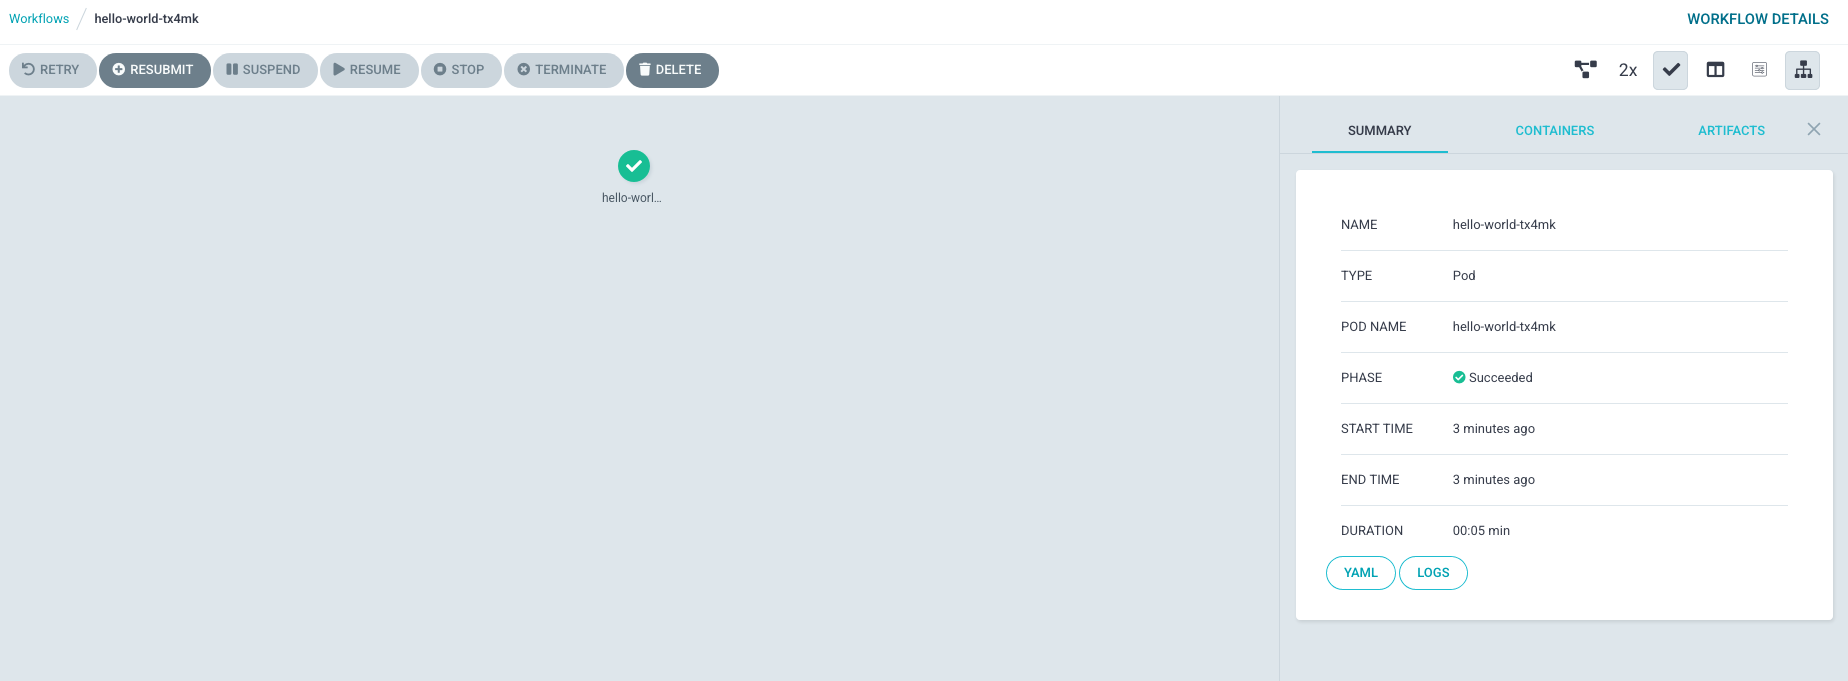
echo $(oc get route argo-portal -n odh --template='http://{{.spec.host}}')Click on the hello world workflow and the green checkmark. You will see:
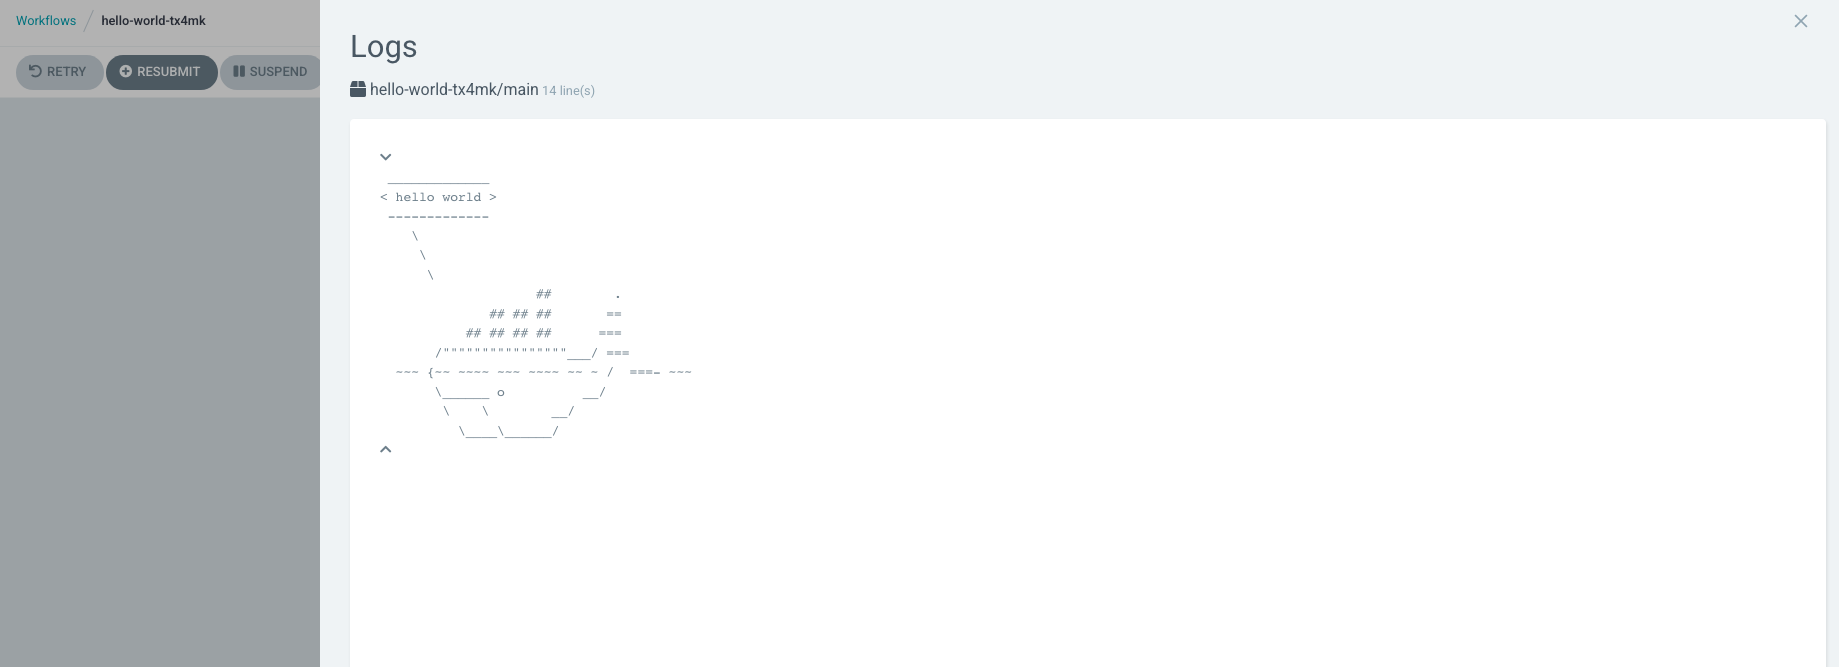
You can also view the logs to see the hello world whale:
Follow these steps to test Superset with PostgreSQL.
Let's add alert rules for our Kafka cluster.
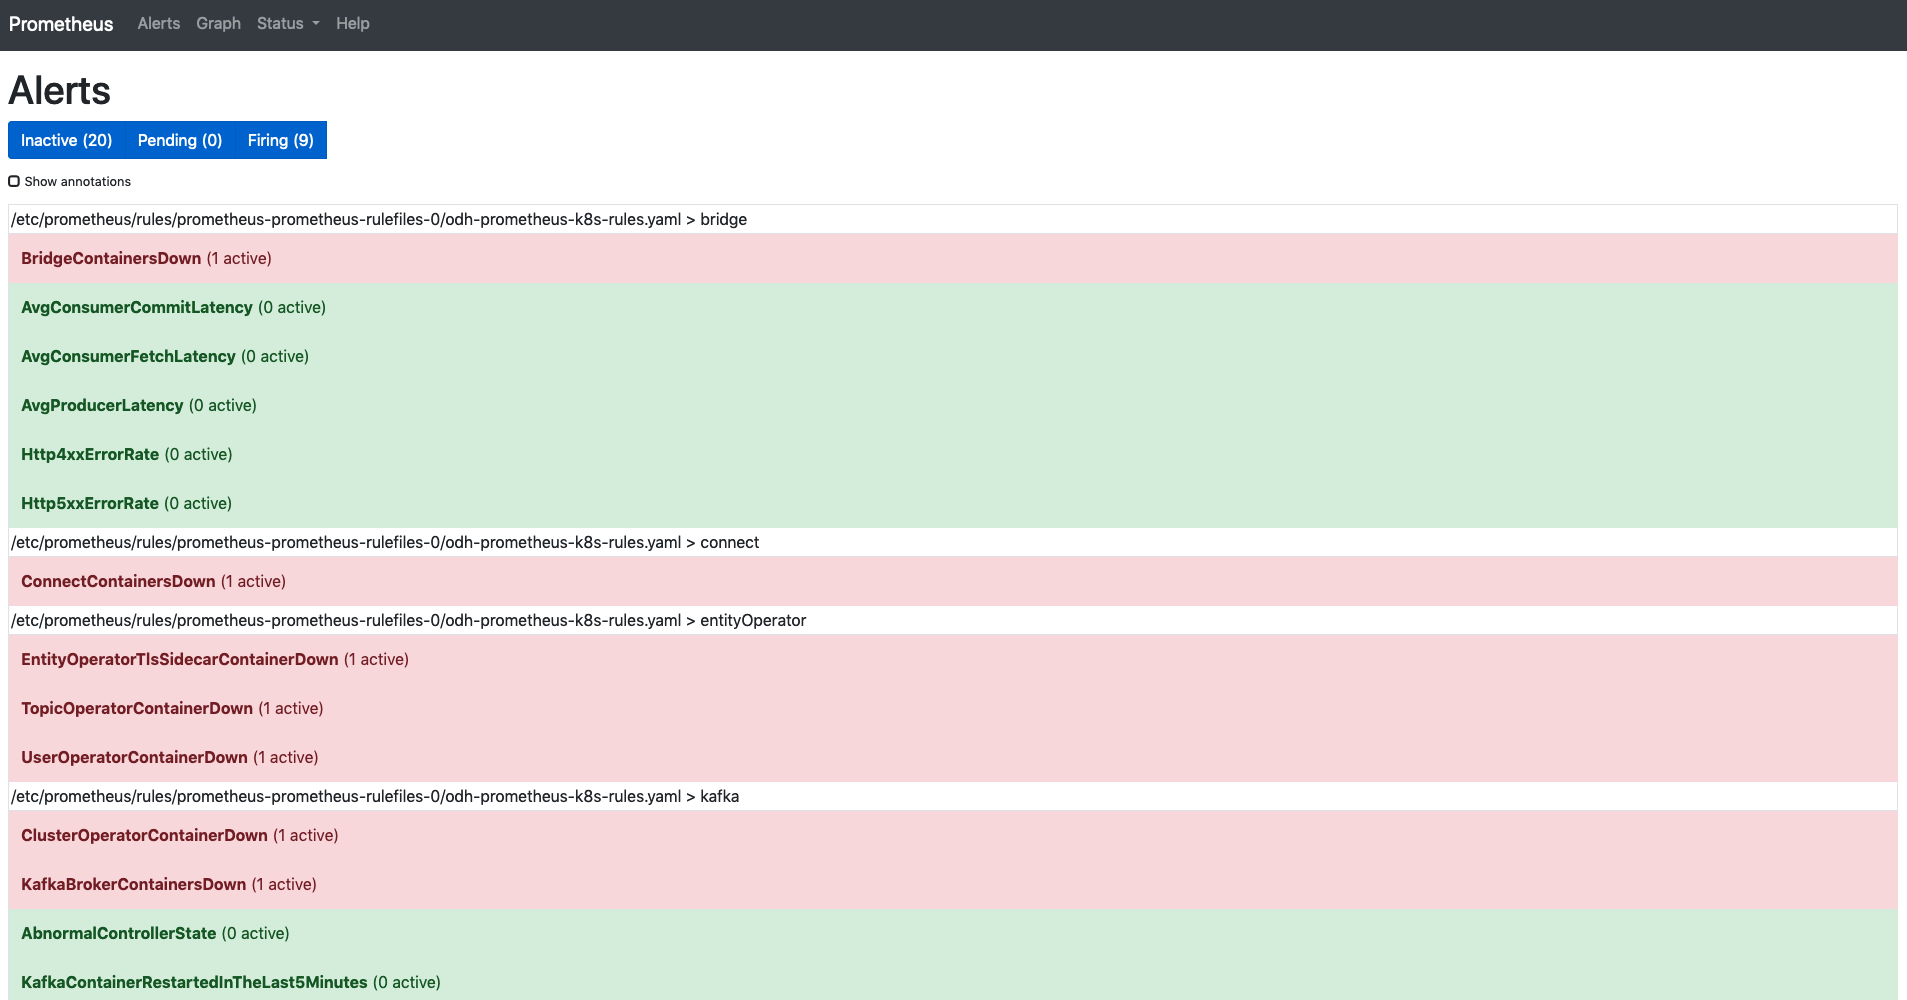
oc create -f https://raw.githubusercontent.com/strimzi/strimzi-kafka-operator/master/examples/metrics/prometheus-install/prometheus-rules.yamlLaunch Prometheus from the ODH Dashboard. Alternatively, you can grab the public route and open it in your browser.
echo $(oc get route prometheus-portal -n odh --template='http://{{.spec.host}}')
Navigate to Alerts at the top. You should see your new alert rules.
Launch Grafana from the ODH Dashboard. Alternatively, you can grab the public route and open it in your browser.
echo $(oc get route grafana-route -n odh --template='https://{{.spec.host}}')
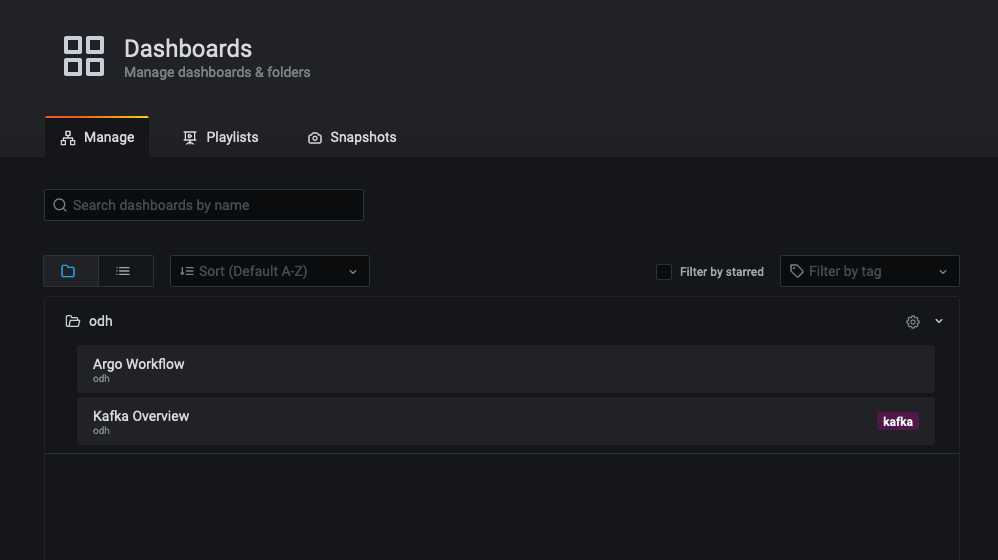
Click the square icon on the left to see Dashboards and select Manage.
Open the odh folder and you should see two dashboards:
Open Kafka Overview and you should see information about your Kafka cluster.
Create a sample topic in the ODH Kafka cluster
oc create -f - << END
apiVersion: kafka.strimzi.io/v1beta1
kind: KafkaTopic
metadata:
  name: odh-topic
  labels:
    strimzi.io/cluster: odh-message-bus
spec:
  partitions: 3
  replicas: 3
END
Start a Kafka consumer
oc run kafka-consumer -ti --image=registry.redhat.io/amq7/amq-streams-kafka-25-rhel7:1.5.0 --rm=true --restart=Never -- bin/kafka-console-consumer.sh --bootstrap-server odh-message-bus-kafka-bootstrap:9092 --topic odh-topic --from-beginning
In another terminal, start a Kafka producer
oc run kafka-producer -ti --image=registry.redhat.io/amq7/amq-streams-kafka-25-rhel7:1.5.0 --rm=true --restart=Never -- bin/kafka-console-producer.sh --broker-list odh-message-bus-kafka-bootstrap:9092 --topic odh-topic
Send messages through the Kafka producer. The messages should show up in the consumer terminal.
Create Airflow stateful component
oc create -f https://raw.githubusercontent.com/opendatahub-io/airflow-on-k8s-operator/openshift/hack/sample/postgres-celery/base.yaml
Wait until the base component is ready
oc get statefulset/pc-base-postgres
Create Airflow cluster
oc create -f https://raw.githubusercontent.com/opendatahub-io/airflow-on-k8s-operator/openshift/hack/sample/postgres-celery/cluster.yaml
Open the route to Airflow in your browser
echo $(oc get route pc-cluster-airflowui --template='http://{{.spec.host}}')
Trigger the tutorial DAG and you should see the tasks transition to success over time:
- If you delete the ODH operator and need to reinstall again, you have to manually delete the old operator group. Otherwise the next install will move into a stuck
Pendingstate.
oc delete operatorgroup opendatahub -n openshift-operators
- If you run the sample Argo workflow without binding the workflow role, you will get this error (see issue).
failed to save outputs: Failed to establish pod watch: unknown (get pods)
