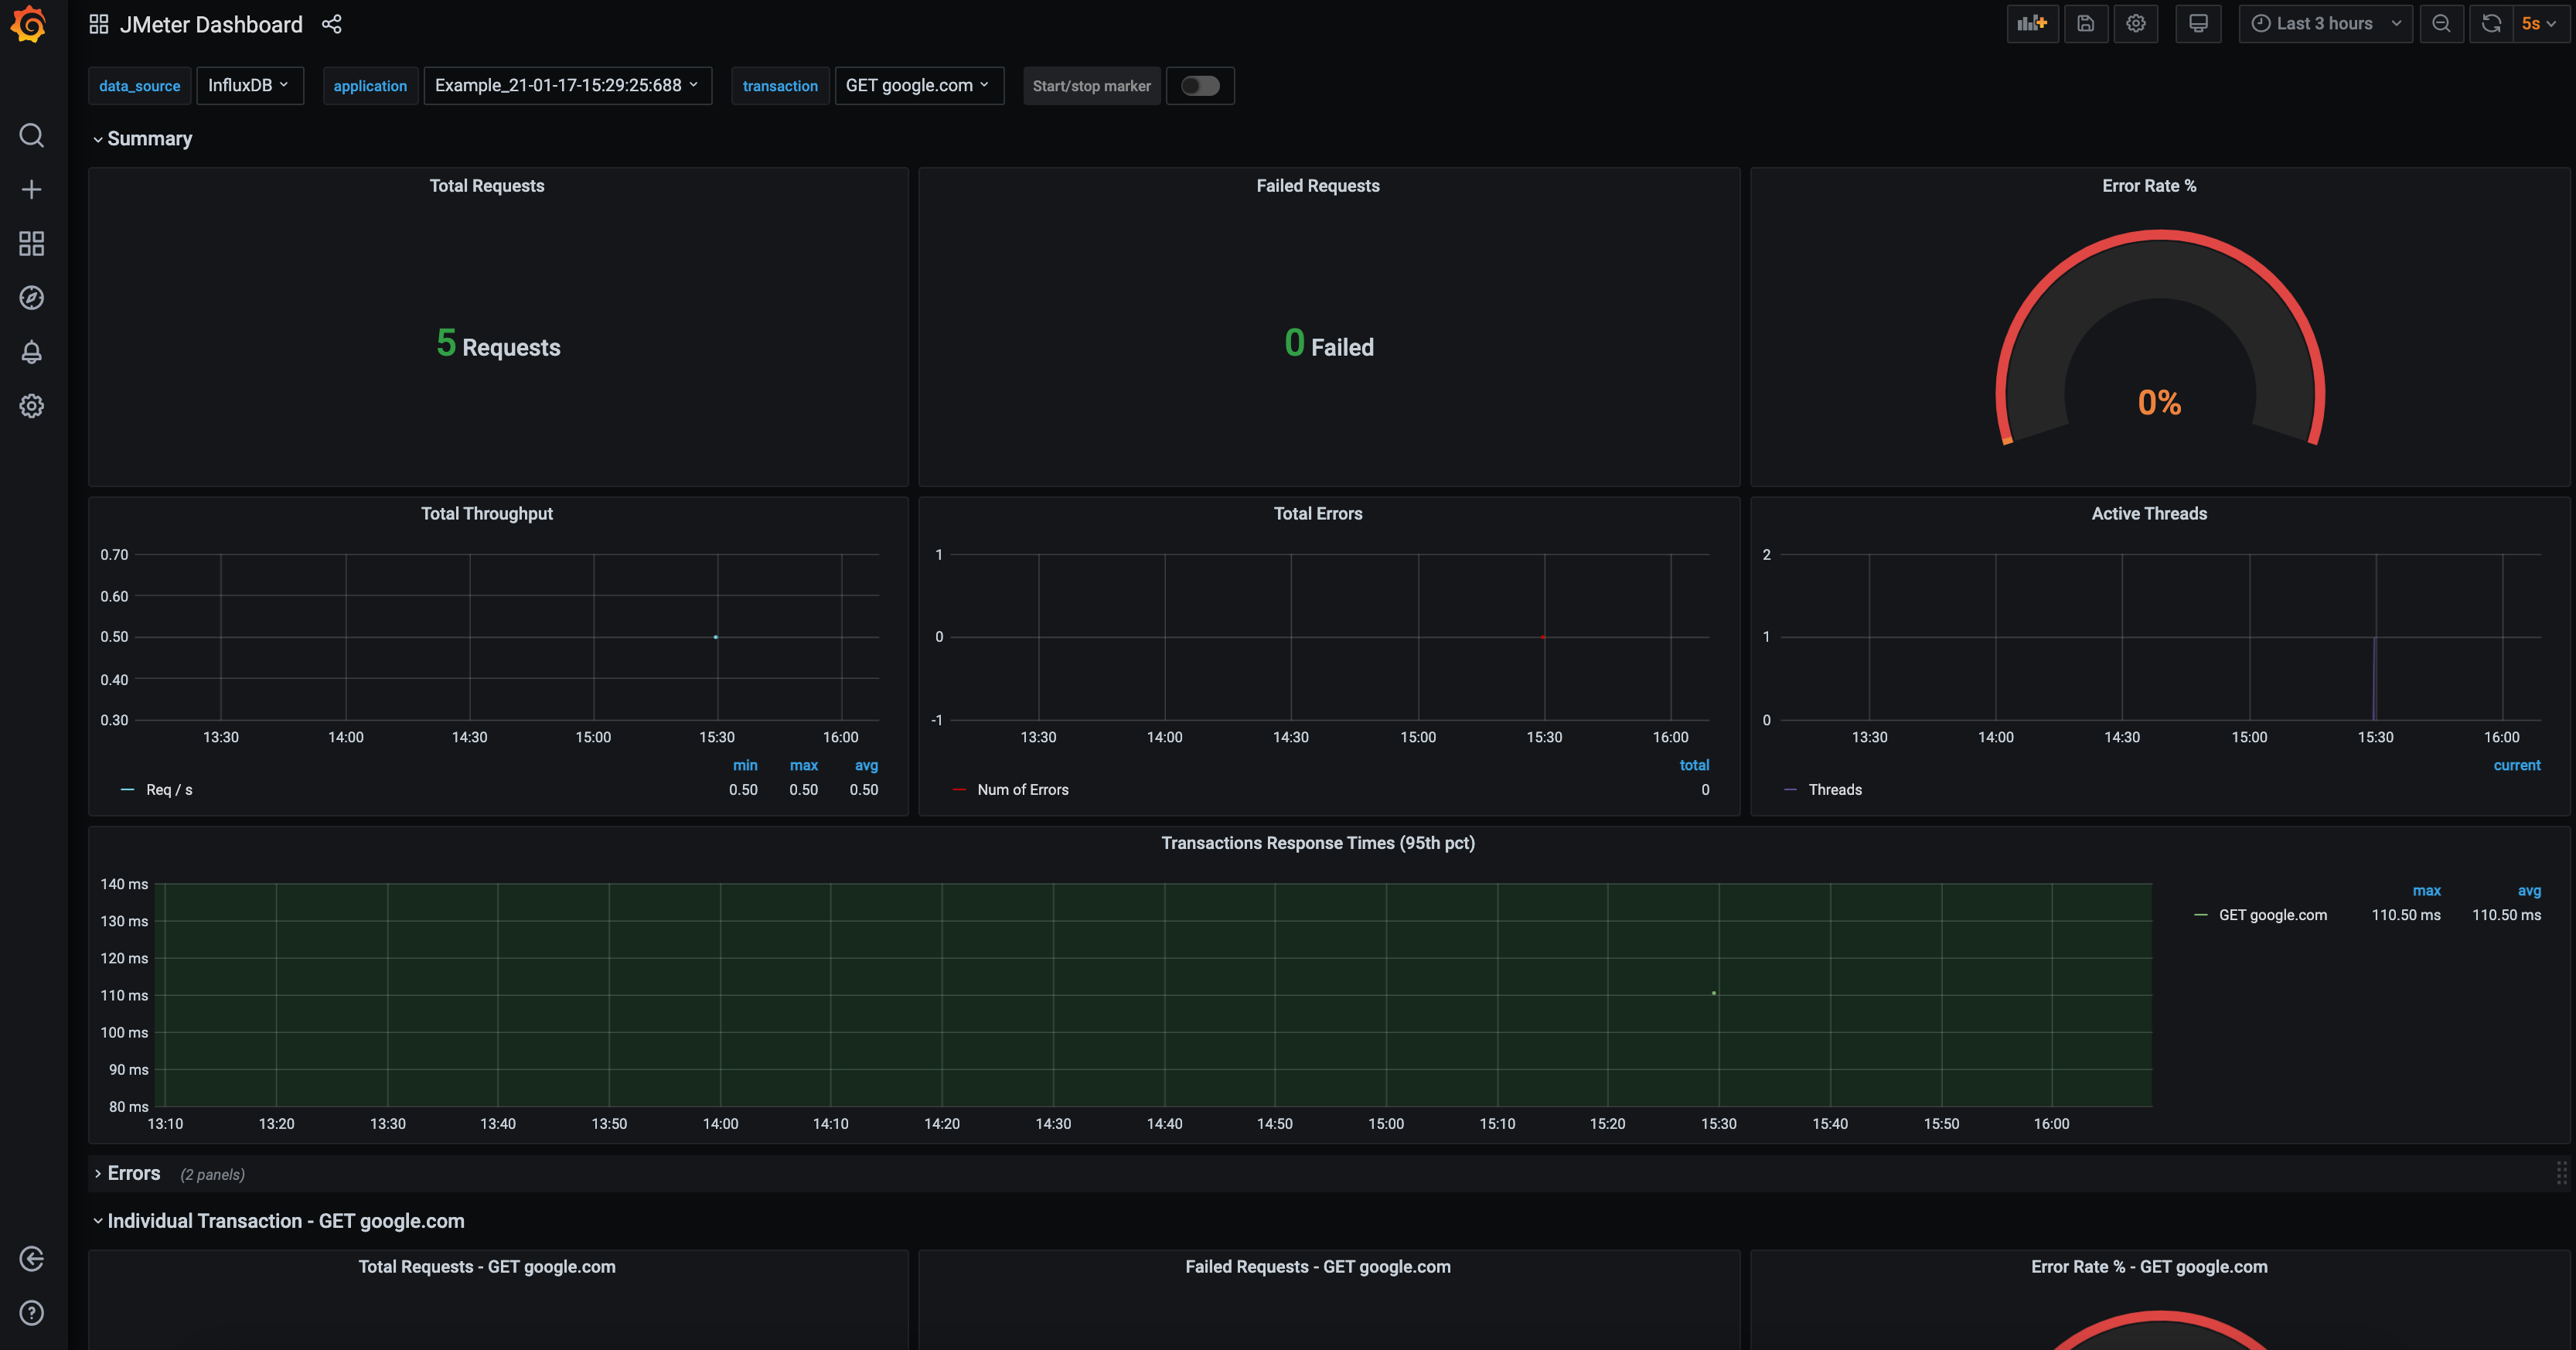
This is a container setup that allows you to immediately synchronize JMeter results with InfluxDB and visualize what is happening in realtime.
Ensure both docker and docker-compose are installed.
docker build -t jmeter jmeter-docker
docker-compose up -d
Define 2 variables on the Test Plan component.
| Name | Value |
|---|---|
| CLIENTNAME | Example |
| STARTDATETIME | ${__time(yy-MM-dd-HH:mm:ss:SSS)} |
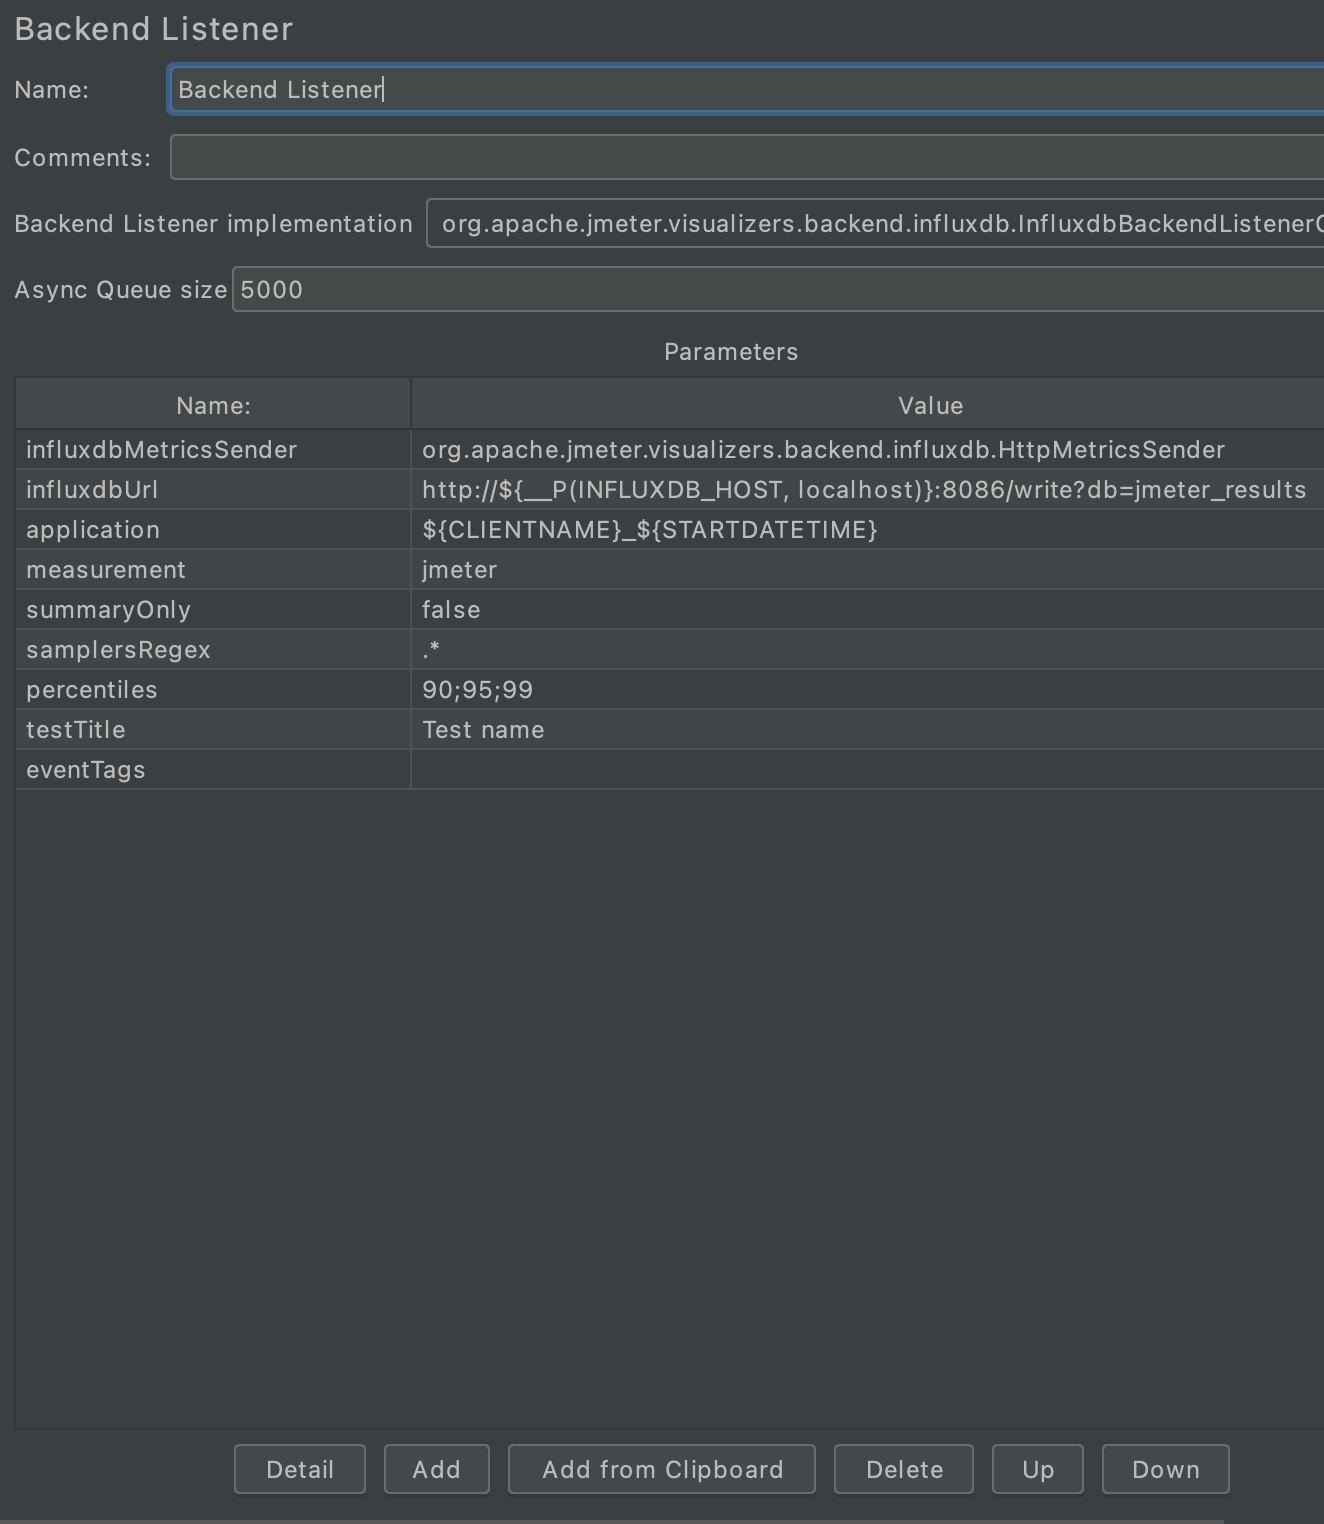
Add & configure the Backend Listener in Jmeter.
| Name | Value |
|---|---|
| influxdbMetricsSender | org.apache.jmeter.visualizers.backend.influxdb.HttpMetricsSender |
| influxdbUrl | http://${__P(INFLUXDB_HOST, localhost)}:8086/write?db=jmeter_results |
| application | ${CLIENTNAME}_${STARTDATETIME} |
| measurement | jmeter |
| summaryOnly | false |
| samplersRegex | .* |
| percentiles | 90;95;99 |
| testTitle | Test name |
| eventTags |
./run-specific-jmeter-script.sh example.jmx
It is the concatenation of CLIENTNAME and STARTDATETIME.
Inspired by https://www.blazemeter.com/blog/make-use-of-docker-with-jmeter-learn-how


