Latest COVID-19 Data updates (13-05-2020) : Current Trends and Forecasts
Introduction
The underlying data analysed here is open sourced and comes from the Humanitarian Data Exchange ( https://data.humdata.org/dataset/coronavirus-covid-19-cases-data-for-china-and-the-rest-of-the-world). The latest data on COVID-19 cases in New Zealand is sourced directly from announcements from the Ministry of Health on a daily basis (https://www.health.govt.nz/our-work/diseases-and-conditions/covid-19-novel-coronavirus/covid-19-current-cases ). The latest data is usually made available by early afternoon NZ time.
New Zealand is at a relatively early stage of the COVID-19 outbreak. The purpose of this resource is to draw insights from the data as the crisis unfolds and to make inferences as to what this might mean for NZ. Initially, the goal is to track the speed at which this disease has spread in some of the most affected countries, and to model this on to the NZ context.
Table of Contents
Speed of Spread
One of the key concerns is the speed at which the disease is spreading. We have seen in NZ an exponential growth in confirmed cases that have led to extraordinary nation-wide measures to contain or slow down the spread. Are these high increases in daily rates of those confirmed to have the virus likely to persist, and if not, how quickly are these rates likely to reduce?
The data shows that the speed of the spread in terms of what the percent of new confirmed COVID-19 cases is from one day to the next, changes in respect to the length of time a country has been battling the outbreak. The number of days it takes for a country to double its current number of confirmed COVID-19 cases is another way of looking at this phenomenon. Therefore, much of the data analysis here will consider what stage a country is at in terms of the length of time it has been fighting the outbreak.
Below is a figure which shows how many days a selection of countries have been dealing with this disease since they recorded a 40th confirmed COVID-19 case. The chosen countries are some of the hardest hit, and offer most insights in terms of highlighting trends. These countries are China, Spain, Italy, Iran, France, Germany, United Kingdom, South Korea, US, Australia, Sweden, Belgium, Turkey and Singapore. The graph sets 40 as the threshold, since the daily changes in percentages of new confirmed cases stabilises after this point.
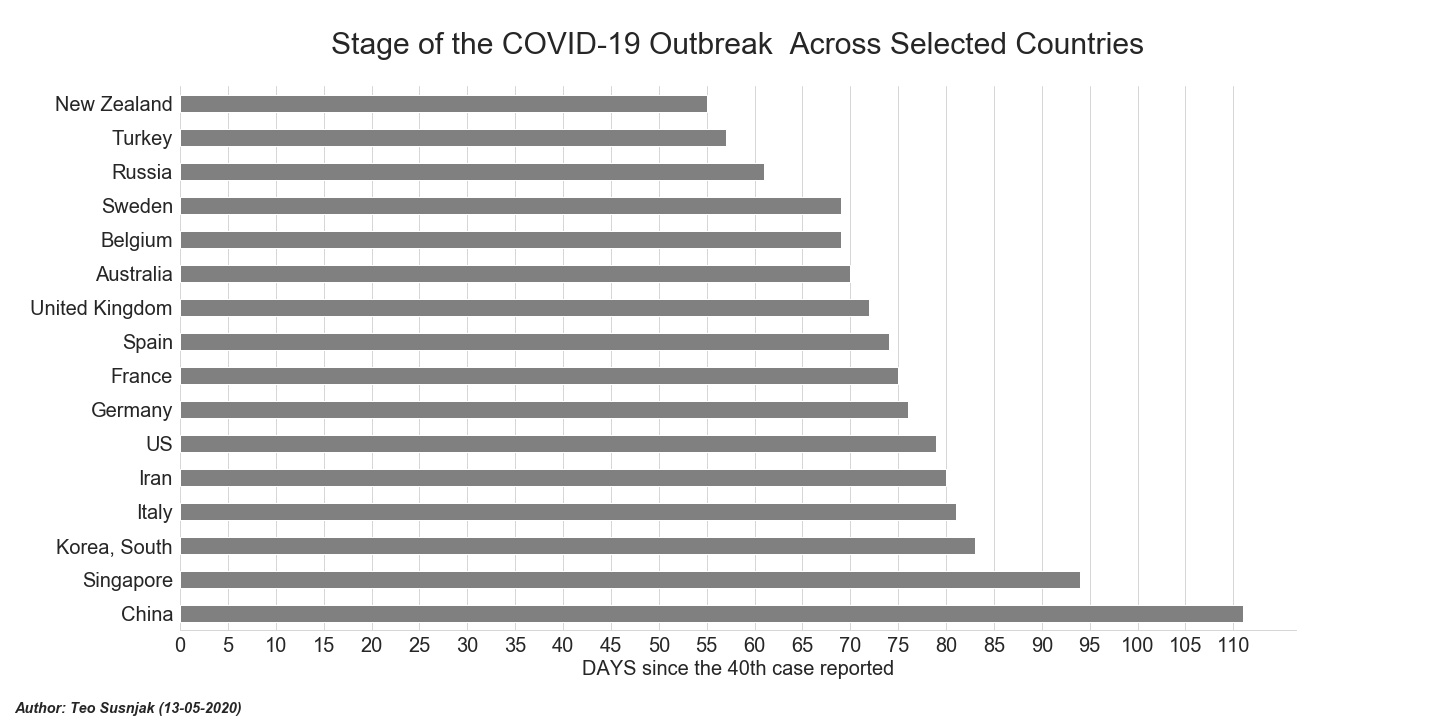
Relatively speaking, NZ is at an early stage of combating the outbreak. Trends from other countries which are further down the road, can illustrate what NZ could also expect in the near future and could also serve as examples to learn from.
The following figure plots the actual percentage change of new confirmed COVID-19 cases from one day to the next for all of the countries above. The rates for each country are smoothed using a rolling seven day mean.
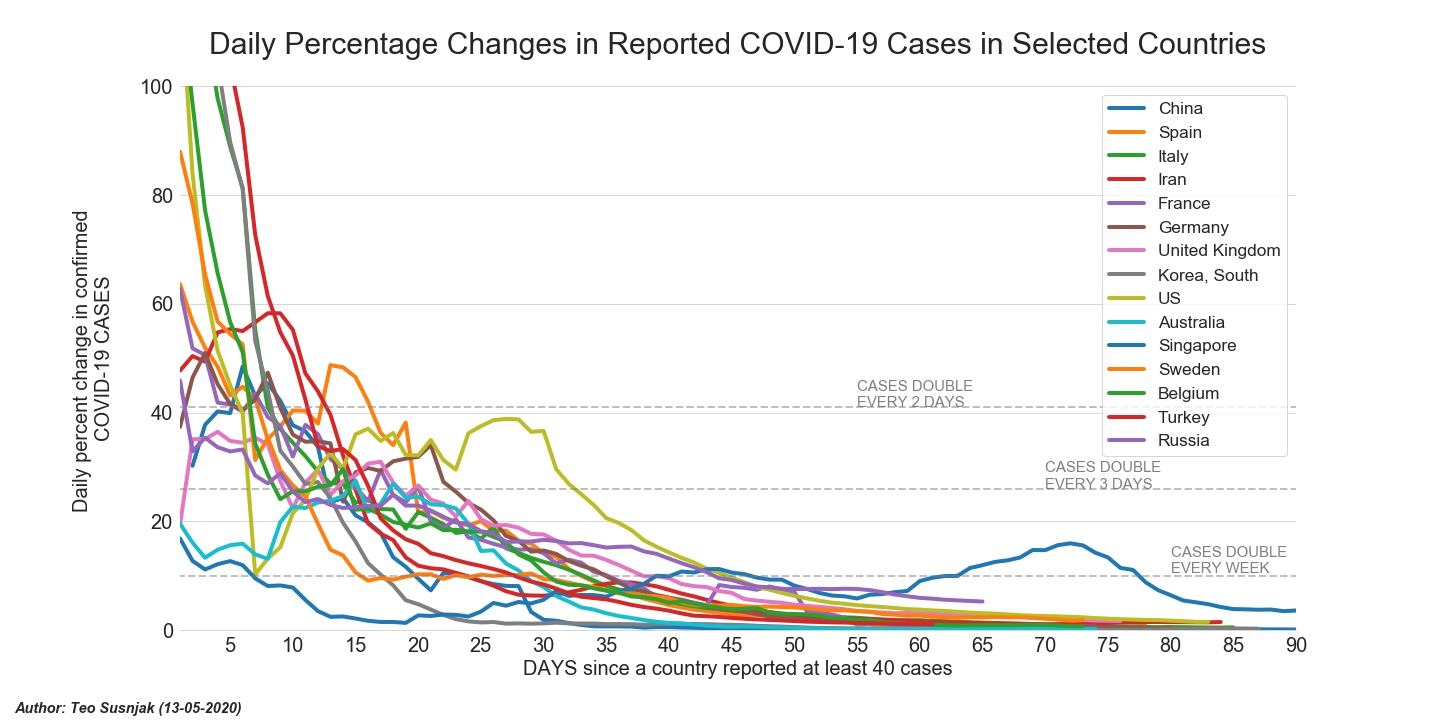
As time progresses, the graph shows a general slowdown in daily rates, though countries have, and are achieving this with different degrees of success. The most successful, such as China and South Korea, have managed to reduce the transmission rates to near zero, by day 30. Singapore succeeded in lowering the transmission rates earlier, but has recently started experiencing an increase. Other countries are exhibiting rates that are in high teens, or in the case of USA, high thirties for the same point in time.
Using the above approach, NZ experienced its Day 1 on March 20. The smoothed daily rates of change of confirmed COVID-19 cases for NZ can be seen in the graph below in black.
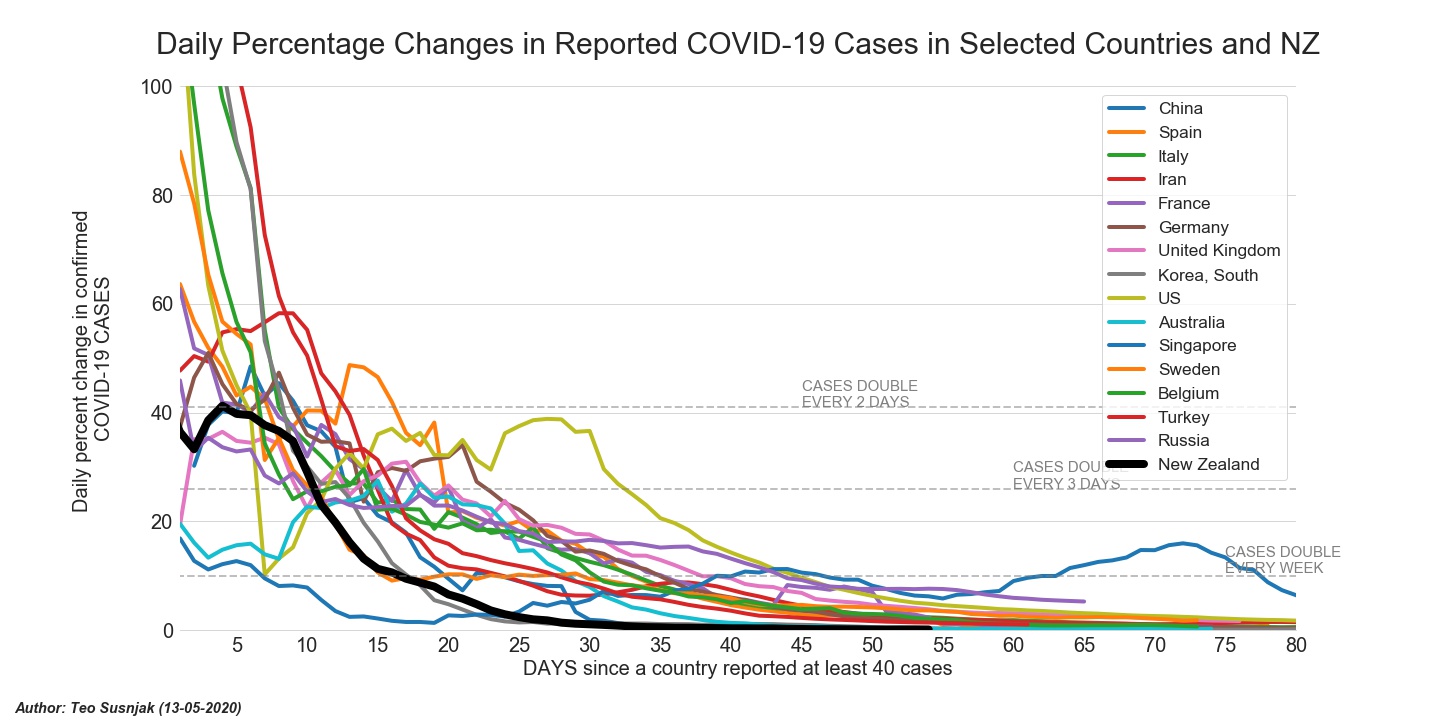
The high reported daily rates of confirmed COVID-19 cases for NZ are not out of step with what other countries have been experiencing at the same point in time. NZ went into a full national shutdown from midnight 25 March. The effects of this mandatory national isolation should become visible in the data between days 10 and 20 due to the incubation and testing time lags. It will be interesting to monitor the trends to see if NZ follows the rates observed in South Korea and Singapore.
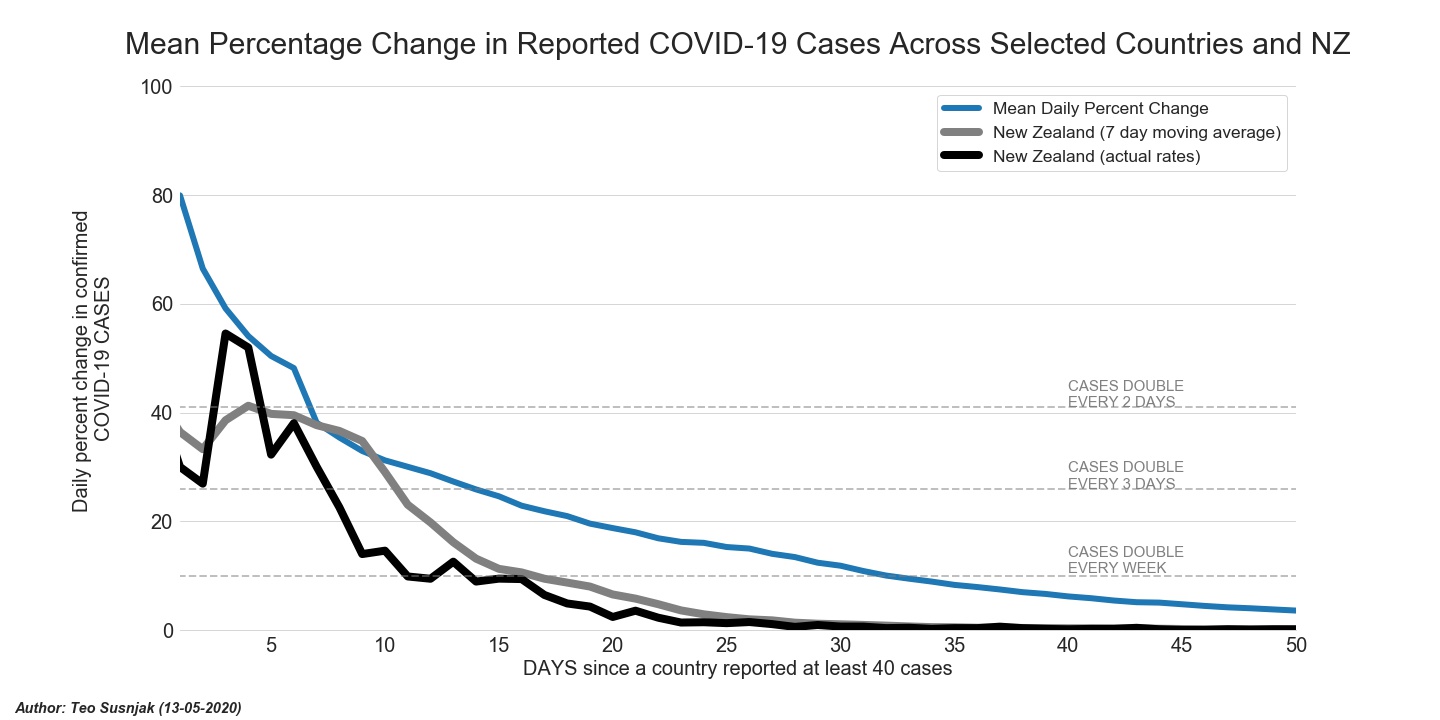
Given the trends from data on other countries which are ahead of NZ, it is possible to apply them to NZ and to simulate what the overall numbers in new confirmed COVID-19 cases might look like over the next 4 weeks. One simplistic approach is to aggregate the daily rates of newly confirmed COVID-19 cases across the countries in the above graphs, and to apply this to NZ. The figure below show the mean rate of daily confirmed COVID-19 cases across these countries, together with that of NZ. The figure depicts both the 7-day rolling mean as well as the actual daily percentages for NZ.
Modeling the Spread
Scenario 1 (Aggregate Trends Across Selected Countries)
If we were to assume that the rate of new confirmed COVID-19 cases in NZ will resemble the mean daily increases across the countries mentioned depicted in the above graphs, we could expect to see the trend in the graph below over the next four weeks.
The graph shows a possible rapid increase in the number of new confirmed cases starting in two weeks time, with a slowdown occurring by week four. This model is based on the assumption that the trends in NZ will resemble other countries who were at same stages of the outbreak. However, the above model does not take into account the fact that NZ is now in a full lock-down and how this might diverge from trends exhibited by other countries, who did not enforce national lock-downs at such early stages.
If we sum up all the the new daily confirmed COVID-19 cases in NZ, we can see how this translates to the forecasted total number of cases over the next four week in the graph below.
Hospitalisations and Intensive Care (under Scenario 1)
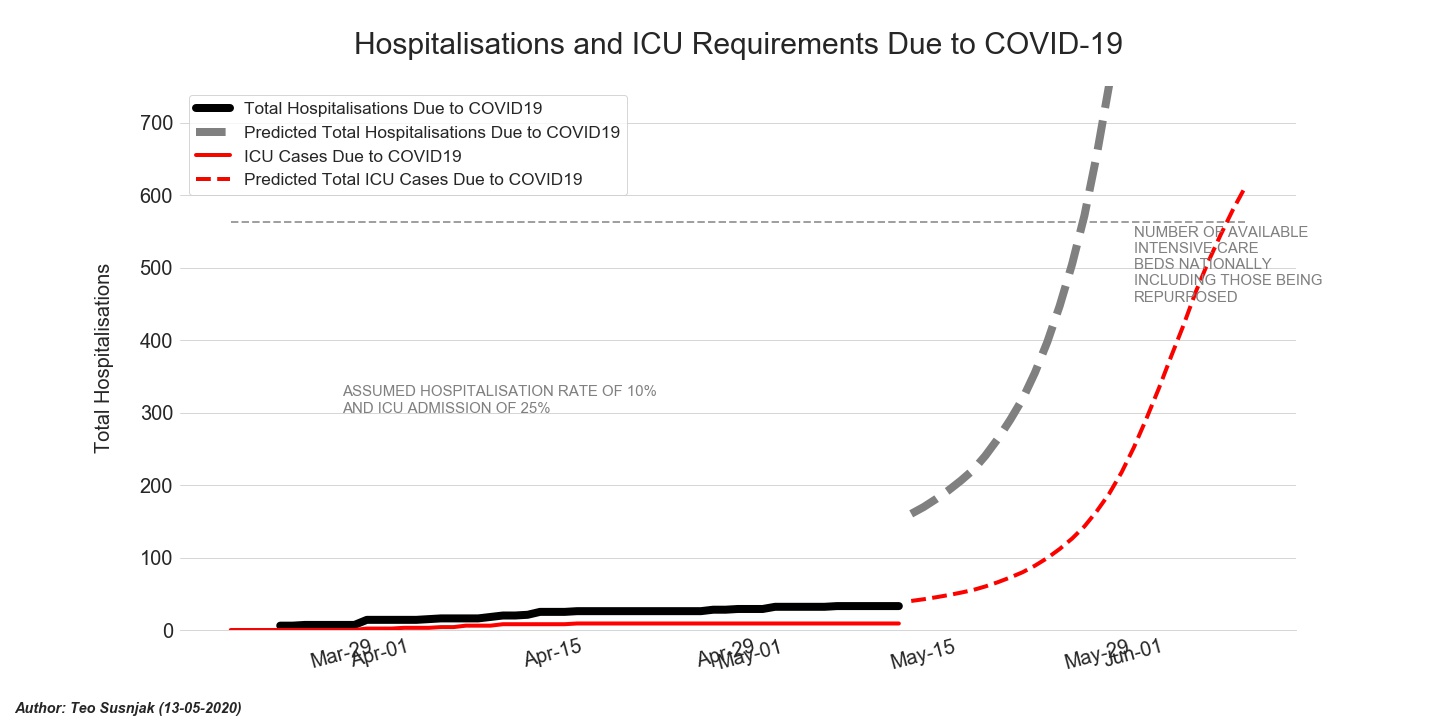
It is difficult to estimate exactly what the hospitalisation rates are for COVID-19 cases. The rates vary from one country to the next and are influenced by a number of factors. A crude and a possibly conservative estimate is that 10% of those confirmed with COVID-19, will seek hospitalisation. Again, rates for those requiring admission to intensive care units (ICU) is also variable, but 25% has been reported by several sourced.
Modeling these rates onto the forecasted COVID-19 cases in NZ, produces the graph below. The graph illustrates the current national inventory of ICUs which has been boosted to 563. This number includes beds and units that are currently being converted to be able to support severe COVID-19 patients.
Scenario 2 (Singaporean Trends)
The trends for NZ are beginning to diverge quite strongly from the mean rates of new confirmed COVID-19 cases from selected countries that were modeled in scenario 1. Recent trends (as of late March) in the rate of new confirmed COVID-19 cases in NZ have seen a significant downturn from earlier patterns. Although the earlier trends for NZ have been quite different to Singapore, by day 11, the rates of the two countries have converged as seen in the figure below.
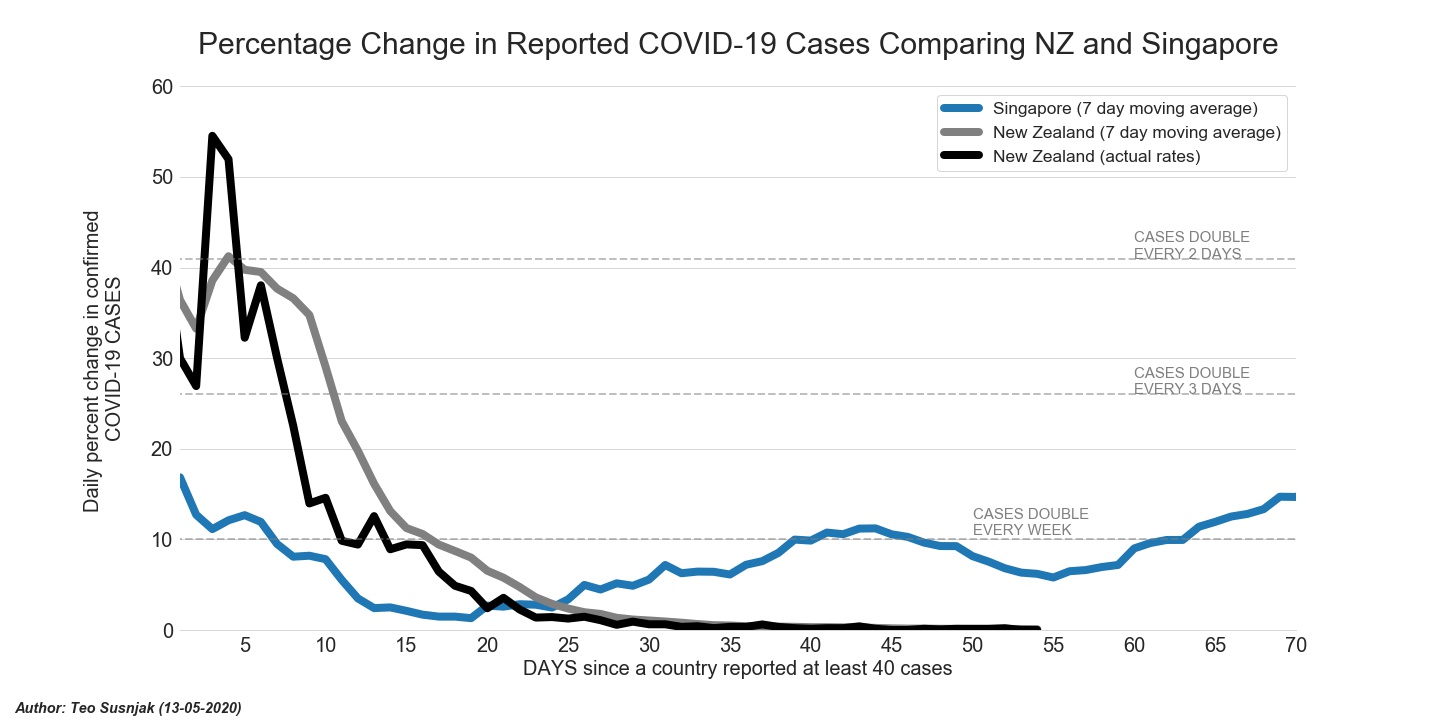
The rate of new cases for Singapore presents a very optimistic possible scenario for NZ. The next set of graphs seek to simulate what might be in store for NZ if Singapore's trends were to be realised here.
The graph below shows the number of new daily confirmed COVID-19 cases that are forecasted if Singapore's experience holds within the NZ context. At the same stage of the outbreak as we find ourselves now, Singapore observed a slowdown in new confirmed cases over the next two weeks with a subsequent increase from week 3.

By summing up all the new daily confirmed COVID-19 cases in NZ, we can see the total number of predicted cases over the next four weeks in the graph below.
The forecasts under scenario 2 stand in stark contrast to those of scenario 1 and illustrate a much more positive outlook.
Hospitalisations and Intensive Care (under Scenario 2)
The positive forecast models under scenario 2, also translate to hospitalisation rates and ICU needs for the next month that are well within the capacity of the NZ health system. The figure below illustrates these possible outcomes.
Scenario 3
Applying patterns from other countries to NZ relies on my assumptions holding, which is unlikely. As of writing, NZ appears to be on its own trajectory on new daily infection rates, rates of hospitalisation as well as ICU needs. What is more, NZ has up to this point experienced relatively low death rates attributed to COVID-19.
This final scenario considers only NZ trends, and applies them to the next four weeks. The next sets of models will daily update the 3 day rolling mean and project this four weeks ahead. The assumptions are that the conditions over any previous week will be the same in the subsequent four weeks. These assumptions will not hold for all important factors that influence infection, hospitalisation, ICU and death rates; however, these models will most likely match more underlying assumptions and have less bias than the models from the previous two simulated scenarios which involve different countries.
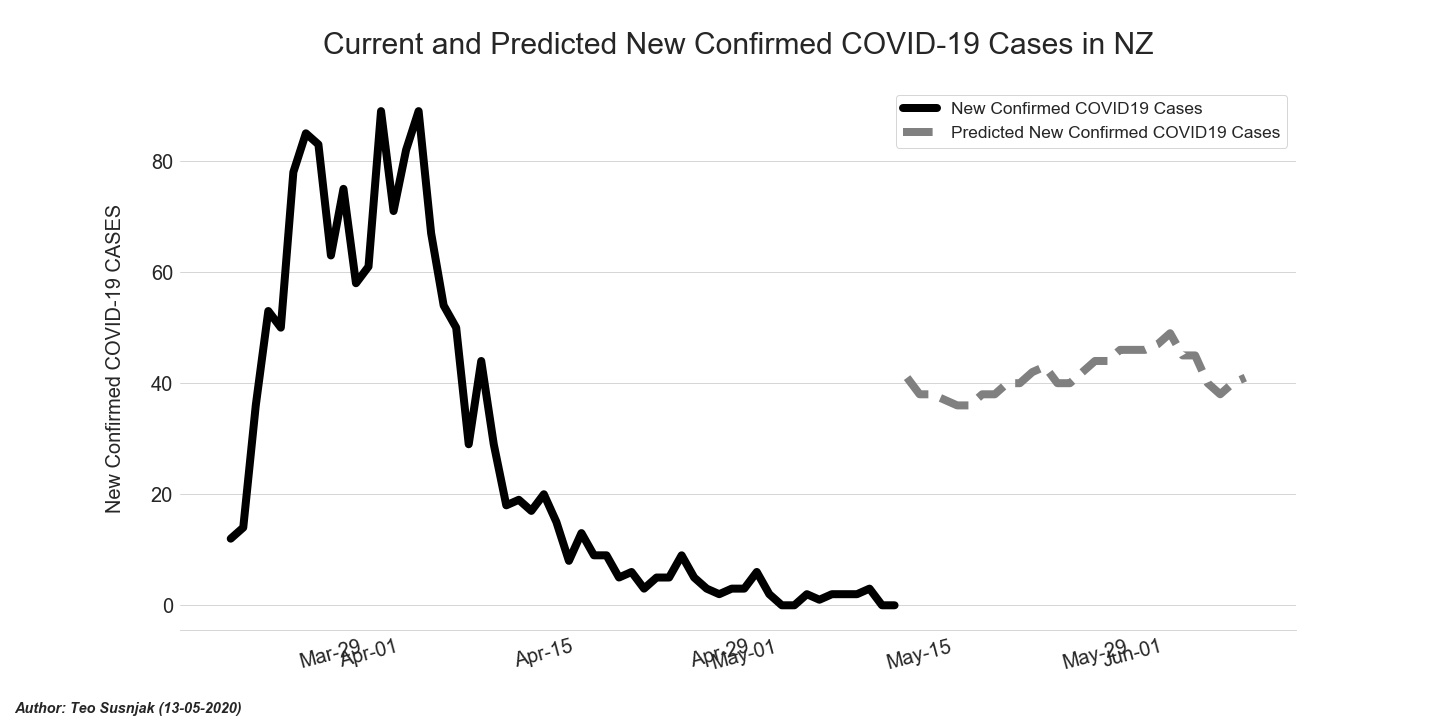
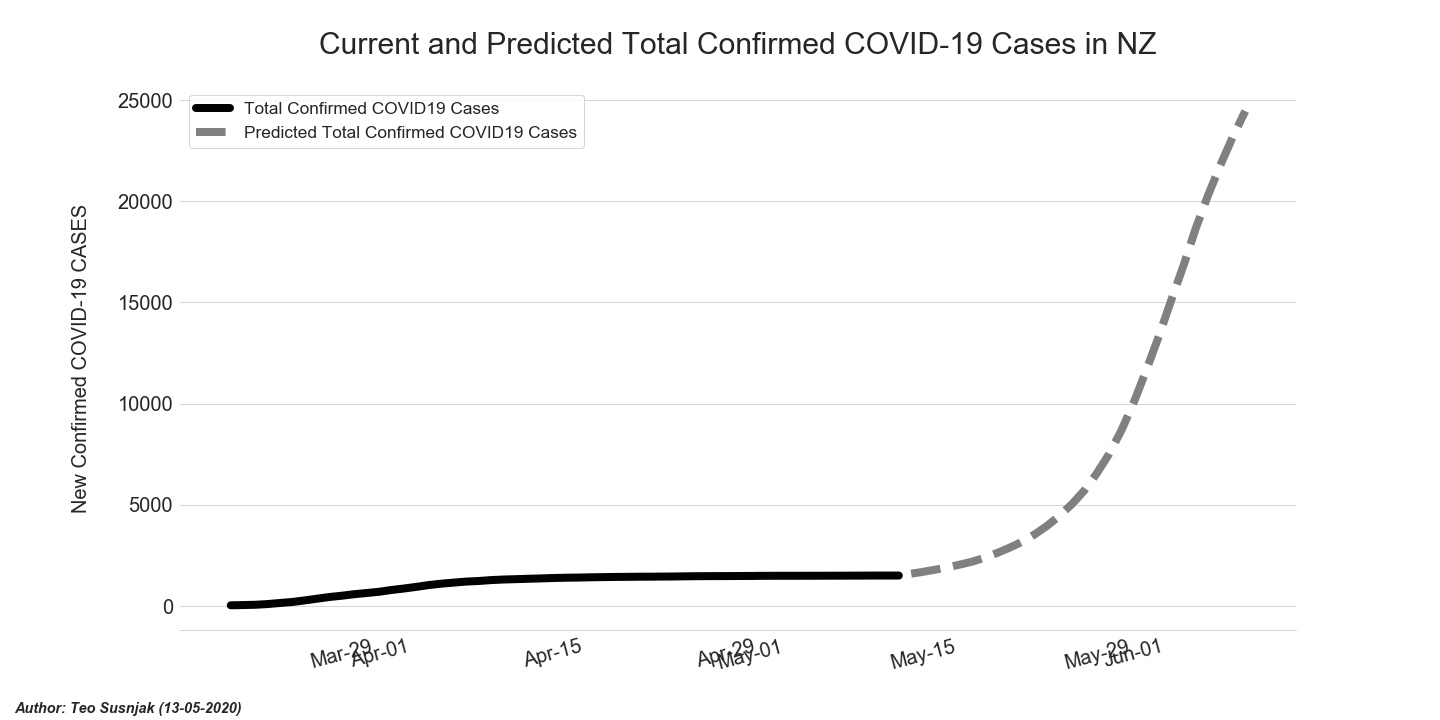
The graph below shows the forecasted new daily confirmed COVID-19 cases. The models still predict a very high number of daily cases that accelerate by week four; however, as more data comes in over the next couple of weeks which shows the effects of the national shutdown, these overall numbers will attenuate and correct over time.

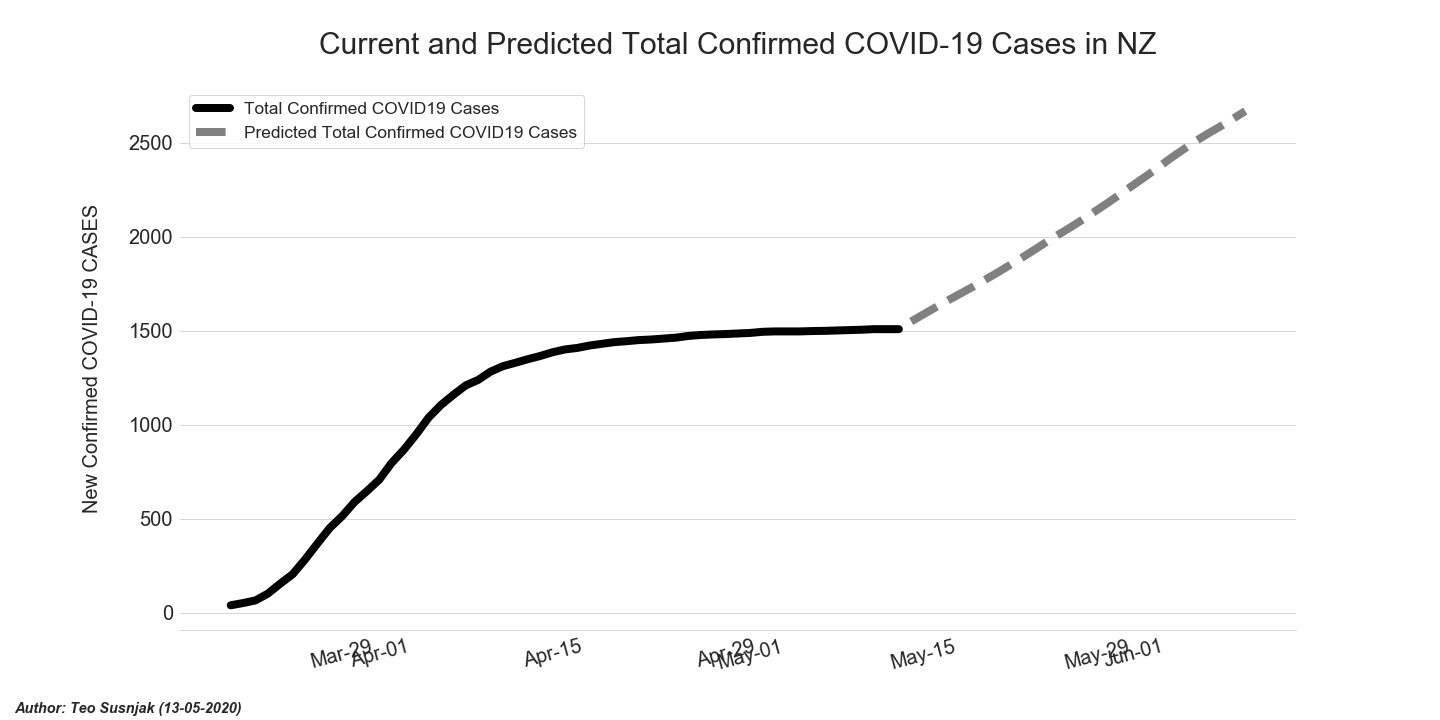
The numbers in the previous graph translate to total expected COVID-19 cases across NZ. As in the previous graph, this figure will also adjust over the coming days to the new infection rate data which captures the effects of social isolation currently in force in NZ.
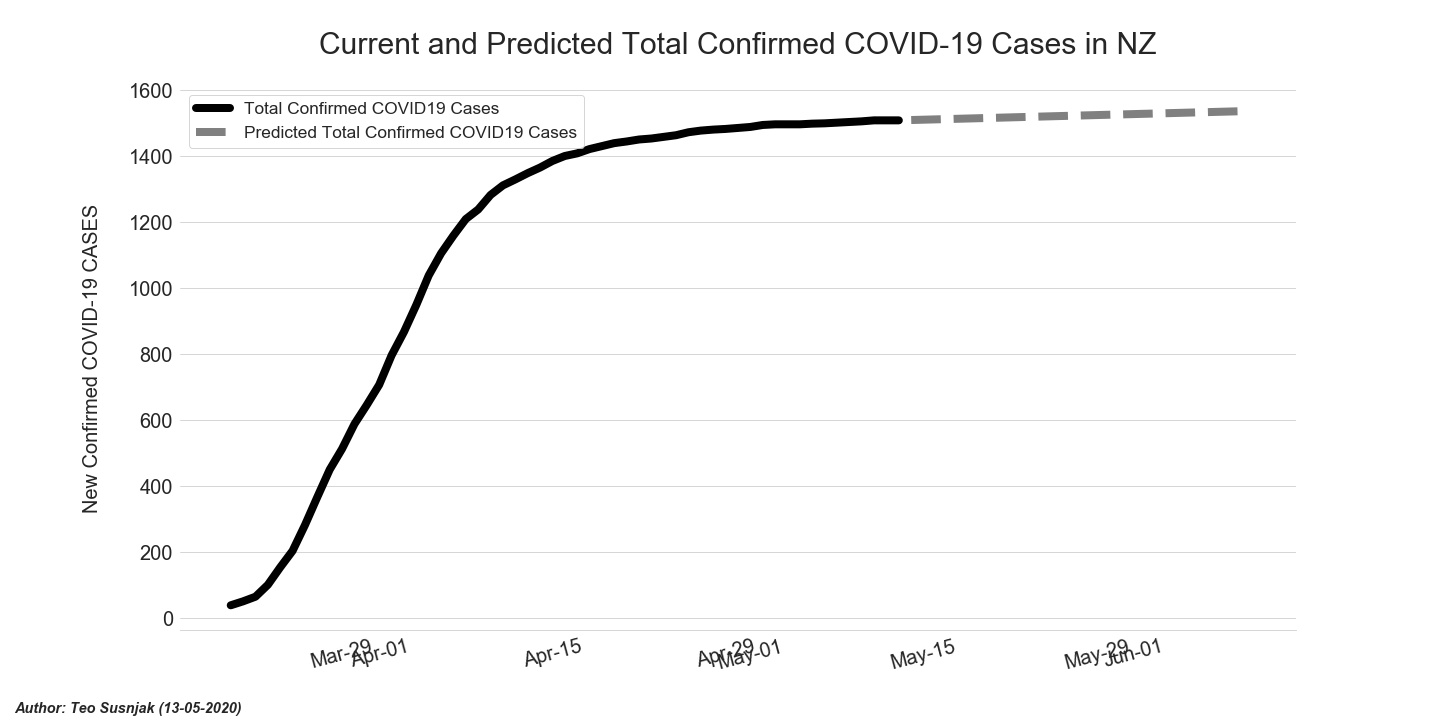
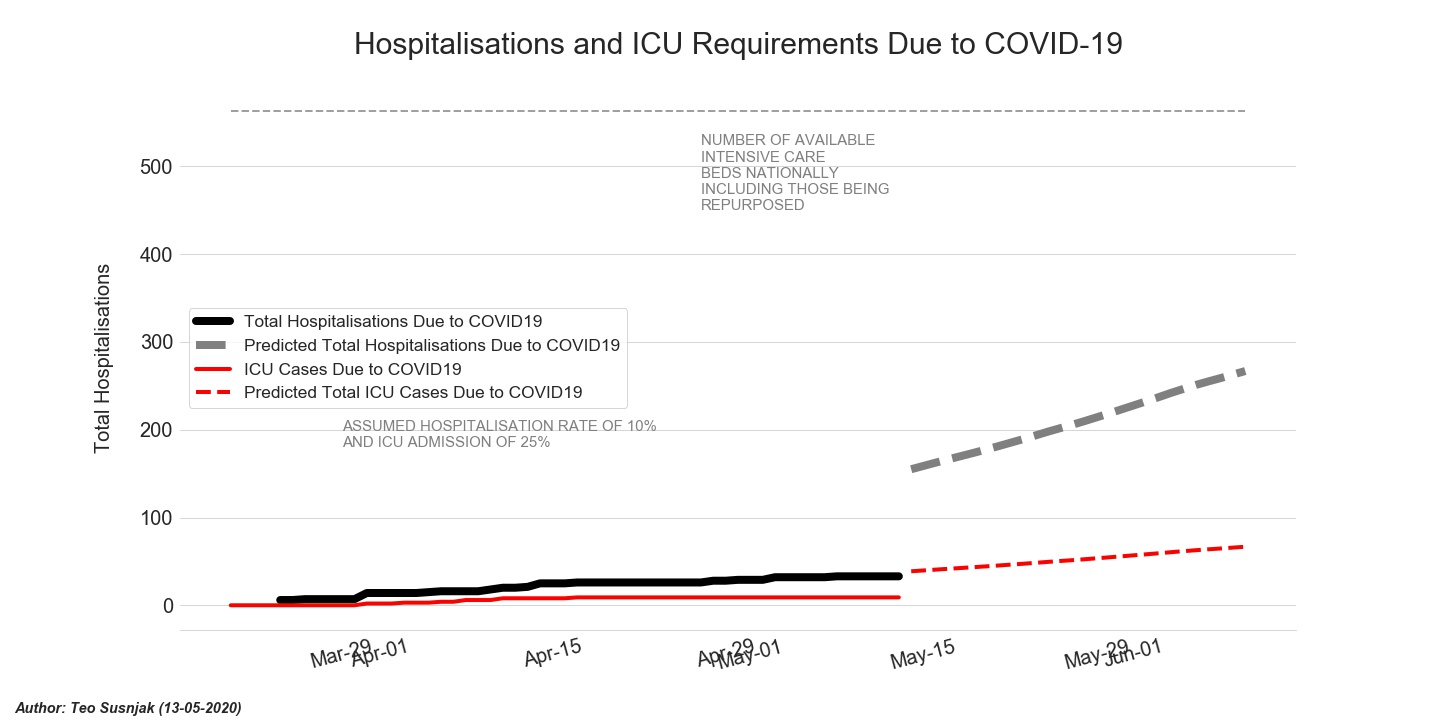
The most optimistic forecasts are captures in the following two graphs. Other countries have reported hospitalisation rates that are ~10% of confirmed cases, ICU rates that are ~25% of those who are hospitalised. While NZ is still at relatively early stages of the outbreak, these rates have not held up to the local context. The hospitalisation rate for NZ has been ~2% and this has translated also to very low overall number of patients requiring ICU care. The figure below highlights the trends up to today, as well as forecasts over the next month. If the hospitalisation rates continue to hold, then the health system as well as the NZ UCU capacity is well placed to manage the potential demand in the near future.

Estimating Fatality Rates
Ascertaining the exact fatality rates caused by COVID-19 is difficult. There is a great deal of conflicting information from various countries and therefore, it is probably unreliable to apply fatality rates from other countries to NZ. Italy is currently fatality rates of ~9.9%, meanwhile, in stark contrast, Germany is reporting ~0.5%. These are considerable differences and other countries are reporting numbers that are somewhere in between: Spain ~7.1%, Switzerland ~1.3% and US ~1.3%.
As of writing, NZ has had approximately 800 cases and one death due to COVID-19. This thankfully represents a very low fatality rate of ~0.13%, but unfortunately a rate which is likely to increase with time. The graph below represents a scenario of what would happen to the death rate over the next four weeks if the average death rate over the previous seven days holds.

Lockdown Policy Implications (by Rachel Owens )
13 May 2020
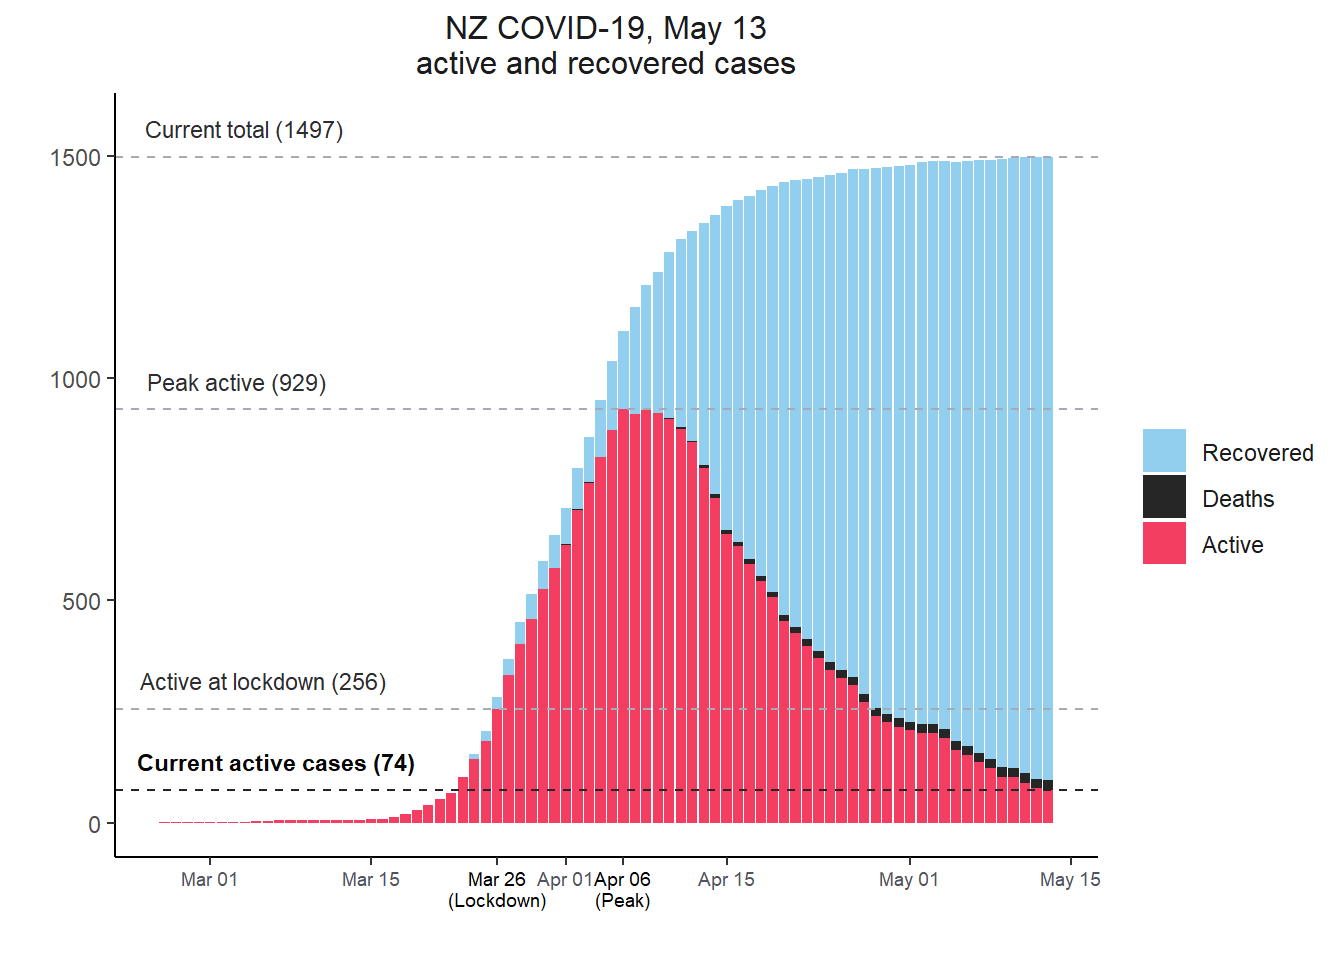
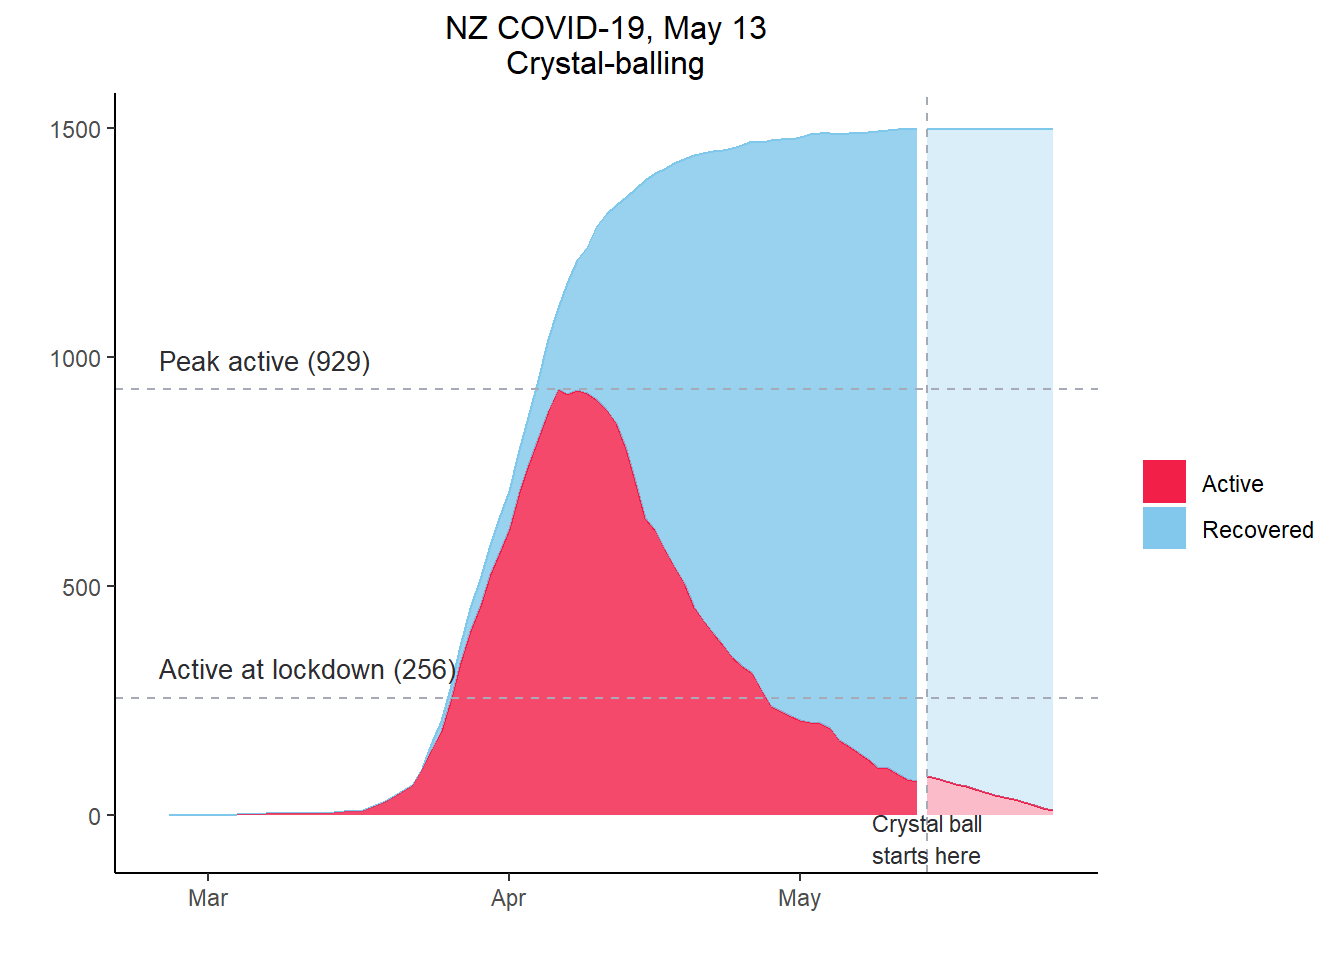
On the eve of the 26 March move to alert level four (commonly referred to as ‘lockdown’), New Zealand’s Director-General of Health, Ashley Bloomfield, predicted that COVID-19 cases would rise for ten days before a turnaround, and this is what we are seeing here. During lockdown, active COVID-19 cases in New Zealand took around 12 days to peak and have dropped steadily ever since, due to recoveries and a decreasing rate of new infections. We can safely assume that strict social distancing and border controls have afforded this turnaround.
We should bear in mind that any apparent trend in the reduction of active cases evident in this plot below, may be susceptible to changes in social distancing behaviour. On Monday 20 April, the Government announced that NZ would move to alert level three on Tuesday April 28 and stay there for a minimum of two weeks. On Thursday 16 April the Prime Minister, Jacinda Ardern, outlined in further detail what alert level three would look like - a looser form of social distancing where the criteria around permitted economic and social activity are widened. Given the border controls, and assuming all COVID-19 cases are known and managed, we should not see any change in the trend. However, should there be silent cases in the community, or a break of isolation by active cases, we may see the active cases increase again.
Looking ahead
In New Zealand there has been robust debate about when lockdown should end. Some say it needed to end before four weeks. On RNZ National on 20 April, University of Auckland Professor Shaun Hendy advocated for an extension of at least two weeks. Shaun Hendy leads a team that has been modelling COVID-19 data. That analysis was considered by Government Ministers when they decided to extend the lockdown period by nearly a week, and commit to at least two further weeks at alert level three.
His area is complex systems and networks, and his team will have modelled both the consequences of lockdown extension, and lockdown easing. Here I look at a simple lockdown extension scenario over the next two weeks. The rate of daily infections was modelled over time. Recoveries were modelled from infections. Both models were used to predict what might happen in the next two weeks if we were to stay locked down.
Bear in mind that when visualising the future, a lot depends on the direction of the trend line near the tail of the current data. As daily infections become small, movement in the tail of the data becomes a little volatile, and trend lines are sensitive to this.
If elimination* is the Government’s goal, then further weeks of high levels of social distancing seem promising.
- Elimination is not to be confused with eradication. Elimination requires that the virus is no longer circulating in the community. Under such a scenario, occasional flare-ups could still happen (think measles). Eradication is when the virus gone completely, around the globe.
Origin of infection - Overseas/Domestic
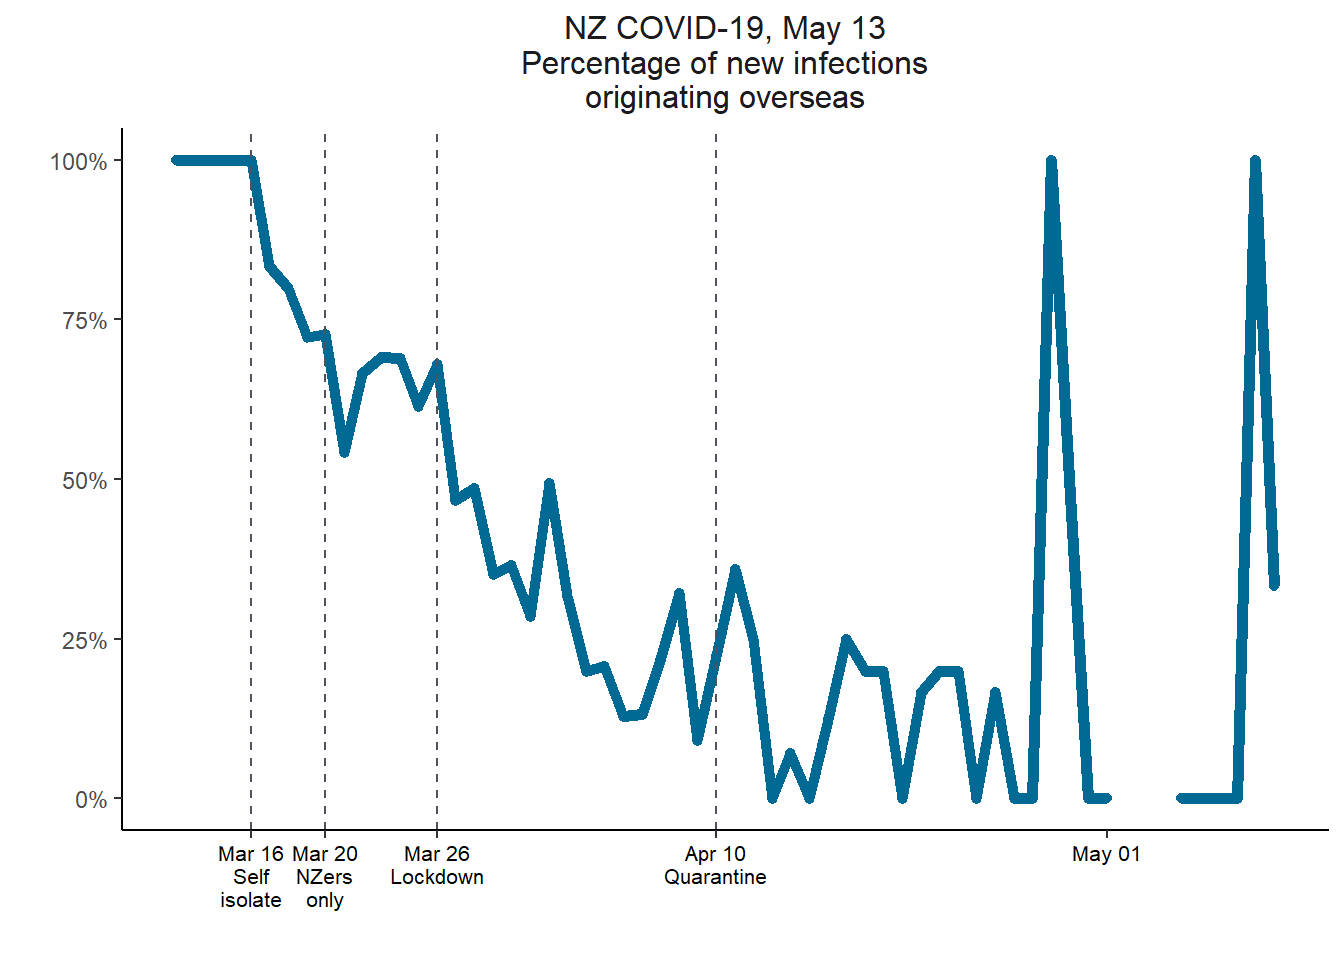
I’m also curious about border controls and reported COVID-19 cases in NZ. Here we see that as controls were gradually introduced, the percentage of new infections originating from overseas decreased.
Will it always be good to see this pattern and is it all about border controls? Consider another, less happy scenario than we are currently experiencing: Border controls remain loose, and COVID-19 is also less well controlled within our community - the virus runs rampant. In that nightmare, we would also see a gradual decrease of the percentage of new infections originating overseas.
Perhaps counter-intuitively, we eventually want that line to shoot all the way up to 100%. That will mean no infections circulating domestically. And all those new overseas cases? They will be in quarantine.
See that little wiggle after quarantine was introduced? That could simply be a quirk of total new infections dropping to a small number, but it could also be a good sign.
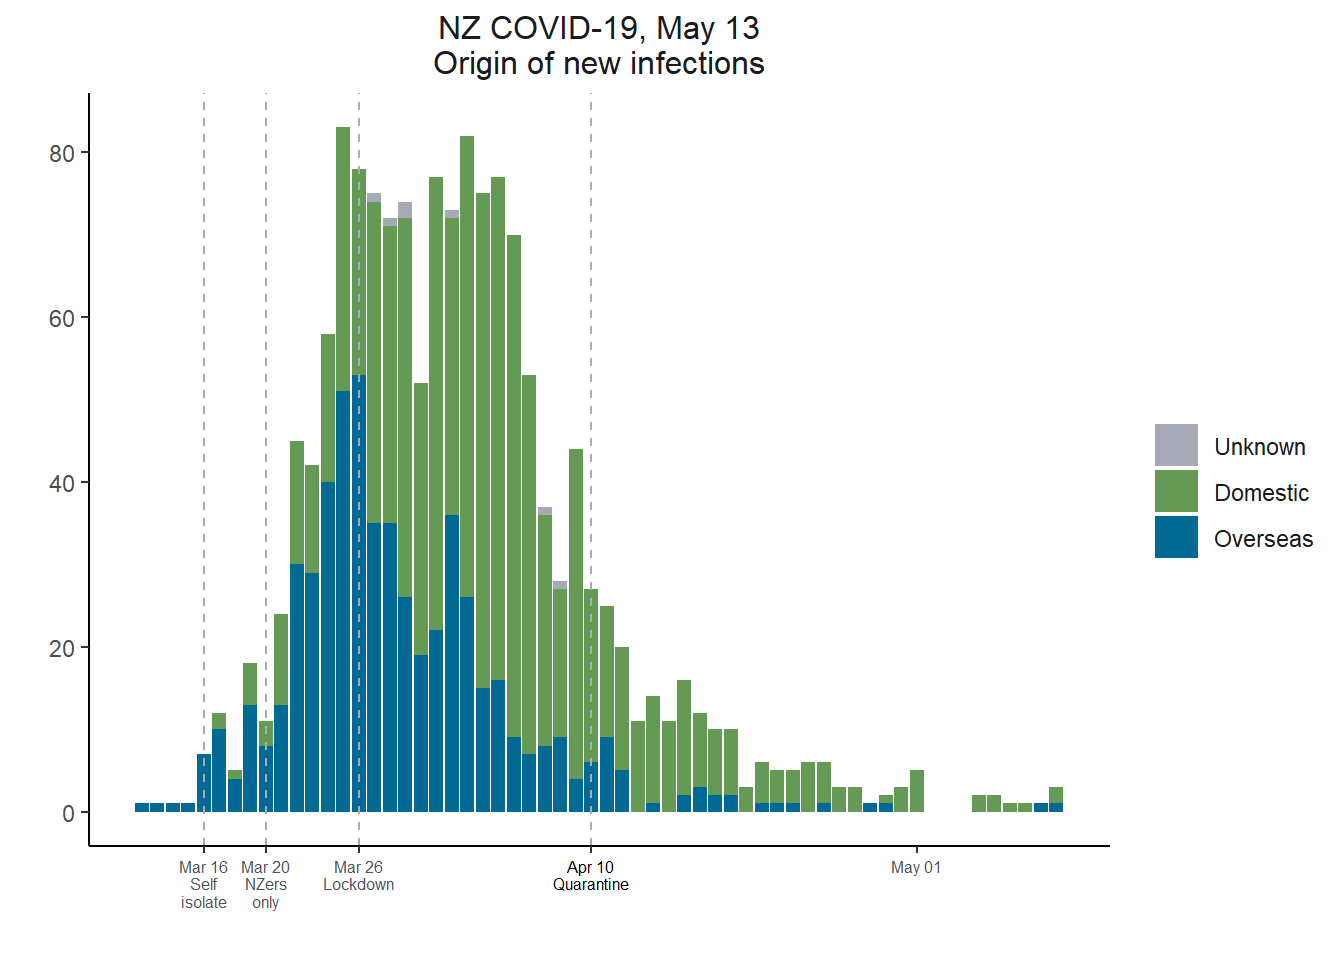
Below you can see the total count of new infections across three categories of origin: Overseas, Domestic and Unknown.
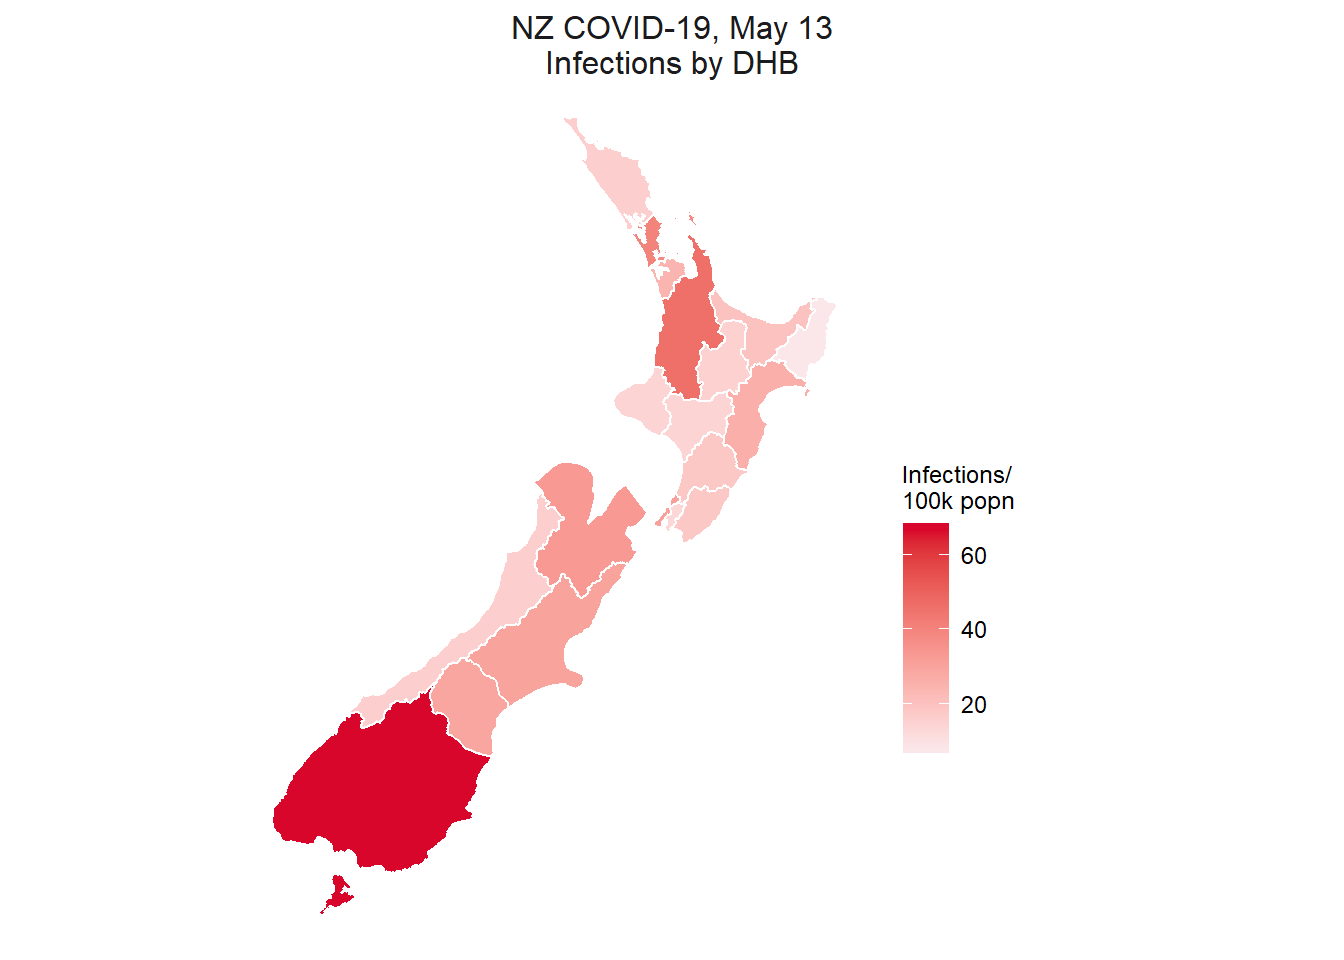
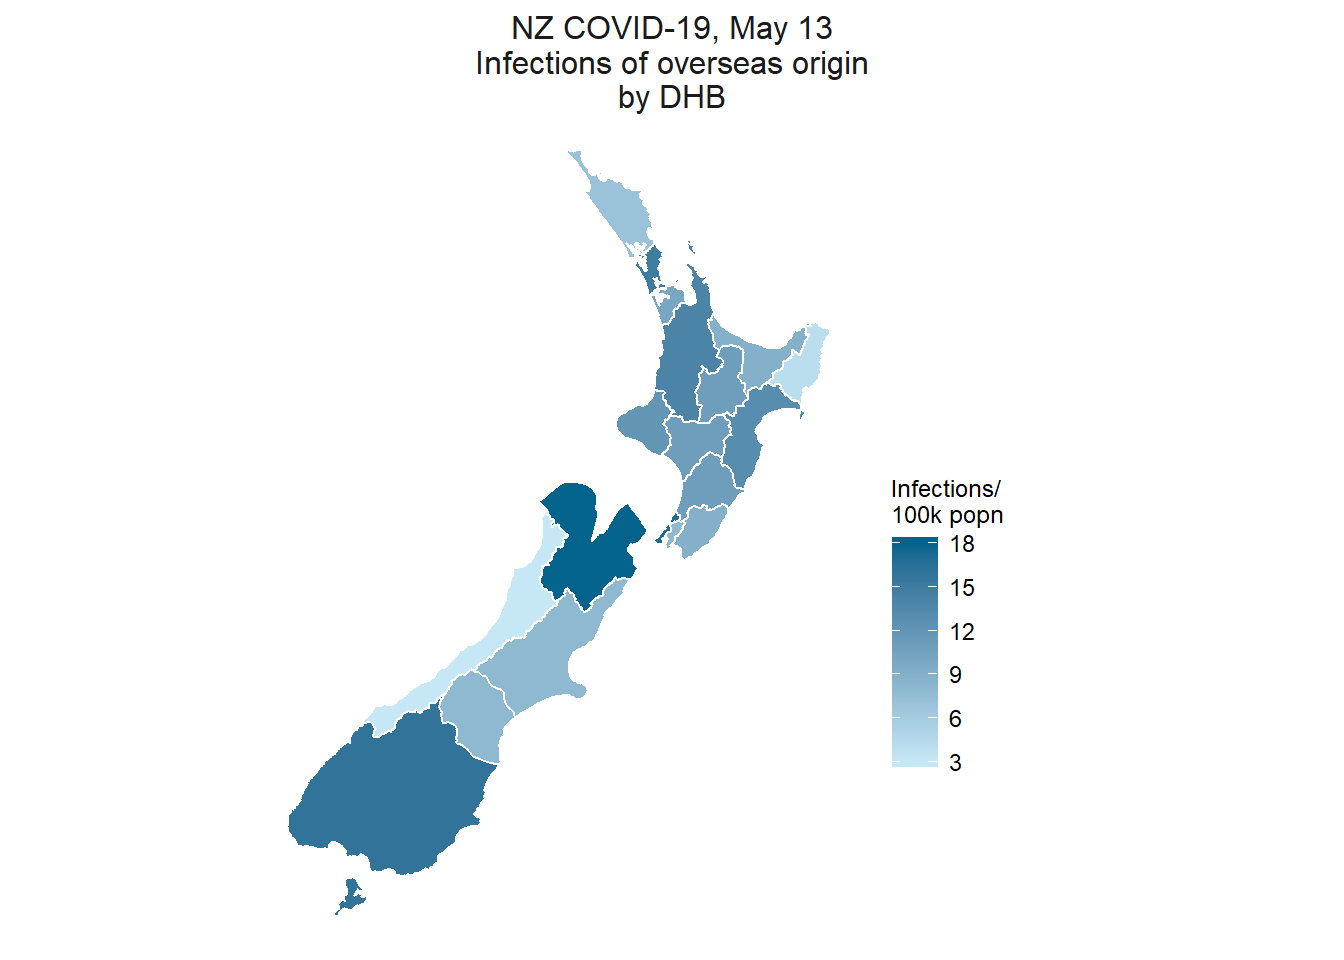
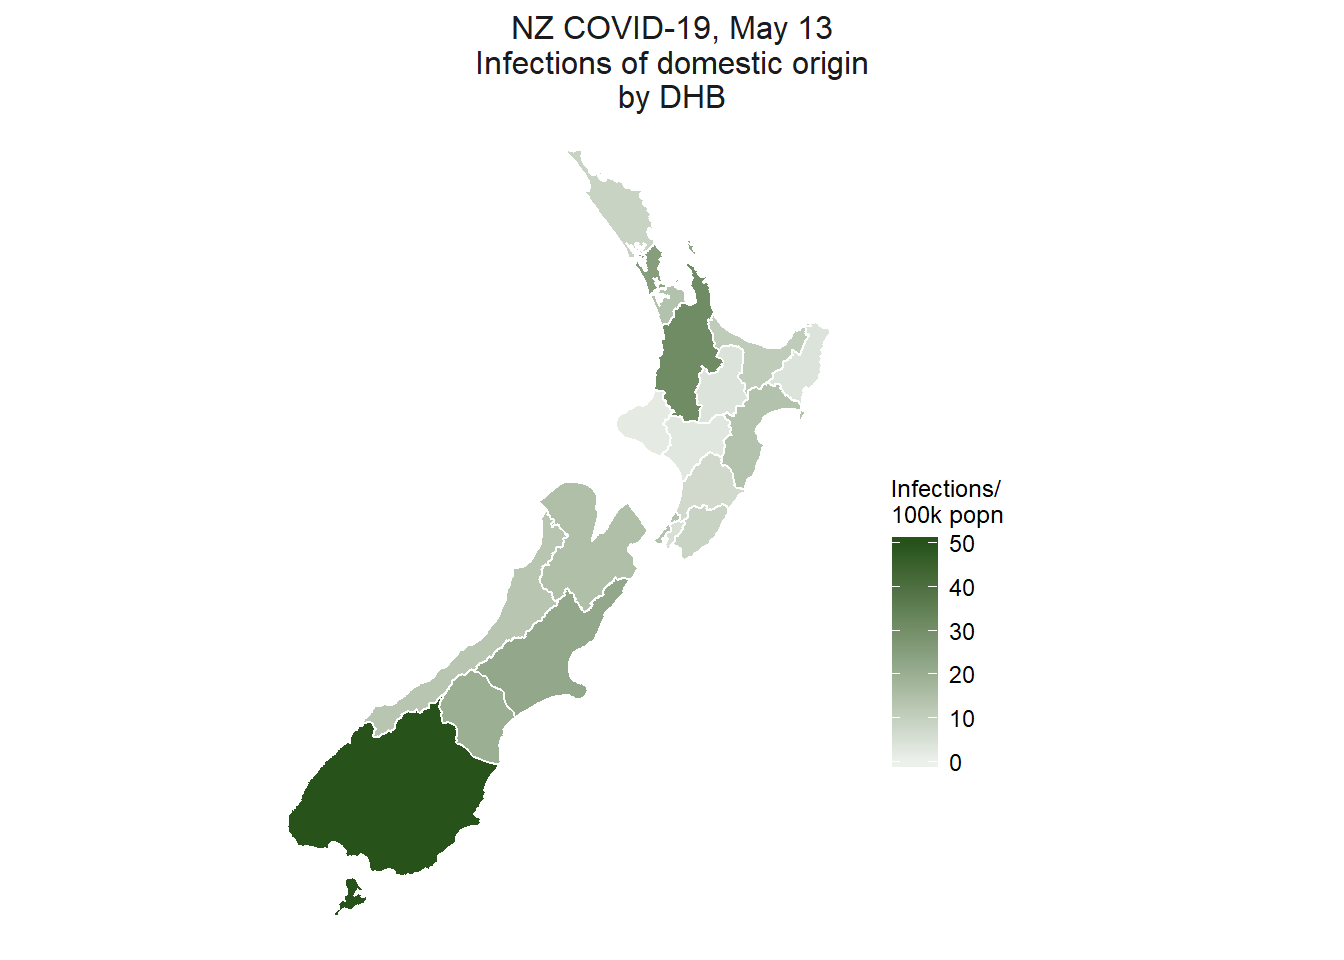
Infections by District Health Board
The Southern District Health Board has seen a disproportionate number of infections. This is perhaps partly due to the effect of clusters of infection, combined with a relatively low infection rate overall in NZ. Had NZ not introduced border controls and lockdown, and had the virus been given more opportunity to circulate, we would likely see a more even distribution of clusters, community transmission, and more equal infection rates across regions. It is also likely relevant that the Southern DHB encompasses some of NZ’s more popular tourism spots..
Someone has suggested it would be better to visualise this data by geographical source of infection rather than DHB. That sounds like a good idea, but I don’t have access to that data. The current cases list put out by the Ministry of Health has details about the DHB a confirmed or probable case is in, whether they had travelled overseas and if so, the country a person returned from.
What we don’t know from the list where in NZ the infection was caught, if domestic.
What I can do is produce a map (still by DHB) with just domestic cases and another with just cases of overseas origin. There are also some that are “unknown” not included here.
I have used different colours for each map because they each have a different scale and I don’t want the colours being interpreted as the same (if I make the scale the same for each map, the differences in the overseas origin map become indiscernible).
You can see here that the scales are quite different - the origin of infections is mainly domestic - but this is changing over time and we should see new infections being more and more from overseas origin (I hope).
It is quite interesting to see that Nelson Marlborough has a relatively high number of infections relating to overseas travel.
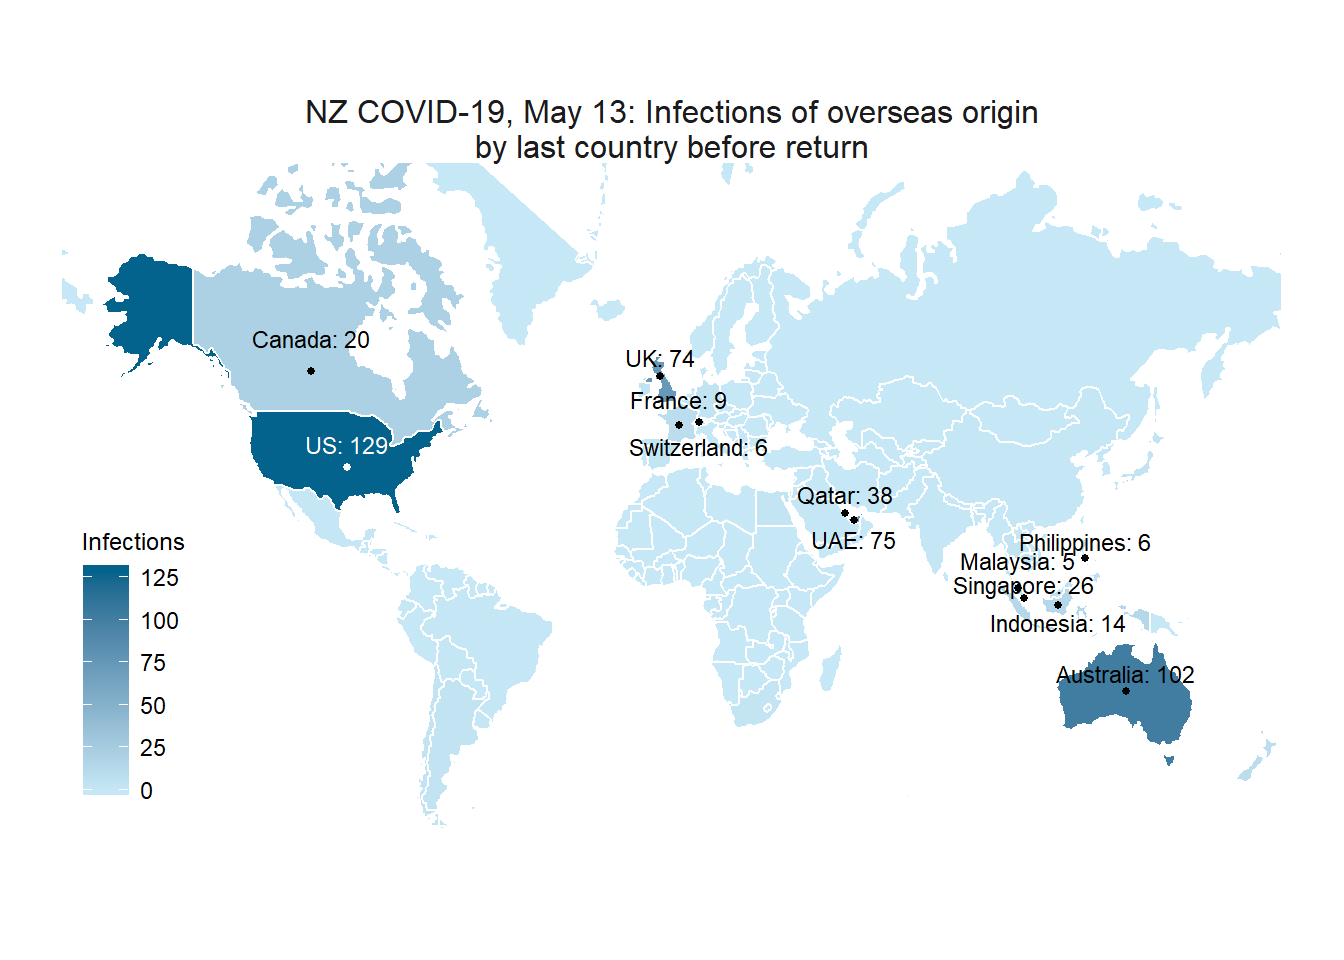
Infections by last country before returned
Where are NZ’s COVID-19 infections coming from? It is surprisingly hard to know. This map shows infections in NZ of overseas origin, by “last country before return”, and I have only highlighted countries from where we have seen 5 or more cases.
Interpret this map with caution.
Why?
-
We don’t really know what assessments were made when determining “last country before return”. What we can probably assume is that it doesn’t necessarily mean the virus was caught in that country.
-
Perhaps the country was merely a stopover on the way home? The pattern of the data seems to align with the location of flight hubs between NZ and the rest of the world. For instance there are less than 9,000 COVID-19 cases in Dubai, yet it features strongly. The US, Singapore and Qatar are also flight hubs.
-
This is just my intuition. Clouding the picture is that there are plenty of cases of UK origin and we know there are no direct flights from there. It is possible that “last country before return” is piece of information recorded by different clinicians with different interpretations of the question.
-
The data will also likely reflect the way NZers travel, rather than how the virus has spread. Australia is not a virus hotspot, but there is a lot of traffic across the ditch.
Death Rates - UK Case Study
The United Kingdom produces statistics on deaths, which are coded by cause with remarkable speed which is as close to real-time reporting that one can achieve for this type of data. The Office for National Statistics produces these figures for England and Wales with a lag of approximately two weeks and releases them here: https://www.ons.gov.uk/peoplepopulationandcommunity/birthsdeathsandmarriages/deaths/bulletins/deathsregisteredweeklyinenglandandwalesprovisional/weekending27march2020
The digression to the UK context at this point is useful and instructive for a couple reasons. Firstly, the Ministry of Health in NZ does not provide this data in a timely fashion. Despite requests, the most recent data that can be sourced in NZ goes as far as 2018, which is not useful for an analysis of a currently evolving crisis. For this reasons, an alternative that provides rich data is sought. Secondly, UK is acutely affected for the outbreak and is experiencing large numbers of fatalities attributed to COVID-19. From a statistical point of view, the sheer volume of overall fatalities provides a firmer footing for drawing conclusions or at least posing even better questions. Thirdly, the coding of causes of death covers respiratory-related diseases such as influenza and pneumonia, which aid in contextualising the deaths attributed to the COVID-19 outbreak. As more data comes in from the UK over the next few weeks, the ability to draw insights about the true magnitude of the human toll and explore new analyses will significantly increase.
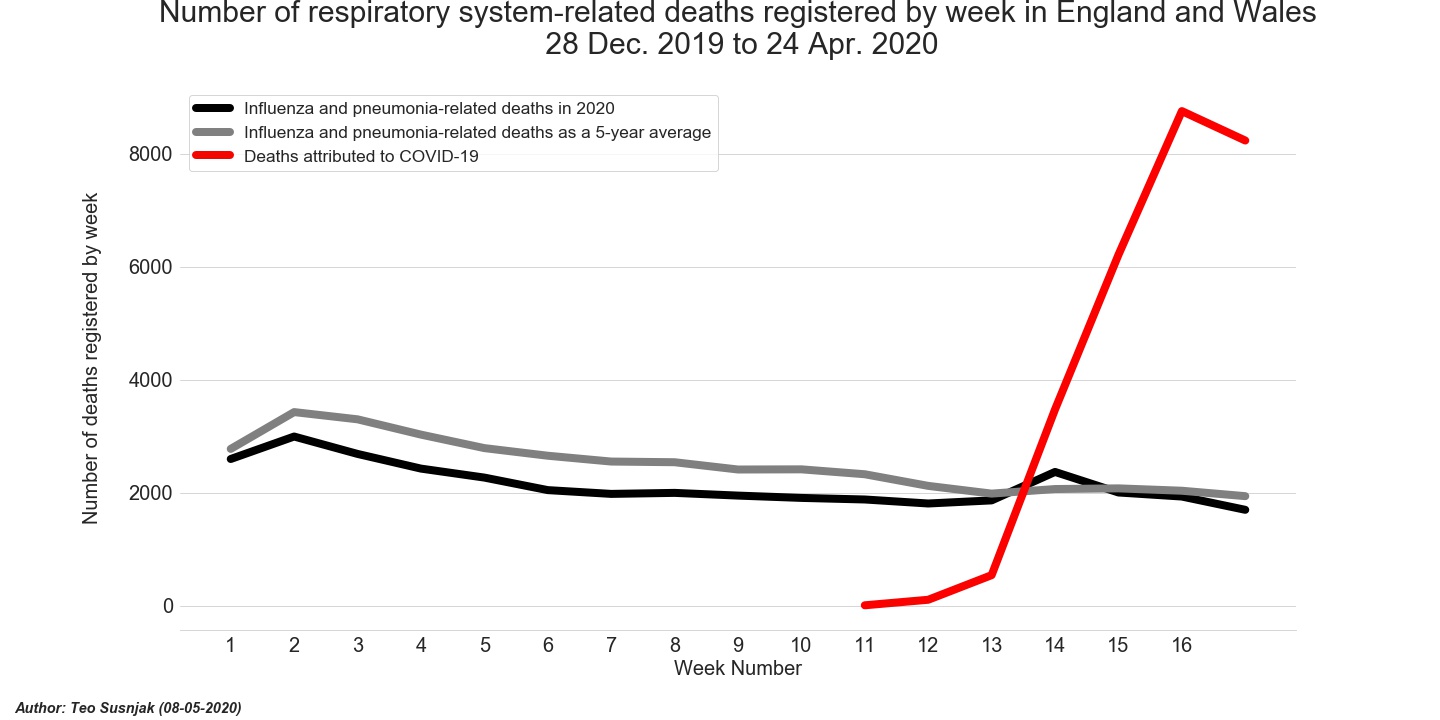
The data in the first graph below shows the total number of respiratory-related deaths registered per week in England and Wales for this year, compared to the average of the five years prior. The deaths capture influenza and pneumonia-related fatalities, as well as COVID-19. COVID-19 begins to show up in the graph from week 12 onwards representing the period of around March 20, while week ending April 3 shows a sharp spike in COVID-19 deaths. For the most of this year, deaths caused by respiratory-related illnesses have been lower than in previous years. Looking ahead for the next few weeks, as the recording of COVID-19 caused fatalities increases, it will be interesting to see if the reporting of deaths attributed to influenza and other respiratory-related diseases decreases.
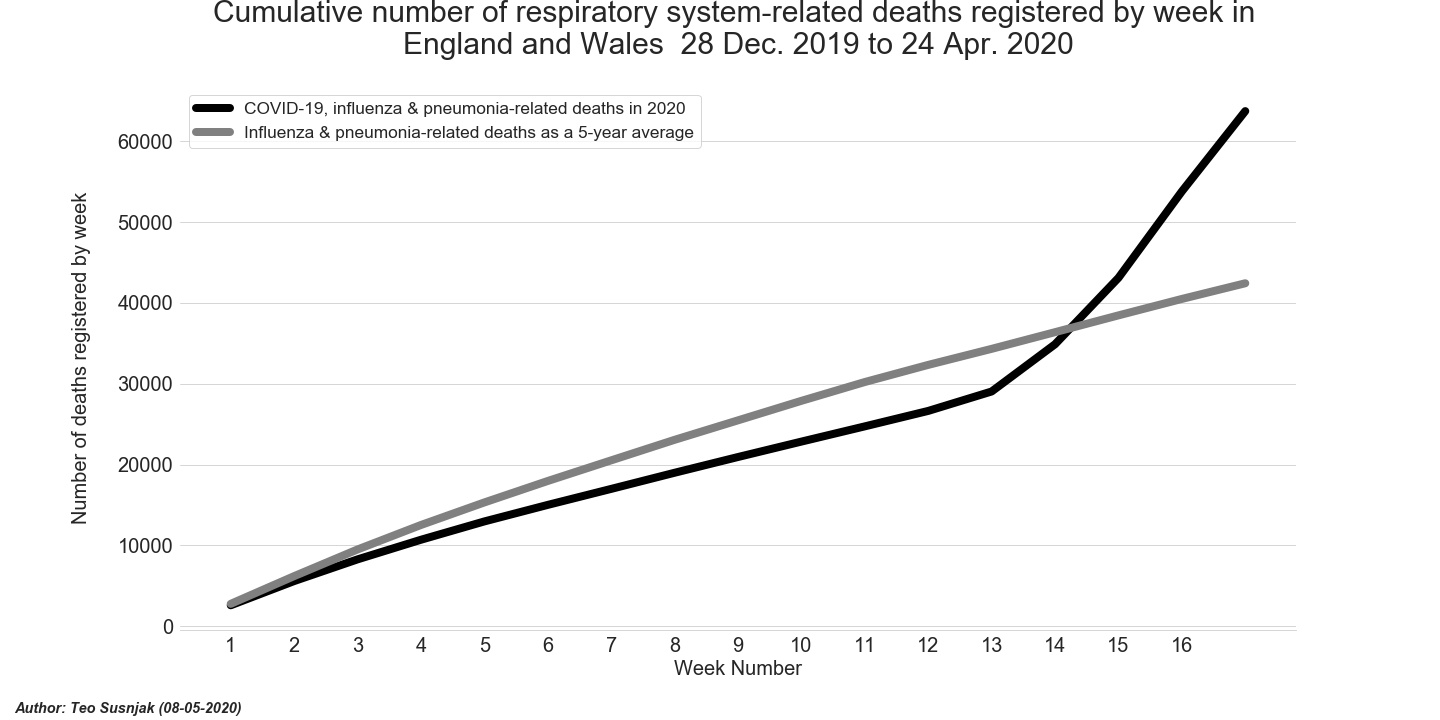
The totals for respiratory-related deaths are visualised as a cumulative sum in the figure below. As of week 13, approx. 5000 fewer death overall have been recorded in 2020 due to respiratory-related and COVID-19 deaths, compared to the average of the last 5 years. From week 14, we see the gap rapidly closing as COVID-19 begins to take a greater toll.
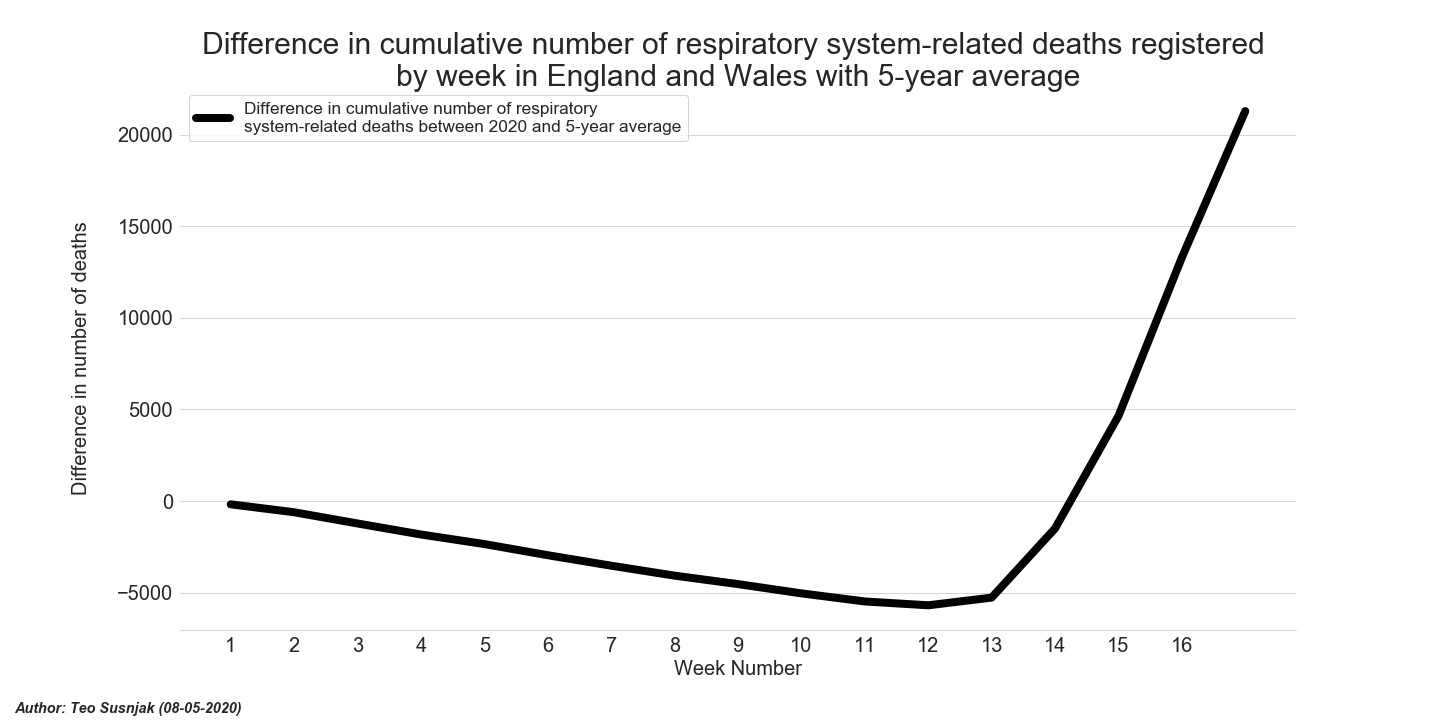
The following figure highlights the difference between the two lines in the graph above. We see that by week 12, almost 6000 fewer death occurred in Wales and England which cited respiratory-related causes compared to previous years. This trend is now coming to an end as the spike in COVID-19 related deaths begins to make an impact on the overall numbers for 2020.
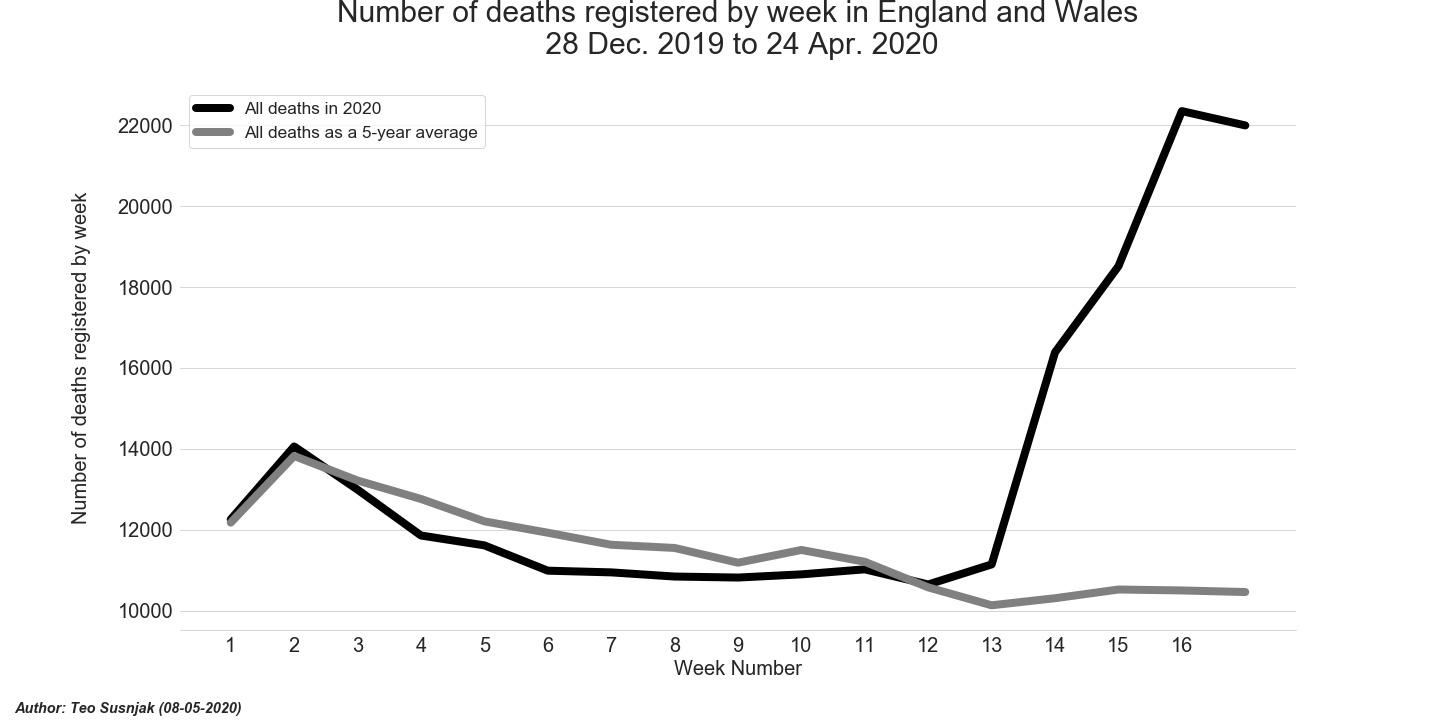
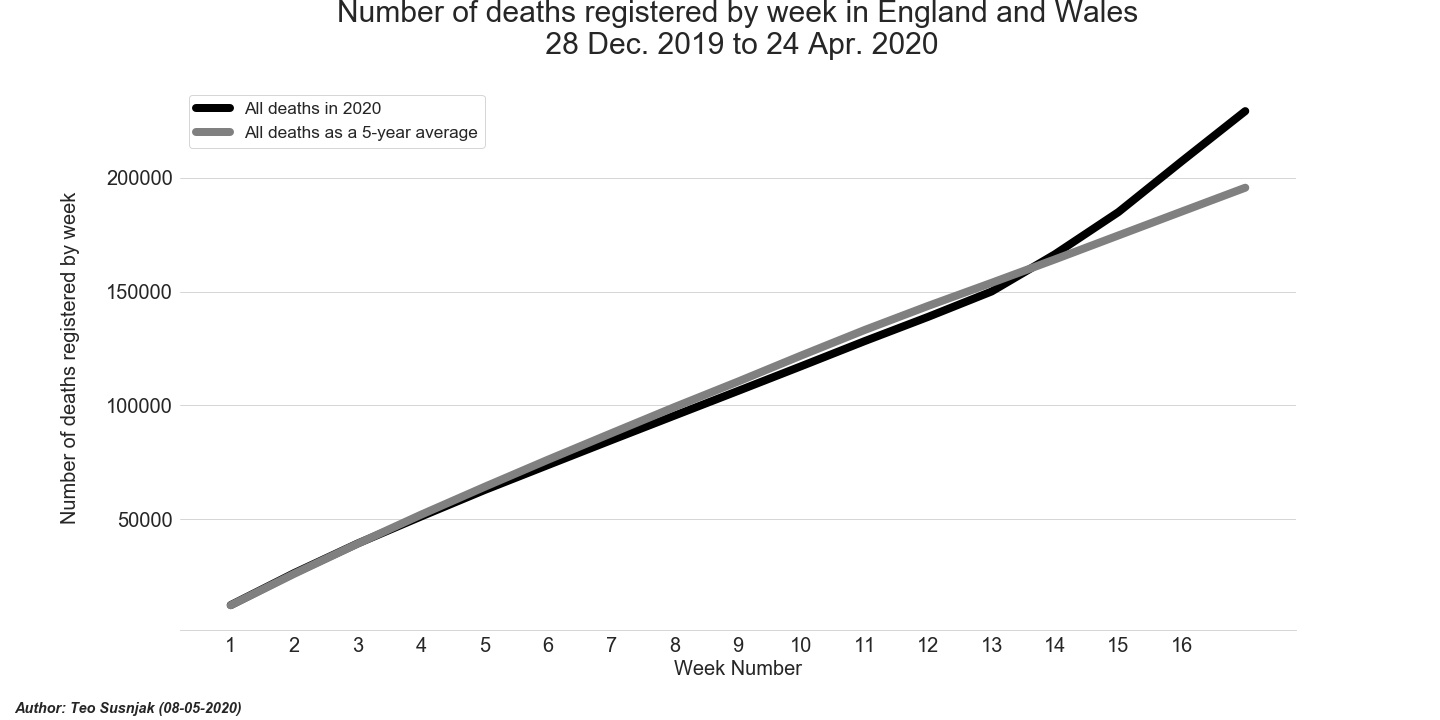
Once the fallout of the outbreak becomes clearer in the data over the course of months, it will become more apparent what the cost to human lives has been. The severity of this outbreak should register in the total number of deaths registered in 2020 compared to previous years. The graph below shows the number of deaths registered each week in England and Wales for 2020, compared to the average of the last 5 years. For most of 2020, fewer deaths have been reported compared to previous years' average.
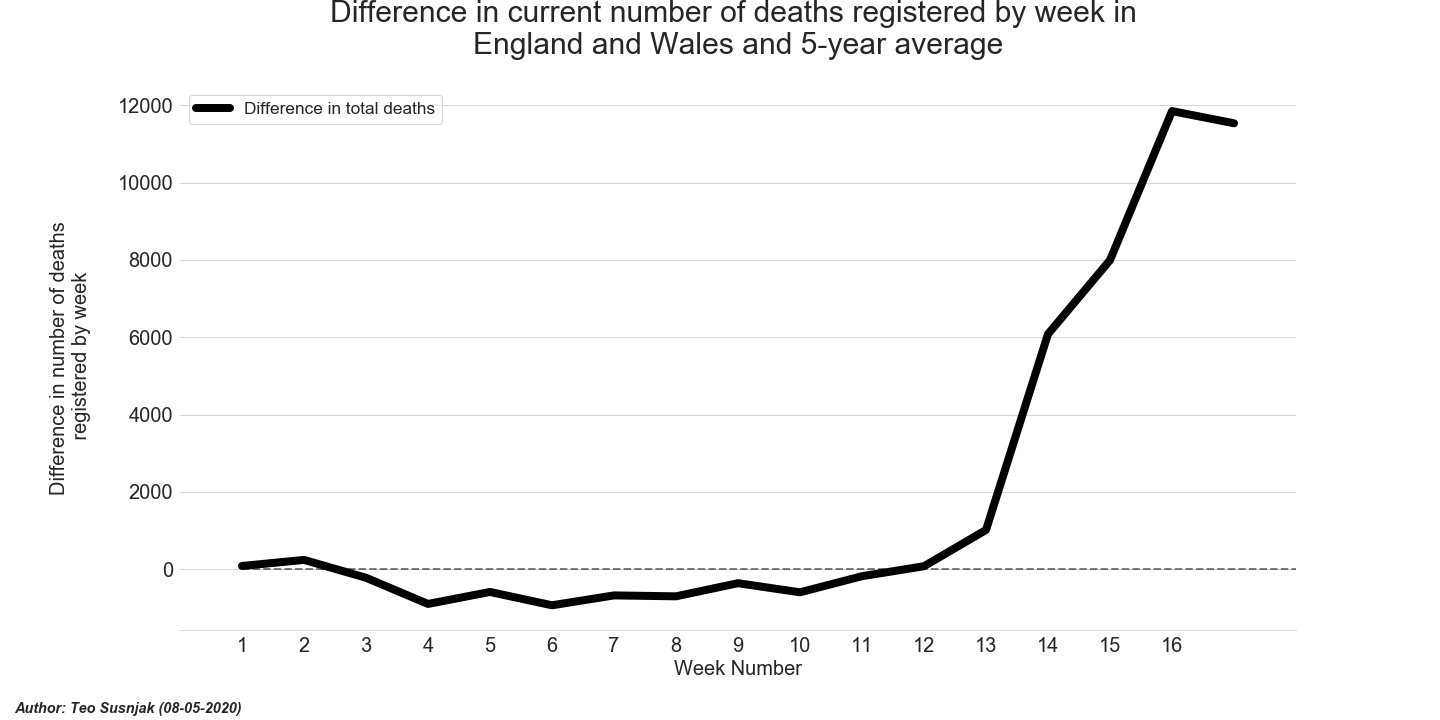
The next graph converts the above data and depicts it as differences in the number of weekly deaths between 2020 and the average of the last 5 years.We see here once again, that fewer weekly deaths have generally been registered for 2020 so far. All things being equal, the severity of COVID-19 related deaths should begin to register on this graph in the following weeks. However, there are additional factors that cannot be accounted for which will likely have an effect on the overall mortality numbers such as fewer road traffic deaths due to the lockdown and possibly more deaths due to treatable illnesses arising from stresses on the National Health Service from COVID-19.
Finally, the cumulative number of deaths for 2020 versus those of the last five year are plotted below showing again that fewer deaths have so far occurred in England and Wales up to the end of March. We can once again expect this graph to change in response to the severity of COVID-19 over the coming weeks and months. In the last week, the total number of deaths for this year is now for the first time higher than the average of the last five years for the same period.
Economic Impacts in NZ
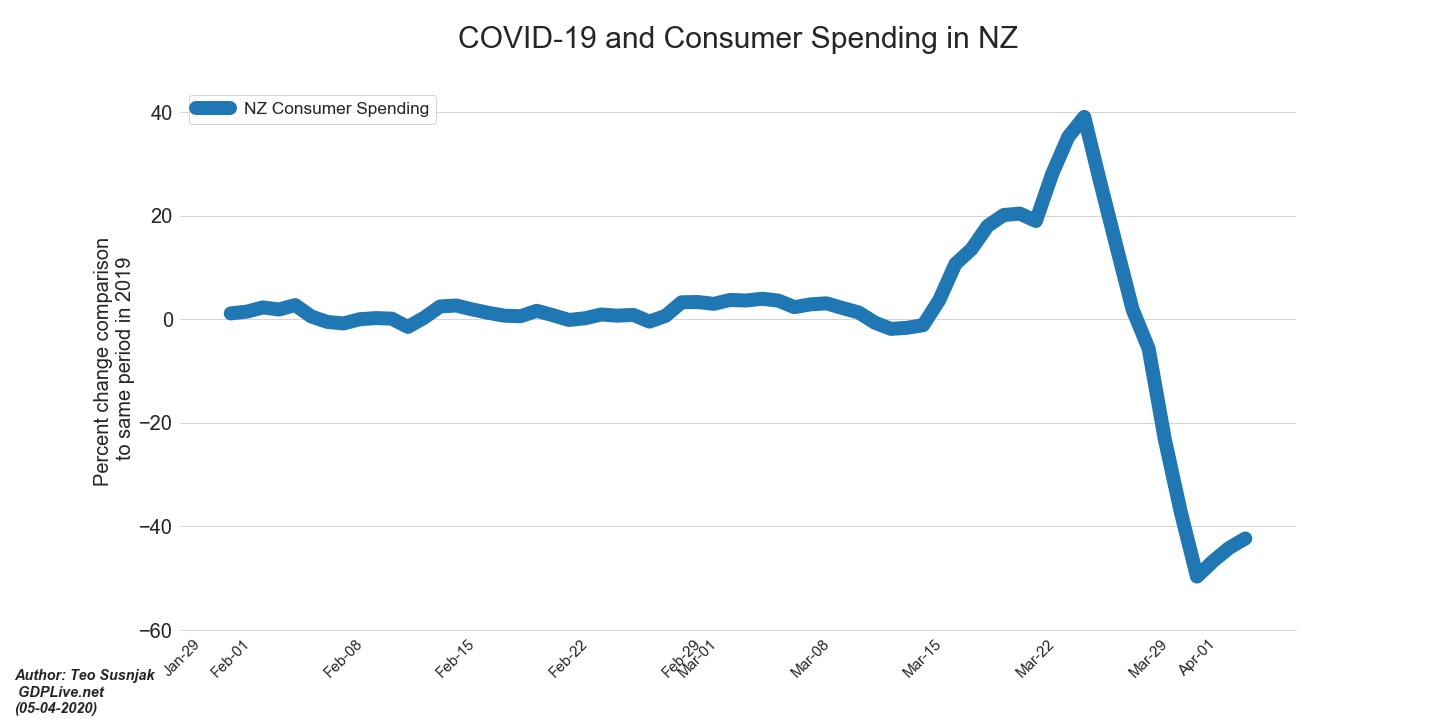
The economic impacts of a prolonged national shutdown in NZ are likely to be catastrophic. The latest economic data from GDPLive.net which monitors the NZ economy in real-time, has picked up dramatic upward swings in spending leading up to the national shutdown, followed by an unprecedented slump as the economy ground to a halt. The data below depicts the consumer spending data which is represented as a percentage change in consumer spending for each day compared to the same period in the previous year.
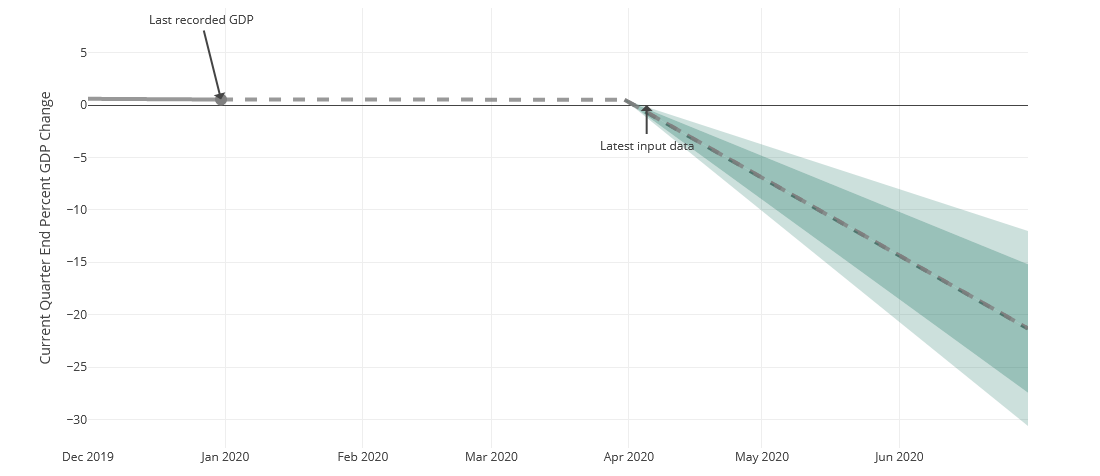
GDPLive.net models have now started to picked up this downturn. The average between the best-case and worst-case scenarios shows there we can expect around a 21% quarter-on-quarter contraction for Q2. The figure below highlights this.
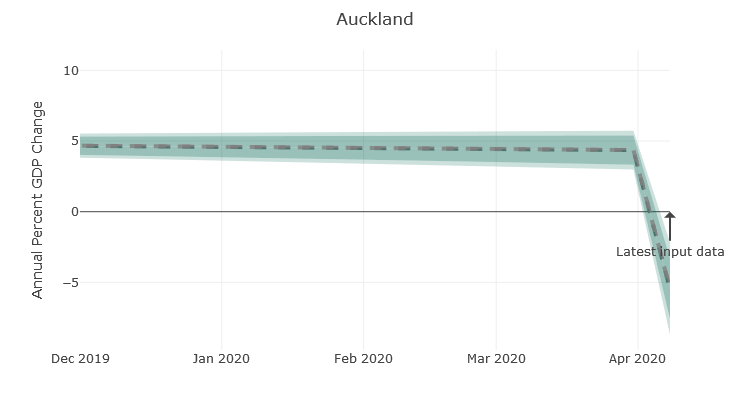
Auckland represents over 30% of NZ's economic output. The forecasts are showing that after an estimated year-on-year 5.5% growth from March 2019 to March 2020, Auckland is now set for a contraction that is currently sitting at 5%, and is increasing each day of the shutdown. This will then have a spill-over effect onto other regions in NZ.
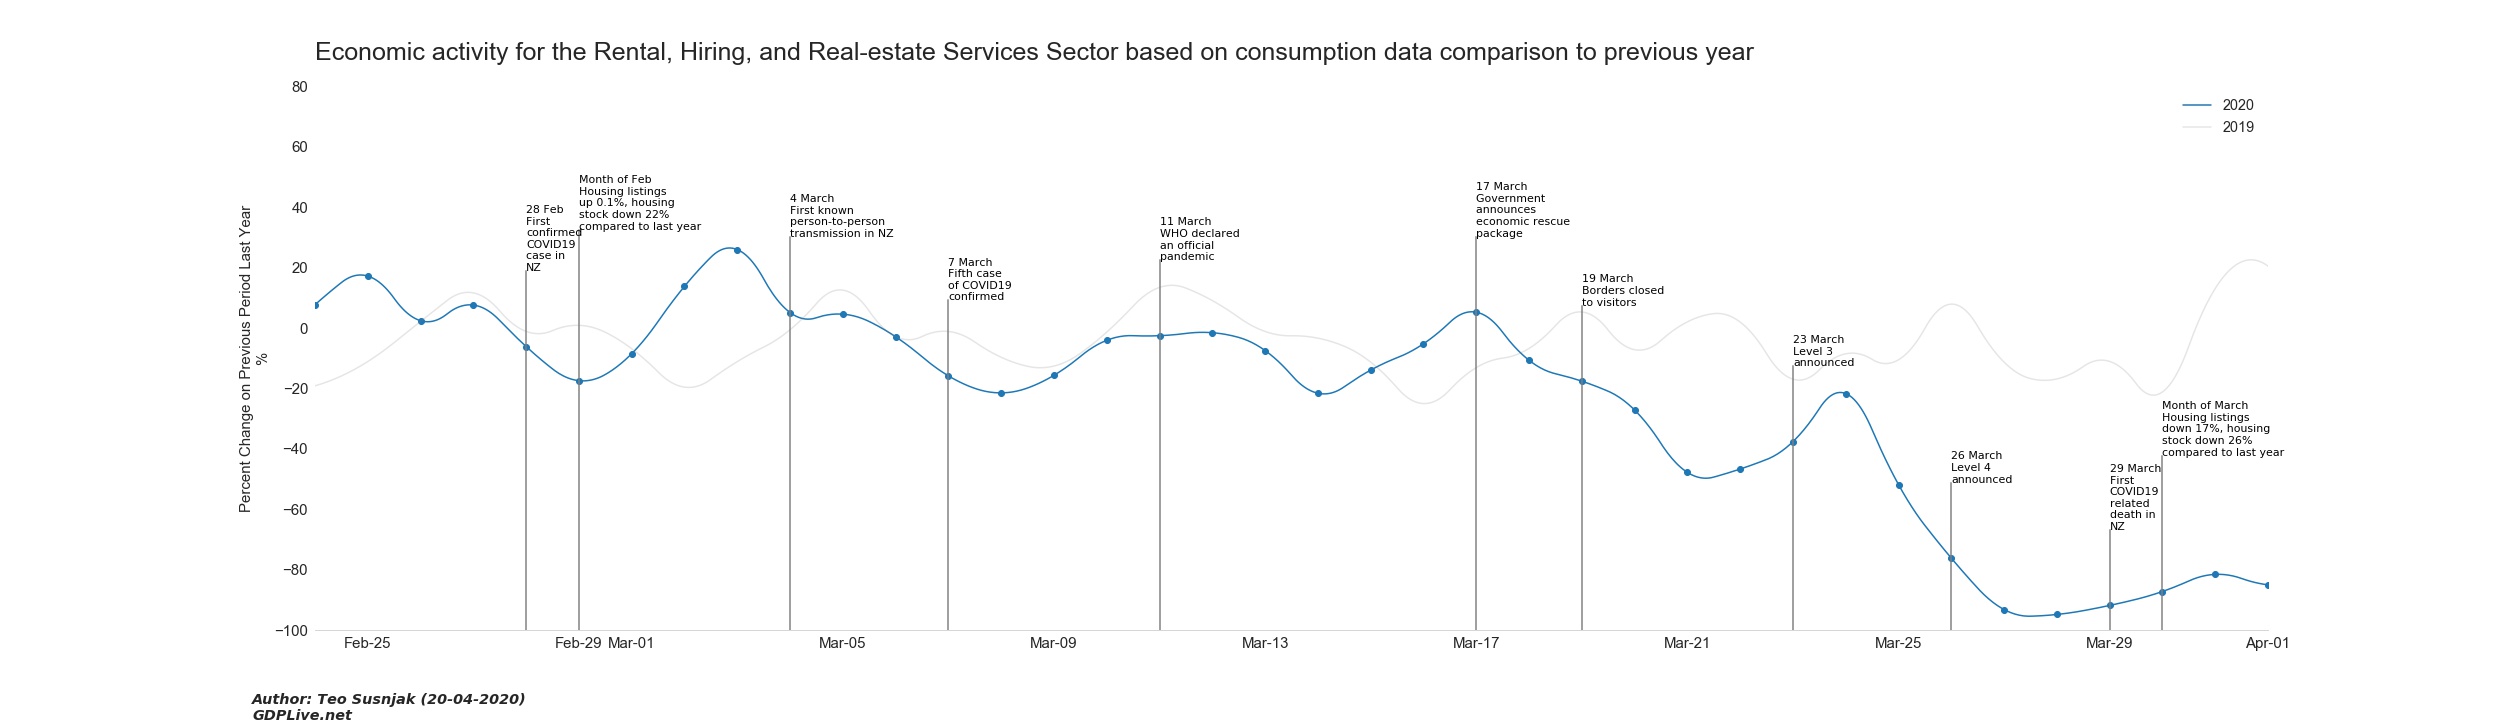
Most industry sectors are expected to take a heavy hit from the fallout of the lockdown. The graph below highlights the unfolding economic activity for the Rental, Hiring, and Real-estate Services Sector. This figure is based on consumption levels being recorded amongst business who are registered under this industry sector. The graph shows the percent change in consumption levels to the same period in the previous year. Both 2020 and 2019 are contrasted. For reference, a timeline of some key events and announcements over the last couple of months are annotated on the graph to accompany the trends. By the time the full lockdown has taken effect, the amount of economic activity for this sector has slumped by an estimated 90%.
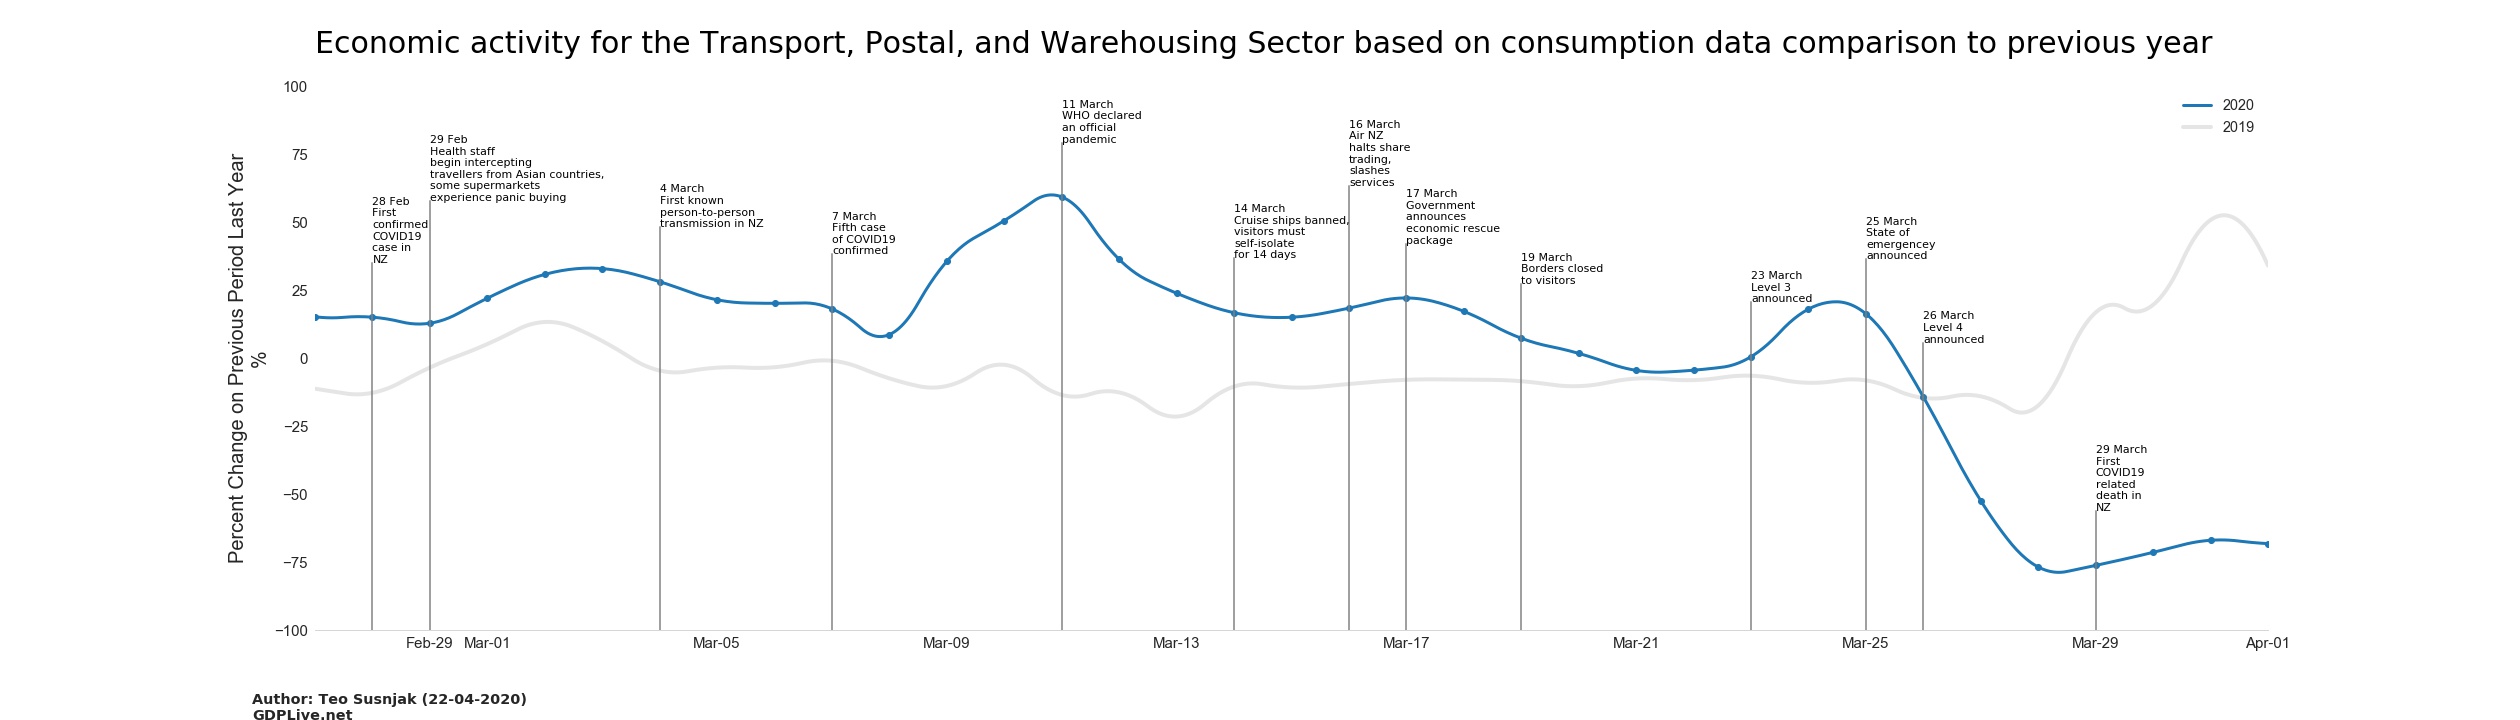
Likewise, the graph below shows the chronology of the decline of the Transport, Postal and Warehousing Sector. GDPlive is predicting that the annual percent change for Q2 for this sector is currently contracting at 9%.
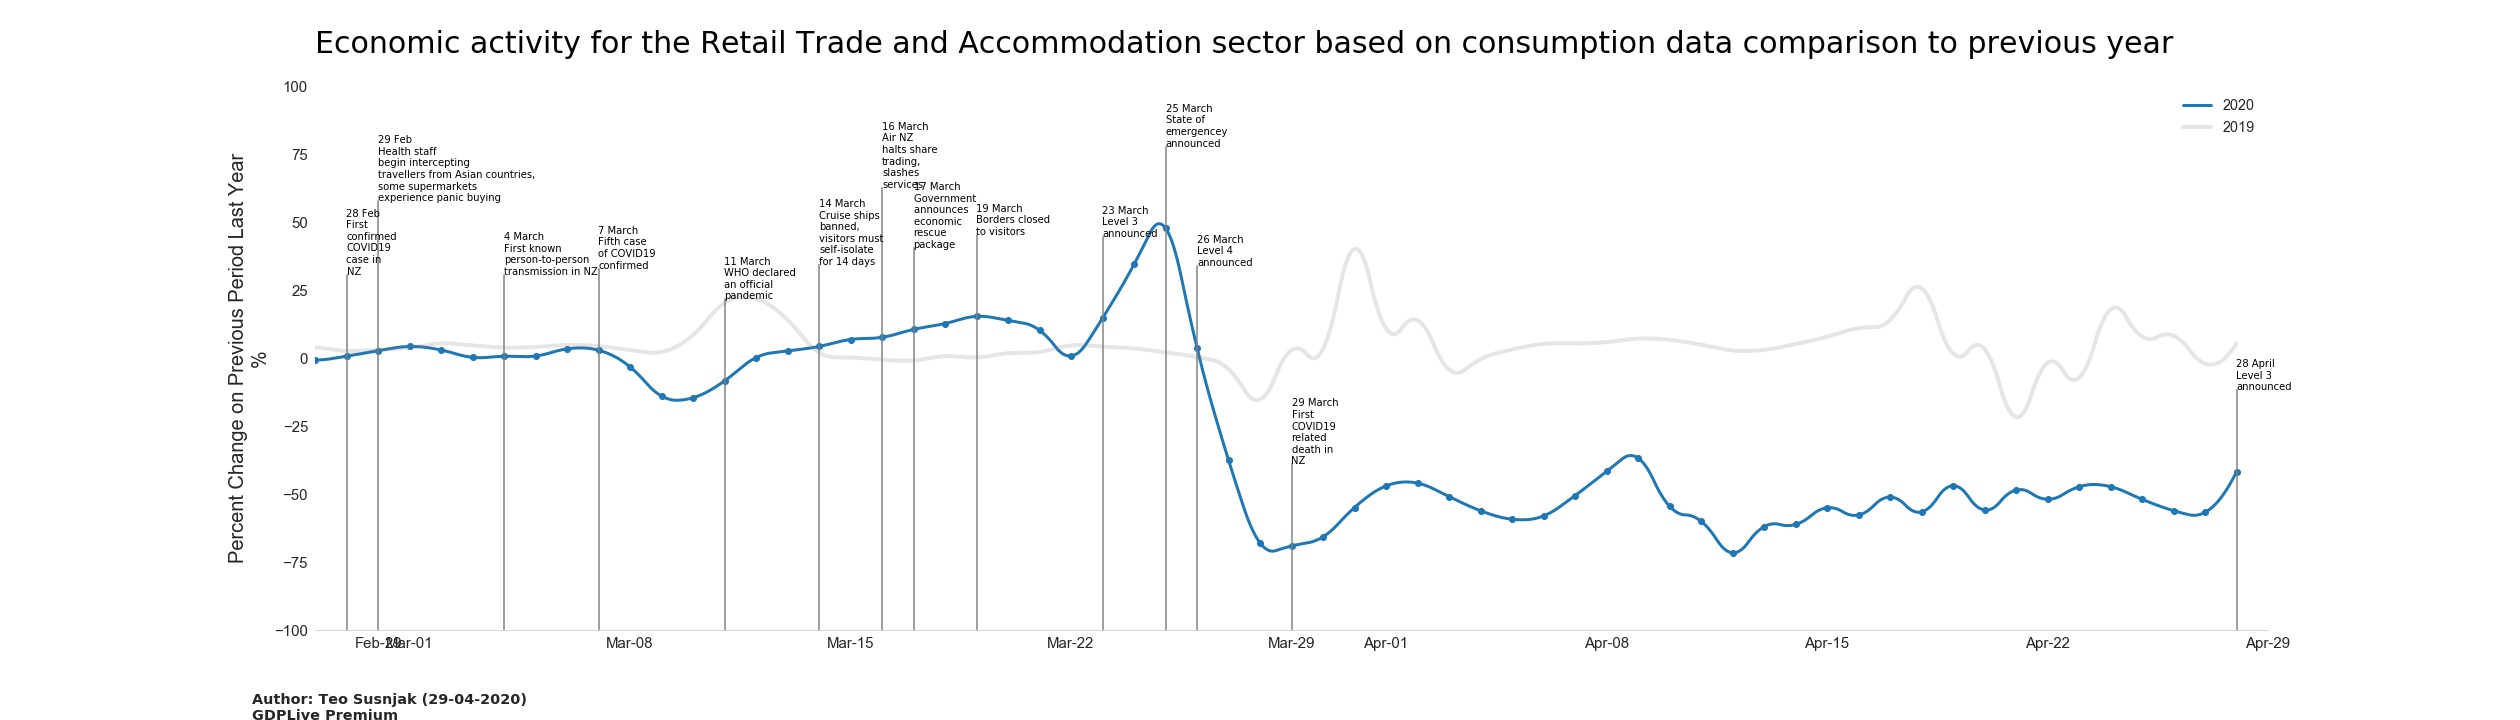
Level 3 Alert has recently come into effect in NZ and with it, some loosening of the lockdown measures have come into effect. The Retail, Trade and Accommodation sector has been particularly hit hard during the lockdown period. The graph below chronicles the events leading up to the Level 4 shutdown as well as the heavily reduced economic activity within this sector throughout the duration of the Level 4 alert level. The road to recovery for businesses in this sector will be a long one.
See GDPLive.net for more up-to-date graphs.
More to follow ...