Velorama - Gene regulatory network inference for RNA velocity and pseudotime data ~~~~~~~~~~~~~~~~~~~~~~~~~~~~~~~~~~~~~~~~~~~~~~~~~~~~~~~~~~
Velorama is a Python library for inferring gene regulatory networks from single-cell RNA-seq data
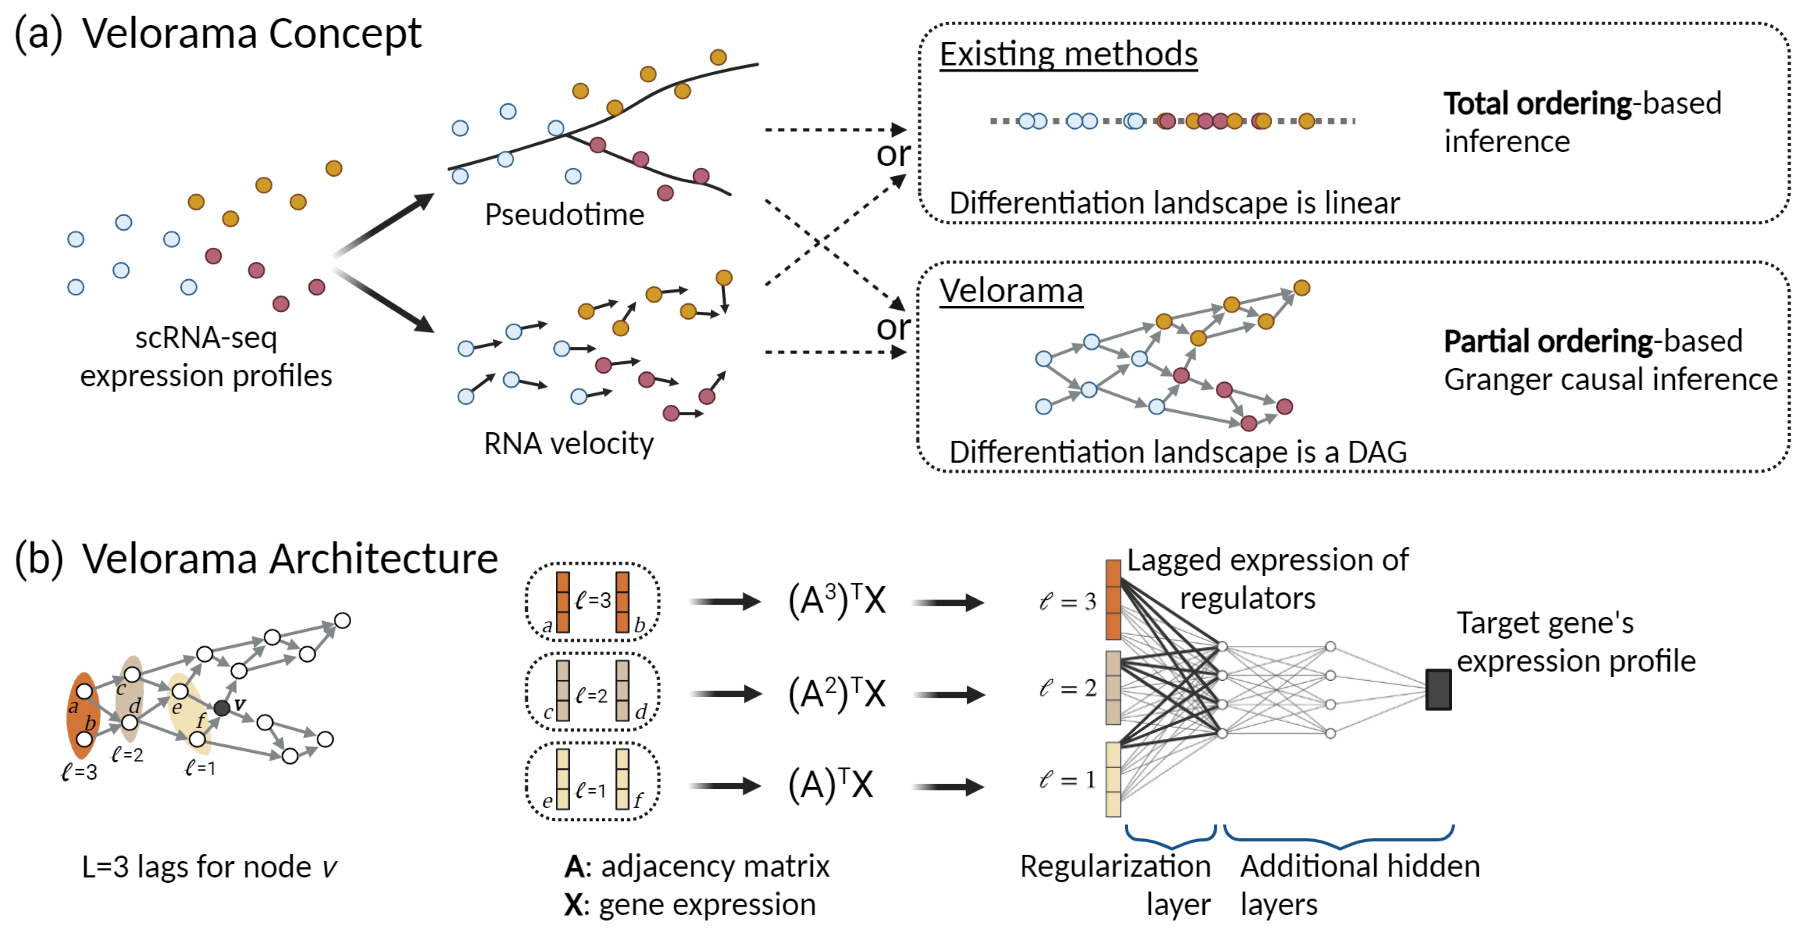
It is designed for the case where RNA velocity or pseudotime data is available. Here are some of the analyses that you can do with Velorama:
- infer temporally-causal regulator-target links from RNA velocity cell-to-cell transition matrices.
- infer over branching/merging trajectories using just pseudotime data without having to manually separate them.
- estimate the relative speed of various regulators (i.e., how quickly they act on the target).
Velorama offers support for both pseudotime and RNA velocity data.
Velorama is based on a Granger causal approach and models the differentiation landscape as a directed acyclic graph (DAG) of cells, rather than as a linear total ordering required by previous approaches.
Velorama is currently offered as a command line tool that operates on AnnData objects. [Ed. Note: We are working on a clean API compatible with the scanpy ecosystem.] First, prepare an AnnData object of the dataset to be analyzed with Velorama. If you have RNA velocity data, make sure it is in the layers as required by CellRank and scVelo, so that transition probabilities can be computed. We recommend performing standard single-cell normalization procedures (i.e. normalize counts to the median per-cell transcript count and log transform the normalized counts plus a pseudocount). Next, annotate the candidate regulators and targets in the var DataFrame of the AnnData object as follows. :
adata.var['is_reg'] = [n in regulator_genes for n in adata.var.index.values]
adata.var['is_target'] = [n in target_genes for n in adata.var.index.values]
Here regulator_genes is the set of gene symbols or IDs for the candidate regulators, while target_genes indicates the set of gene symbols or IDs for the candidate target genes. This AnnData object should be saved as {dataset}.h5ad.
We provide an example dataset here: mouse endocrinogenesis. This dataset is from the scVelo vignette and is based on the study by Bergen et al. (2020).
The below command runs Velorama, which saves the inferred Granger causal interactions and interaction speeds to a given directory. :
velorama -ds $dataset -dyn $dynamics -dev $device -l $L -hd $hidden -rd $rd Here, $dataset is the name of the dataset associated with the saved AnnData object. $dynamics can be "rna_velocity" or "pseudotime", depending on which data the user desires to use to construct the DAG. $device is chosen to be either "cuda" or "cpu". $rd is the name of the root directory that contains the saved AnnData object and where the outputs will be saved. Among the optional arguments, $L refers to the maximum number of lags to consider (default=5). $hidden indicates the dimensionality of the hidden layers (default=32).
We encourage you to report issues at our Github page ; you can also create pull reports there to contribute your enhancements. If Velorama is useful for your research, please consider citing bioRxiv (2022).