osm-activity 


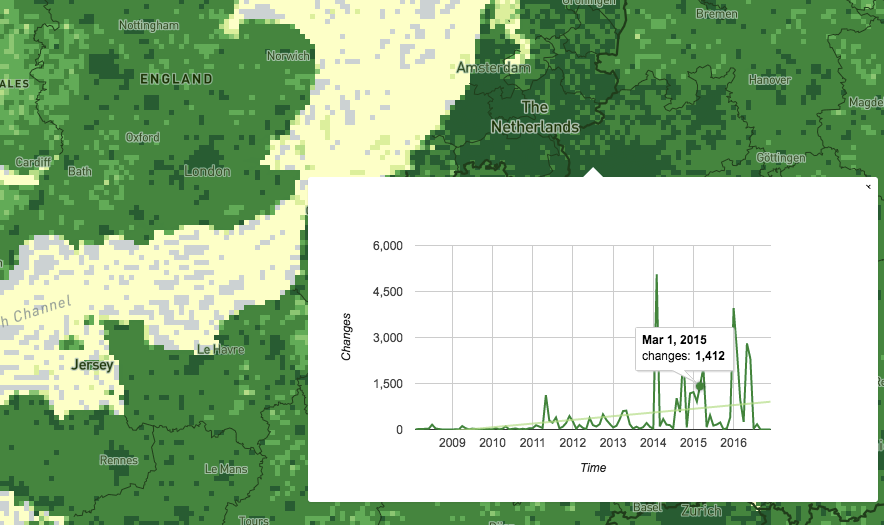
A map visualization of OpenStreetMap activity and a Tile Reduce processor to count the changes within a tile over the years, quarters and months.
Download
You can download the resulting GeoJSON file from the latest GitHub release. Please ping me if you require other data formats.
Run yourself
First install the required dependencies. You need to new Node version (> 5).
npm install
Now download the Mapbox QA Tiles.
curl -o planet.mbtiles.gz https://s3.amazonaws.com/mapbox/osm-qa-tiles/latest.planet.mbtiles.gz
gunzip planet.mbtiles.gz
Invoke the index.js file with the planet file and output GeoJSON file.
node index.js -m planet.mbtiles -o changes.geojsonScanning through the 2.5 million tiles on 40 cores takes 20 minutes to do the entire analysis.
Generate Vector Tiles
To create the heatmap visualization we create a point layer with the tiles for zoom level 1 to 4 and a polygon layer with the tiles for zoom level 5 (overzooming will ensure this also works for higher zoom levels).
First create the point GeoJSON file and strip away all attributes to minimize file size.
node index.js -m planet.mbtiles -o tile_updates_point.geojson --strip-history --pointNow we create the point MBTiles (and drop points at lower zoom levels).
tippecanoe tile_updates_point.geojson -o tile_updates_point.mbtiles \
    --minimum-zoom=1 --maximum-zoom=4 --base-zoom=4 --include=total
And now we create the polygon GeoJSON file (containing the tile geometries).
node index.js -m planet.mbtiles -o tile_updates_bbox.geojson --strip-historyAnd create the polygon MBTiles (do not drop any features and only a single zoom level)
tippecanoe tile_updates_bbox.geojson -o tile_updates_bbox.mbtiles \
    --minimum-zoom=5 --maximum-zoom=5 --base-zoom=5
We have two vector tile sets now for the low and high zoom levels we can style in Mapbox Studio.
Generate History JSON Tiles
To make the history of the tiles accessible via web we group them by their ancestor tile (zoom level 5). This makes it possible to request the history of a tile by querying it's ancestor.
You need to provide a non existing directory where the JSON history of the tiles is stored.
The directory will be structured into a folder structure z/x/y.json.
node index.js -m planet.mbtiles -o changes.geojson -j tilesThe tile history is hosted via GitHub pages.
http://osm-activity.lukasmartinelli.ch/tiles/history/{z}/{x}/{y}.json
Use Statistics
The script can track statistics and output them into a file with -s stats.json.
This records different percentile values and makes it useful to style with different data classes.
node index.js -m planet.mbtiles -o changes.geojson -s stats.json