This repository contains the scripts to run an experiment of the Retina paper.
A video showing this experiment running on CloudLab is available at https://youtu.be/cRYmYW9MF0o . The video is not self-sufficient to run the experiment yourself, it is a companion to these instructions.
For most experiments we used a TAP on the Stanford University traffic. However, for the Figure 6 experiment we used 2 machines in a client/server scenario, and a third machine acting as a TAP between those machines. That machine runs Retina and competing software. The thrid TAP machine will be referenced as the "DUT".
The experiment manager is NPF, allowing to easily deploy the scripts over a cluster, and re-run experiments for multiple points and variables. In this experiment we will, as in the paper, augment the offered HTTPS load and see how competing solutions perform.
Before running the experiments, you need to prepare your testbed according to the following guidelines.
For the results in the paper, we used our own 100G machines. We propose to use CloudLab, a publicly available machine provider for research purpose. In any cases you need Mellanox NICs (ConnectX 4-7 or BlueField 1-2). Hardware support for other NICs is untested.
The profile used for the machines is available at Retina-TAP .
This profile will build a ring of 3 machines. Both client and server use their second interface to mirror packets to the DUT running Retina. The machine uses Ubuntu 20.04.
Create an account on CloudLab then follow the link above and click on "instanciate". The profile has a parameter to set the machine type. You should select d6515 machines to have a 100G experiment. If none are available, then in general the c6525-25g are available. However it will run at 25G. We show how the experiment is affected in the graphs at the end of this page. No need to give a name to the experiment then click on Finish. The profile will automatically launch the bootstrap.sh script to install everything on all machines. After a dozen minutes, you will get the SSH command to jump to the server.
cd /mydata/retina-expe/
tail -f /local/logs/startup.log
Verify the last line is "Boostrap finished!", if not the script may still be running. It takes about 15 minutes to install all dependencies and continue despite the node being marked as "ready". The node will also reboot once to enable kernel cmdline options, such as CPU isolation and 1G huge pages.
You need 3 x86_64 machines with dual-port 100G Mellanox NICs (CX4 to CX7 or BF1-2). Other 100G NICs should work, but they're untested. Machine 1 and 2 should have their first interface connected together. Their second interface connected to port 0 and 1 of the third machine.
We recommand using Ubuntu 20.04 as this is what we used for all experiments.
We provide a script to automatically build dependencies, configure hugepages, ... It works on ClouldLab, and should work on your Ubuntu testbed too.
This is already run on the cloudlab profile, you have nothing to do when using CloudLab.
Run ./bootstrap.sh on all machines to install all dependencies at once. This will only work with Ubuntu (preferably 20.04).
You can install npf via the following command:
python3 -m pip install --user npf
Do not forget to add export PATH=$PATH:~/.local/bin to ~/.bashrc or ~/.zshrc. Otherwise, you cannot run npf-compare and npf-run commands.
NPF will look for cluster/ and repo/ in your current working/tests directory. We have included the required repo for our experiments and a sample cluster template, available at experiment/. To setup your cluster, please check the guidelines for our previous paper. Additionally, you can check the NPF documentation at https://npf.readthedocs.io/.
Follow https://github.com/stanford-esrg/retina/blob/main/INSTALL.md
Install Suricata if you want to reproduce the comparison test against Suricata. You need the "master" version, as the DPDK support is in no release yet. You need the modified version available at git clone https://github.com/tbarbette/suricata.git which enables precise packets statistics to be exported. Else the parsing python script will not work.
sudo apt-get -y install python3 python3-pip build-essential meson pkg-config libnuma-dev python3-pyelftools libpcap-dev libclang-dev libyaml-dev  libpcre3 libpcre3-dbg libpcre3-dev libpcap-dev   \
                libnet1-dev libyaml-0-2 libyaml-dev pkg-config zlib1g zlib1g-dev \
                libcap-ng-dev libcap-ng0 make libmagic-dev         \
                libnss3-dev libgeoip-dev liblua5.1-dev libhiredis-dev libevent-dev libjansson-dev liblz4-dev libpcre2-dev
cargo install --force cbindgen
git clone https://github.com/tbarbette/suricata.git
pushd Suricata
#Build libhtp
git clone https://github.com/OISF/libhtp
pushd libhtp
./autogen.sh && ./configure && make && sudo make install
popd
./autogen.sh
./configure --enable-dpdk
make
sudo make install
Our experiments use NPF, a tool to manage experiments, run the tests over a cluster and collect results.
NPF needs passwordless sudo access through SSH to all machines. This is already provided if using the CloudLab image.
NPF uses a test description files that gives variables, scripts, setup phase script, where to run what, ... It is the file http.npf in this repository.
At the first run, NPF will build some dependencies by itself, such as FastClick to compute baseline speeds and WRK to generate HTTP(S) load. Then NPF will run some initialization scripts on all machines. Installing NGINX on "server", configuring IPs, ...
Then for all values of given variables, NPF will run scripts on all machines. In the first experiment for instance, we re-run the same test but with 25 generation rates. Each test is run 3 times. And this is done for all "series" (baseline, Retina, Suricata, ... think of it as lines in a plot).
If you re-launch NPF, it will not re-run tests for variables already tried. For instance, if you try a first run with CPU=1, then re-try CPU=[1*8], only the tests for CPU=2 to 8 will run. The results from 1 will be taken in the cache. If you want to force re-running the test, use --force-retest.
Then some cleanup python scripts are done after each run, to parse results from logs and export it in the NPF format.
After all tests, NPF will automatically produce some graph. You can add --output out.csv to generate some CSVs on top of the graphs.
Here is each argument of the command line explained line by line:
	npf-compare
	 "local+fastclick,SAMPLE=pkt_count:Link speed" #The first series to try : a baseline that only counts packets
	  local+retina:Retina #The second series : Retina itself
	  --test http.npf #The test script
	  --cluster #The NPF scripts define "roles" such as client and server. Here you tell which machine will take which roles.
			client=node-0-ctrl,nfs=0 #The "client" will be the machine named node-0-ctrl. It is not using NFS so we have to copy everything to the machine
			server=node-1-ctrl,nfs=0
			dut=node-2-ctrl,nfs=0
	--show-full  #Show stdout and stderr in live, will create a lot of outputs but will tell you what's happening
	--show-cmd  #Show the command launched and where
	--variables #Override a few variables that will define the parameters of the experiment
		 "CPU=1" #Number of CPU to use
		 "SAMPLE=log_tls" #The test app to run
		 "DPDK_PATH=$DPDK_PATH" #Env variables will not pass through ssh and sudo. We have to pass them explicitly
	--graph-filename ssl.pdf # basename for the generated graphs
	--tags ssl tls rate high #Tags according to the experiment, see http.npf
Warning: if using the CloudLab c6525-25g nodes, add the ",nic=1+2" parameter to each node. Eg client=node-0-ctrl,nfs=0,nic=1+2. This is because NPF detects the NICs on the cluster machines, but those nodes use 25G mellanox NICs for both experiment and control, therefore NPF's interface 0 is actually the control NIC. Failure to do so will break the node connectivity. The only solution will therefore be to powercycle the node through the CloudLab interface.
Important: Run NPF from the dut node. (node-2 on cloudlab) this is needed because NPF has currently no way to retrieve files over SSH before running the python parsing script. Performance won't be very affected by the few python instructions, especially if using isolcpus (this is the case on cloudlab).
The final command to run is therefore
	cd /mydata/retina-expe/
	source /local/env
	npf-compare "local+fastclick,SAMPLE=pkt_count:Link speed" local+retina:Retina local+suricata:Suricata --test http.npf --cluster client=node-0-ctrl,nfs=0 server=node-1-ctrl,nfs=0 dut=node-2-ctrl,nfs=0 --cluster-autosave --variables "CPU=1" "SAMPLE=log_tls" "DPDK_PATH=$DPDK_PATH" "GEN_RATE=[5000-30000#5000]" --graph-filename ssl.pdf --graph-size 6 3 --tags ssl tls rate --show-full --show-cmd
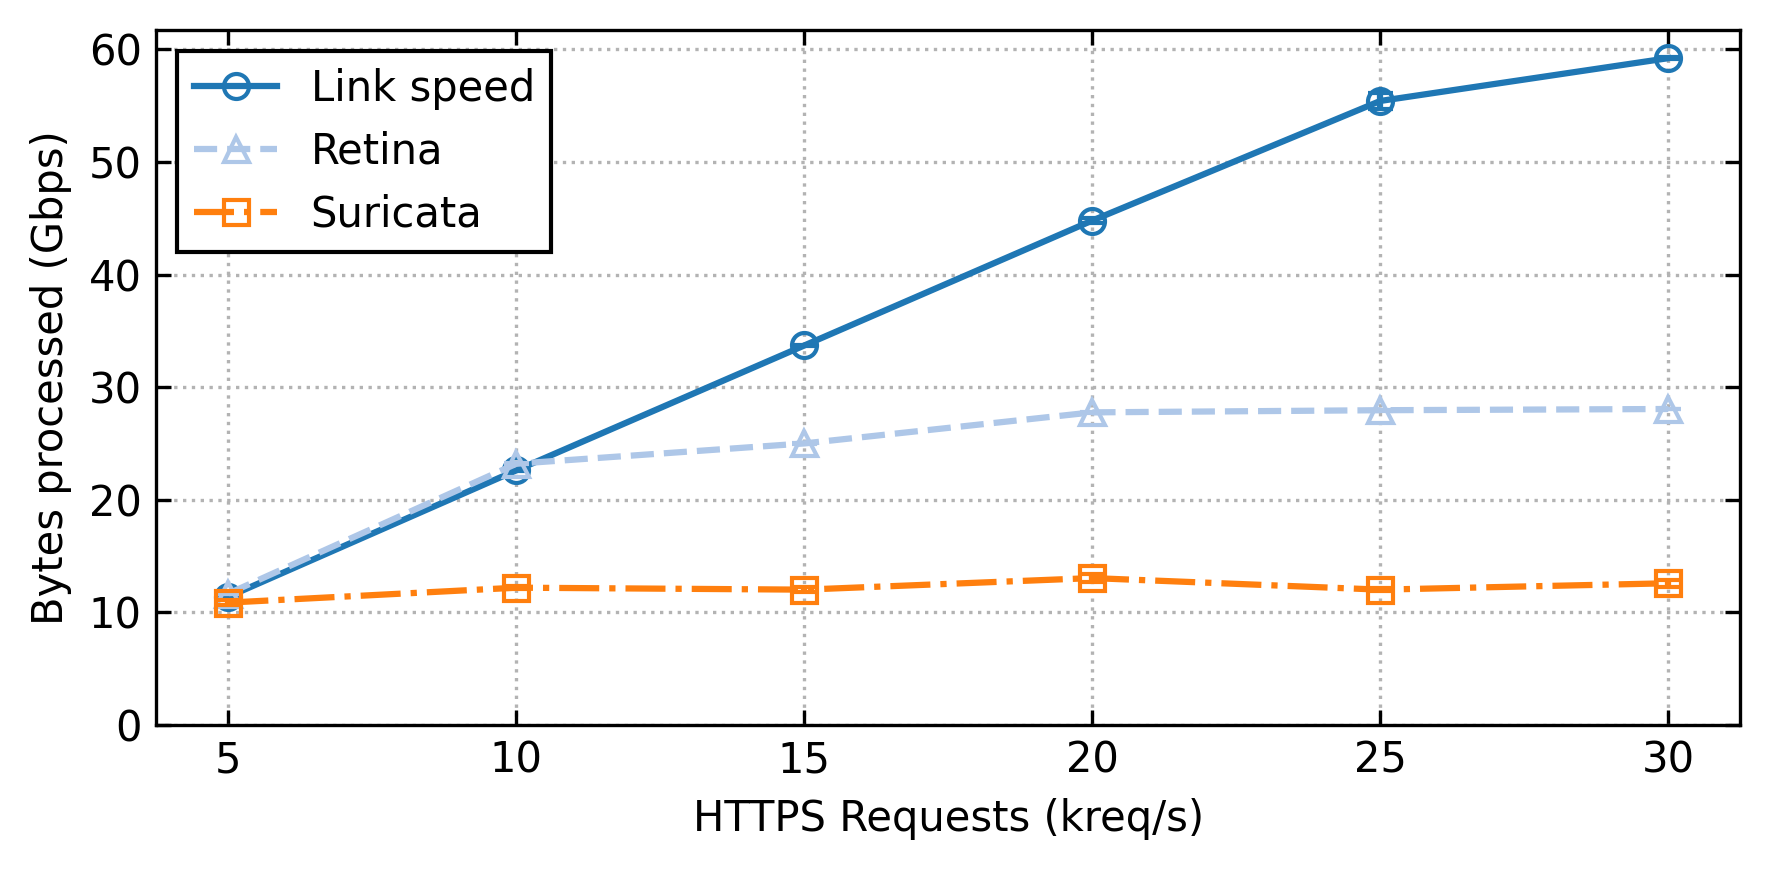
NPF will produce a few PDF graphs, the ssl-avg_good_bps.pdf should look like the image below.
The tot_dropped_pkts graph shows the number of packets dropped, and pc_dropped_pkts gives the percentage of packets dropped. Not all statistics are given by all programs. However lines may be missing from some of those plots. Figure 6 in the paper is avg_good_bps with dashed lines if pc_dropped_pkts > 1%.
The THROUGHPUT, LATENCY, REQUEST, NBREQ and HTTPTIMEOUT graphs concerns the generator, they should be constant and are of little interest.
The scripts for Snort, Zeek and tcpdump are also available, but as shown in the paper they do not perform better. Suricata is the closest "competitor" though without being as flexible as the Rust callbacks. Retina is not an IDS.
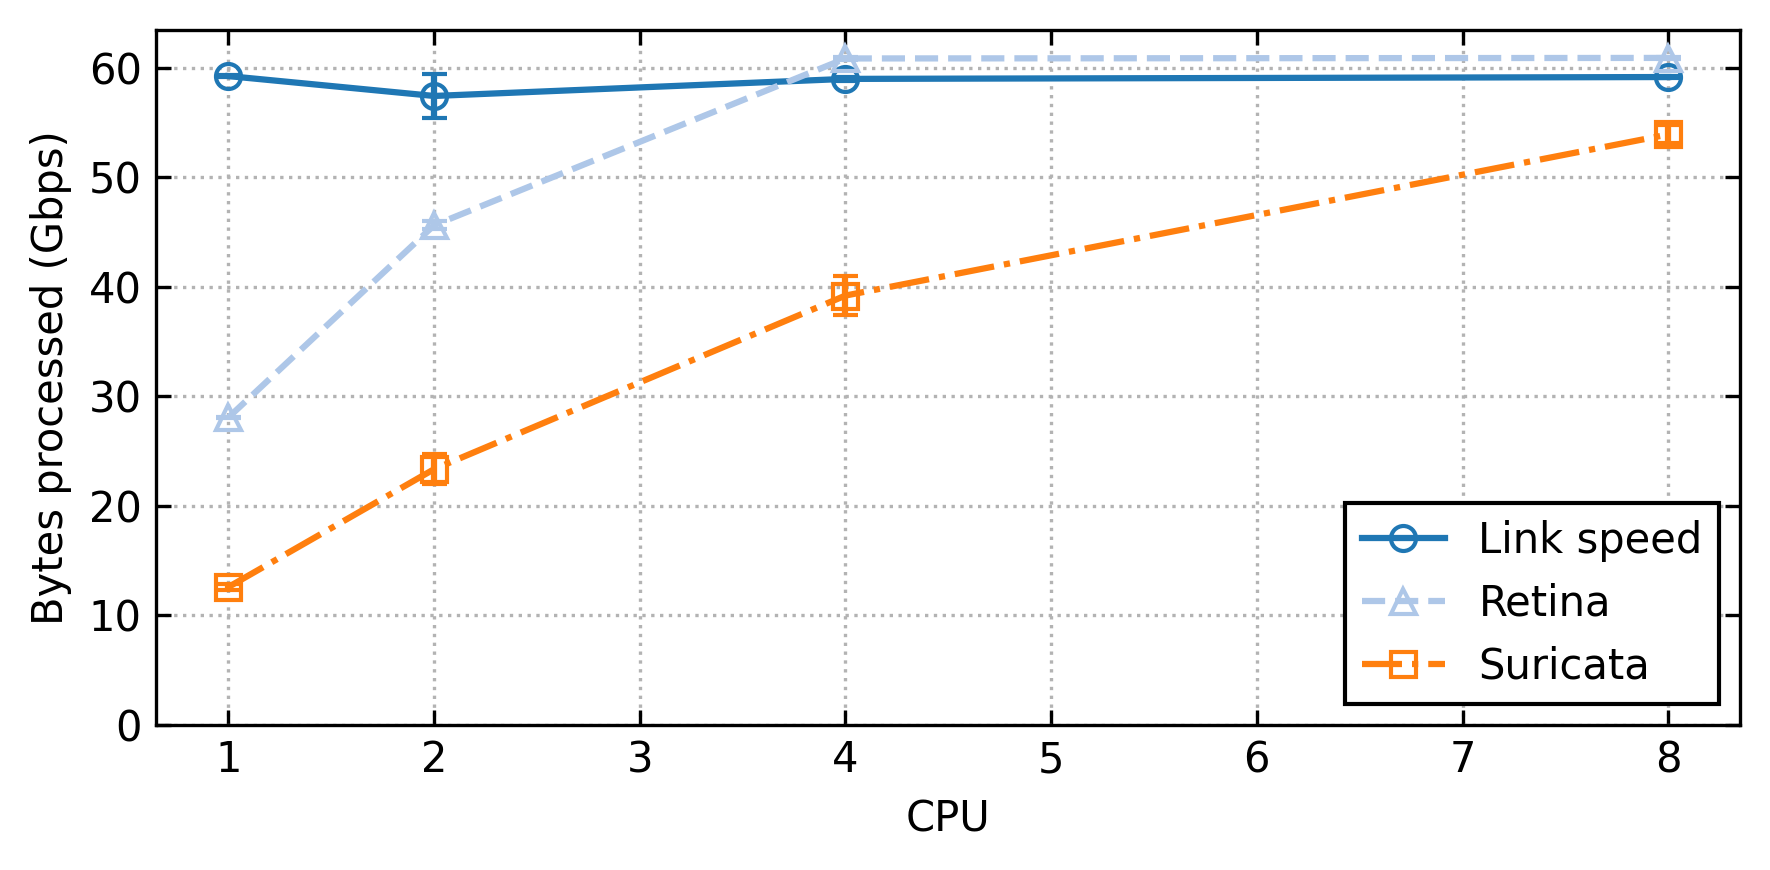
Simply change variables to explore other spaces, for instance how those system scale with multiple cores. Change CPU=1 "GEN_RATE=[5000-30000#5000]" per "CPU=[1*8]" "GEN_RATE=30000", and set --graph-filename cpu.pdf
This result is not in the paper. CloudLab's CPUs are performing worse than our Intel CPUs. With our testbed, two cores were more than enough to have Retina reach the testbed limits. Snort is also not multithreaded so it would just be a point on the left of the graph. Zeek needs a different setup to scale. All in all this experiment did not add much information except about how "competitors" scale, which is not the intended point.
We tuned every competing software as best. If you think we should enable, for instance, a magic option in Suricata to be fairer in our comparison, you can easily do so. The full suriacata.yaml config is generated for each experiment from http.d/suricata.npf. Change what you desire, if possible, using a $VARIABLE.
Then re-run the same NPF command, only with local+suricata:Suricata in the first arguments (the repo list) and add --variables "VARIABLE={OLD,NEW}" --force-retest. This will create a plot comparing the OLD and NEW value.
If in a hurry, add --config n_runs=1 to do only one run per variables.
With the 25G machines, providing you did the "nic=1+2" modification everything will work the same, except Retina will match the line rate as the testbed tops at 25G:
We also propose a Docker image to try Retina on a physical interface, without the hassle but without the performance too.
We would like to thank the CloudLab[1] people that enabled the reproducibility of this experiment with their shared infrastructure.
[1] Duplyakin, D., Ricci, R., Maricq, A., Wong, G., Duerig, J., Eide, E., ... & Mishra, P. (2019). The Design and Operation of CloudLab. In 2019 USENIX annual technical conference (USENIX ATC 19) (pp. 1-14).


