A tool for visualizing Splotch results.
A custom version of Spav is used on https://als-st.nygenome.org.
Spav currently supports five different interactive views for visualizing and exploring Splotch results.
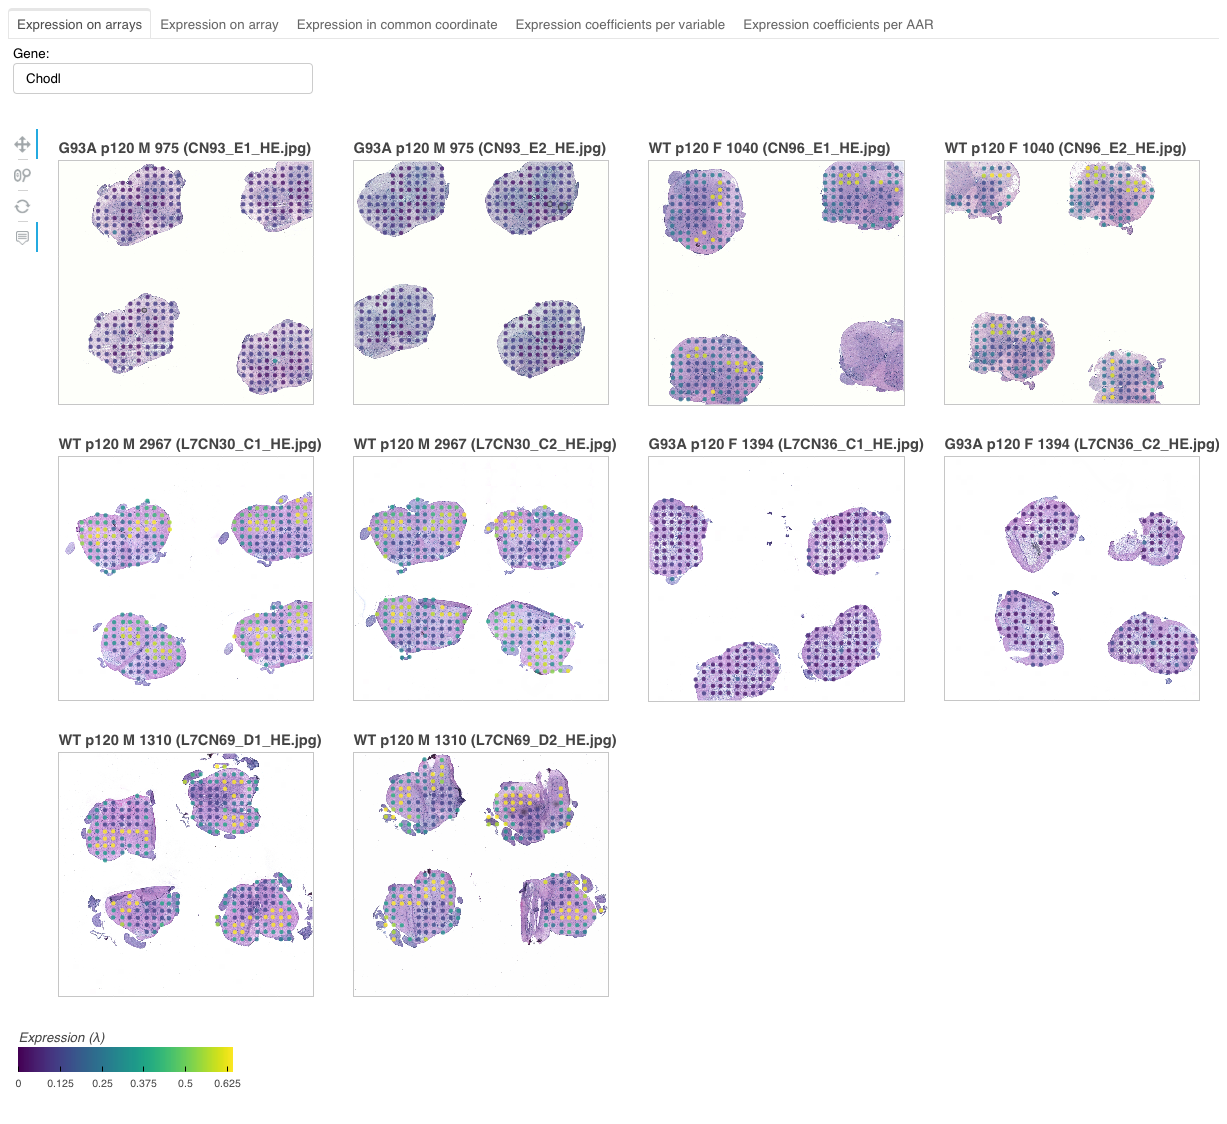
This view visualizes expression estimates on all the arrays simultaneously.
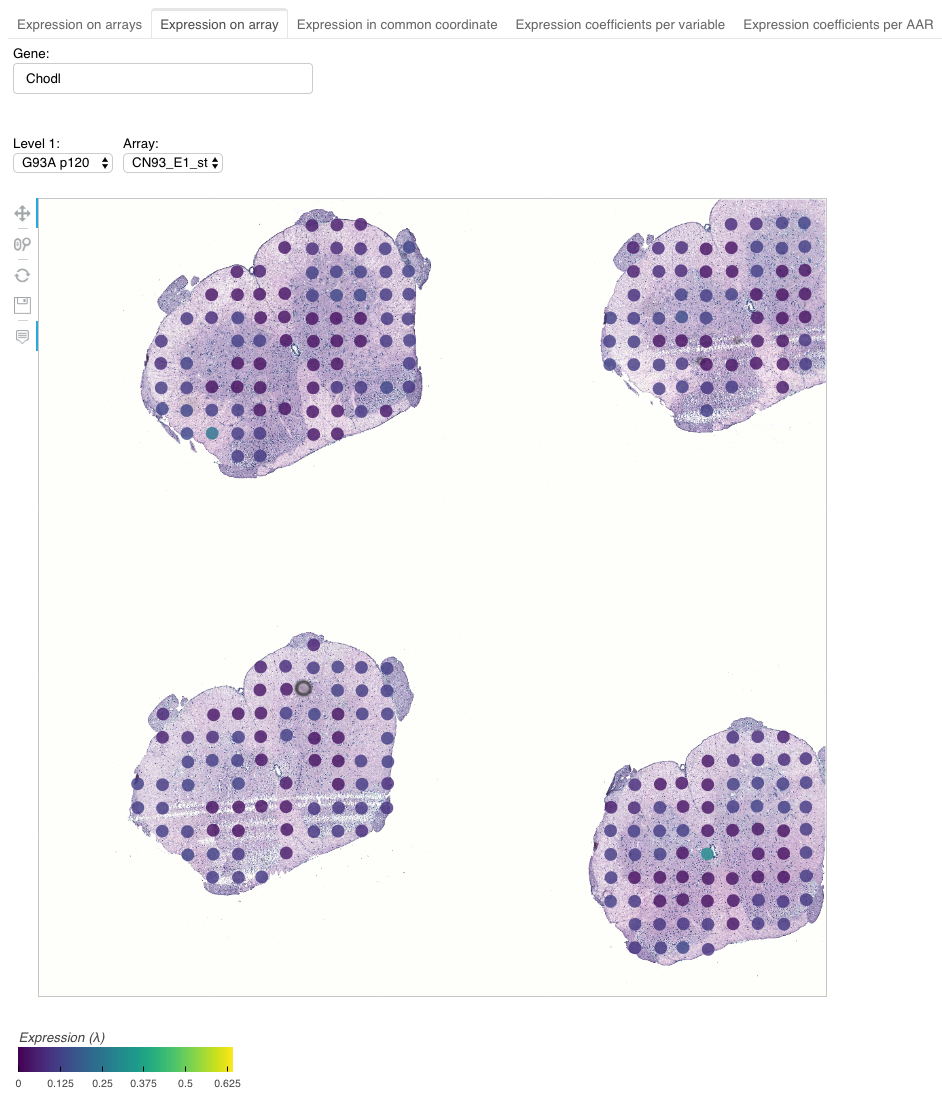
This view visualizes expression estimates on a selected array. The user can filter arrays based on the level 1 information (see Splotch).
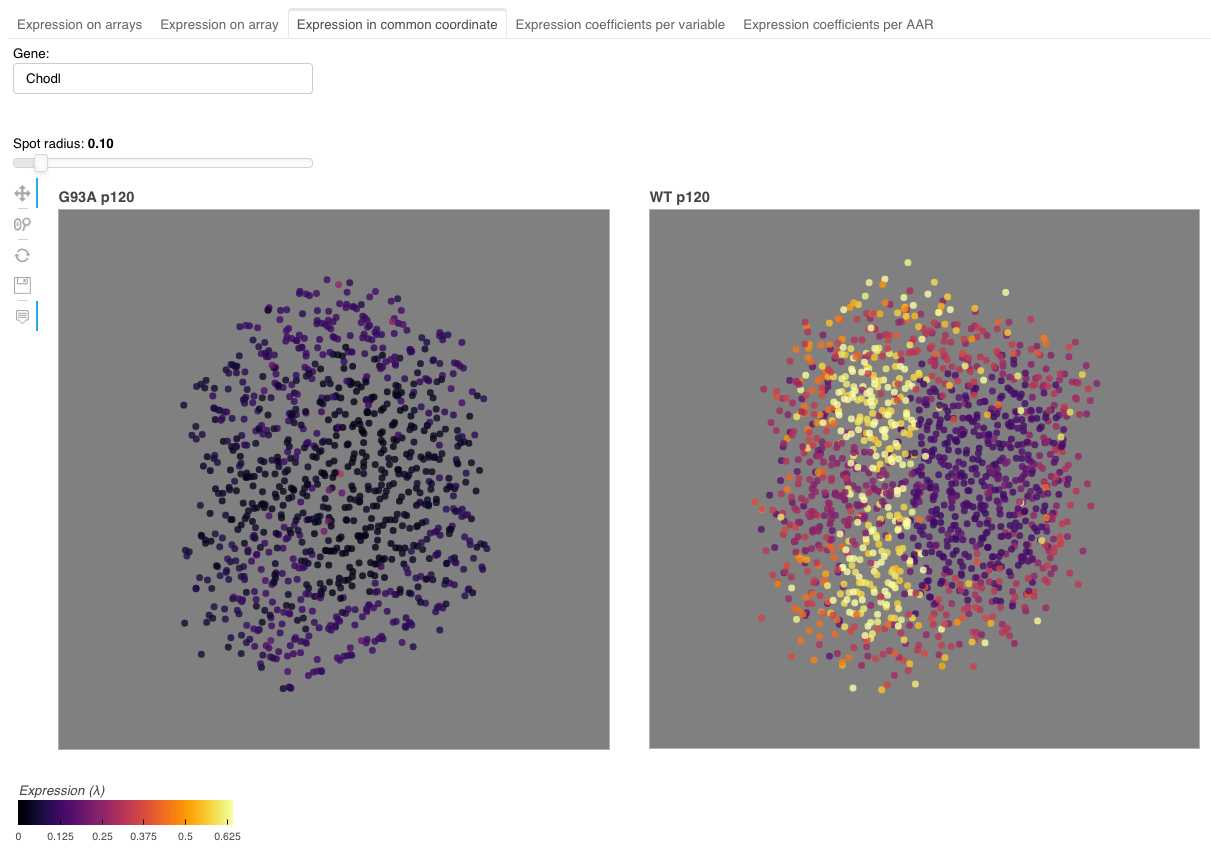
This view visualizes expression estimates in common coordinate system. The expression estimates are separated based on the level 1 information.
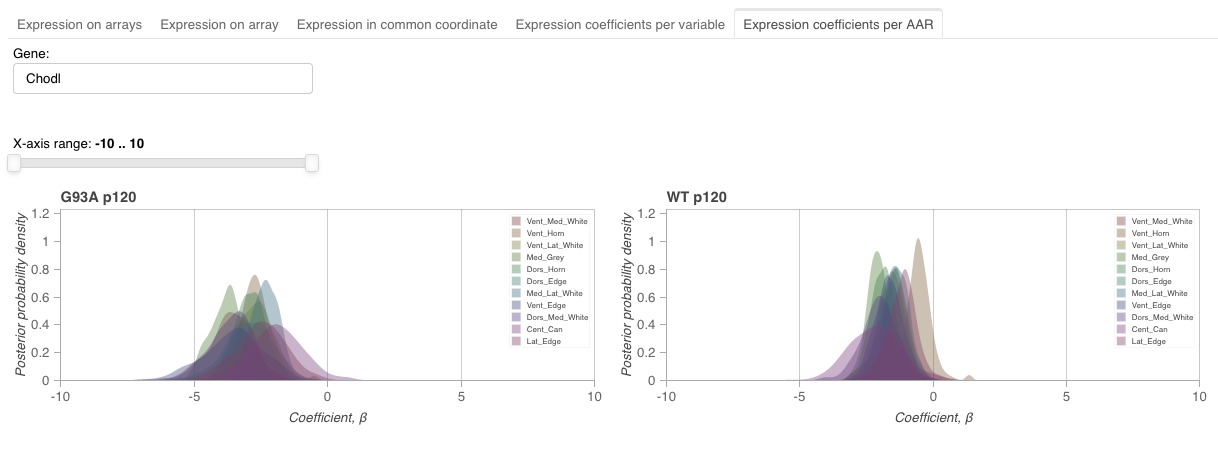
This view visualizes expression coefficients across level 1 variables for each AAR.
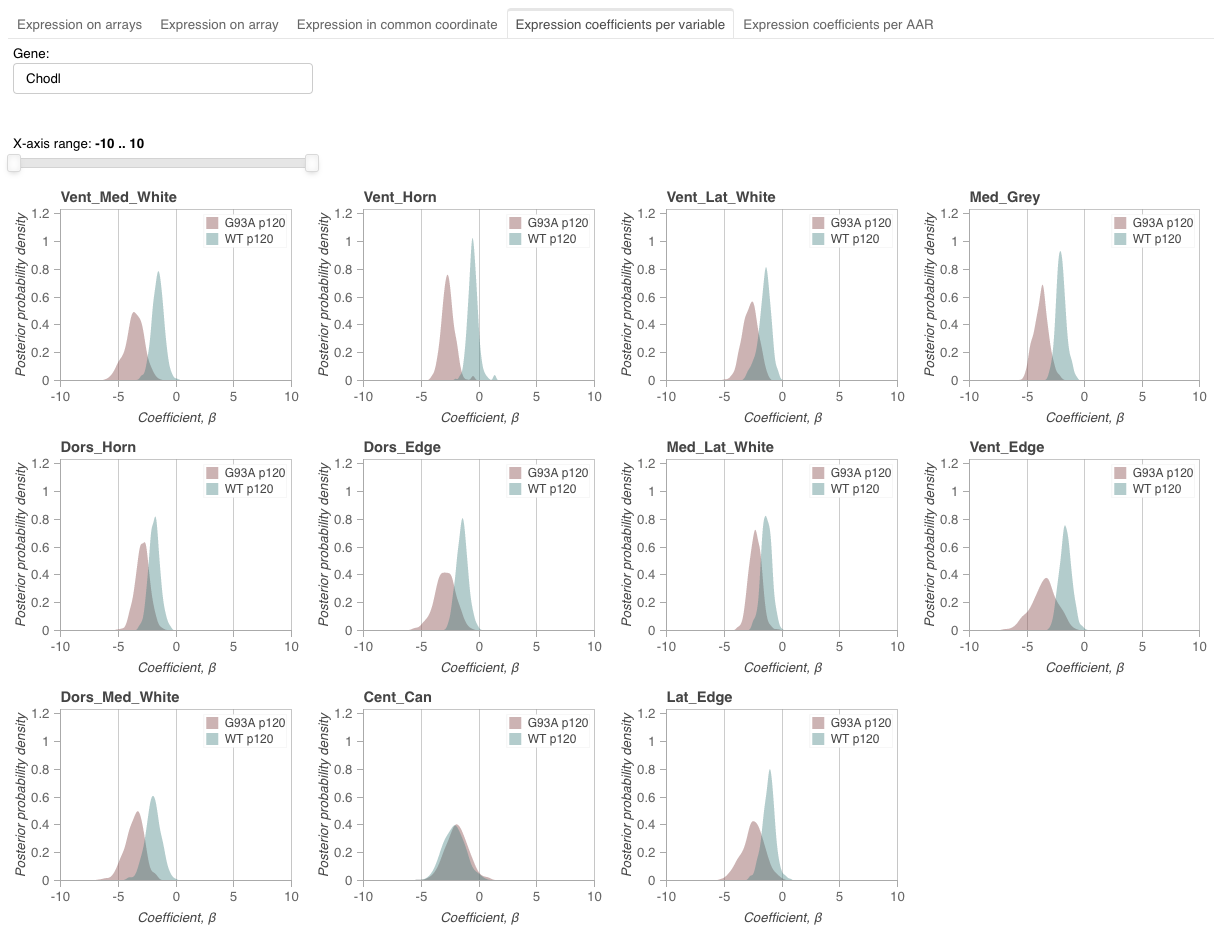
This view visualizes expression coefficients across AARs for each level 1 variable.
Spav has been tested on Python 3.7.
Spav can be installed as follows
$ pip install git+https://git@github.com/tare/Spav.gitThe script spav_prepare_data can be used for preparing the Splotch results to be used with Spav
$ spav_prepare_data --help
usage: spav_prepare_data [-h] -d DATA_DIRECTORY -o OUTPUT_DIRECTORY -s
                         SERVER_DIRECTORY [-c] [-v]

A script for preparing Splotch results for Span

optional arguments:
  -h, --help            show this help message and exit
  -d DATA_DIRECTORY, --data-directory DATA_DIRECTORY
                        data directory
  -o OUTPUT_DIRECTORY, --output-directory OUTPUT_DIRECTORY
                        output directory
  -s SERVER_DIRECTORY, --server-directory SERVER_DIRECTORY
                        server directory
  -c, --no-copy         create symbolic links instead of copying images
  -v, --version         show program's version number and exit
For instance, if your Splotch input and output directories are $DATA_DIRECTORY and $OUTPUT_DIRECTORY (see Splotch), respectively, then you can prepare the data for Spav by executing the following command
$ spav_prepare_data -d $DATA_DIRECTORY -o $OUTPUT_DIRECTORY -s $SPAV_DIRECTORYThis command will create the directories $SPAV_DIRECTORY/static and $SPAV_DIRECTORY/data.
The directory $SPAV_DIRECTORY/static contains symbolic links pointing to the bright-field images and the $SPAV_DIRECTORY/data.hdf5 file contains the estimates.
For detailed description of how run a Bokeh server, please see https://bokeh.pydata.org/en/latest/docs/user_guide/server.html.
The script server/main.py implements our Bokeh application
$ python main.py --help
usage: main.py [-h] [--arrays] [--array] [--common-coordinate]
               [--aar-coefficients] [--level-coefficients] [-v]

Spav server

optional arguments:
  -h, --help            show this help message and exit
  --arrays              show the array view
  --array               show the arrays view
  --common-coordinate   show the common coordinate view
  --aar-coefficients    show the aar coefficient view
  --level-coefficients  show the level coefficient view
  -v, --version         show program's version number and exit
Additionally, the directory server contains theme.yaml and templates/index.html.
First, let us copy the files from the directory server to the directory we created using the spav_prepare_data script
$ cp -r server/* $SPAV_DIRECTORY/ Second, the Bokeh application with all the implemented views can started by executing the following command
$ bokeh serve $SPAV_DIRECTORY --show --args --arrays --array --common-coordinate --aar-coefficients --level-coefficientsPlease see Notebook.ipynb.
