A project to test unconventional ways to visually present data
A simple, web application that takes arbitrary login details and allows the user to choose a set of data that is visually represented with a graph. Each set of data has been portrayed with an 'out of the ordinary' graph.
The data has been provided as part of a coding task to visualise the representation of investment related key words.
- General:
- HTML5
- CSS3
- Sass
- React
- Others:
- GitHub
- 3rd party packages:
- Rechart
-
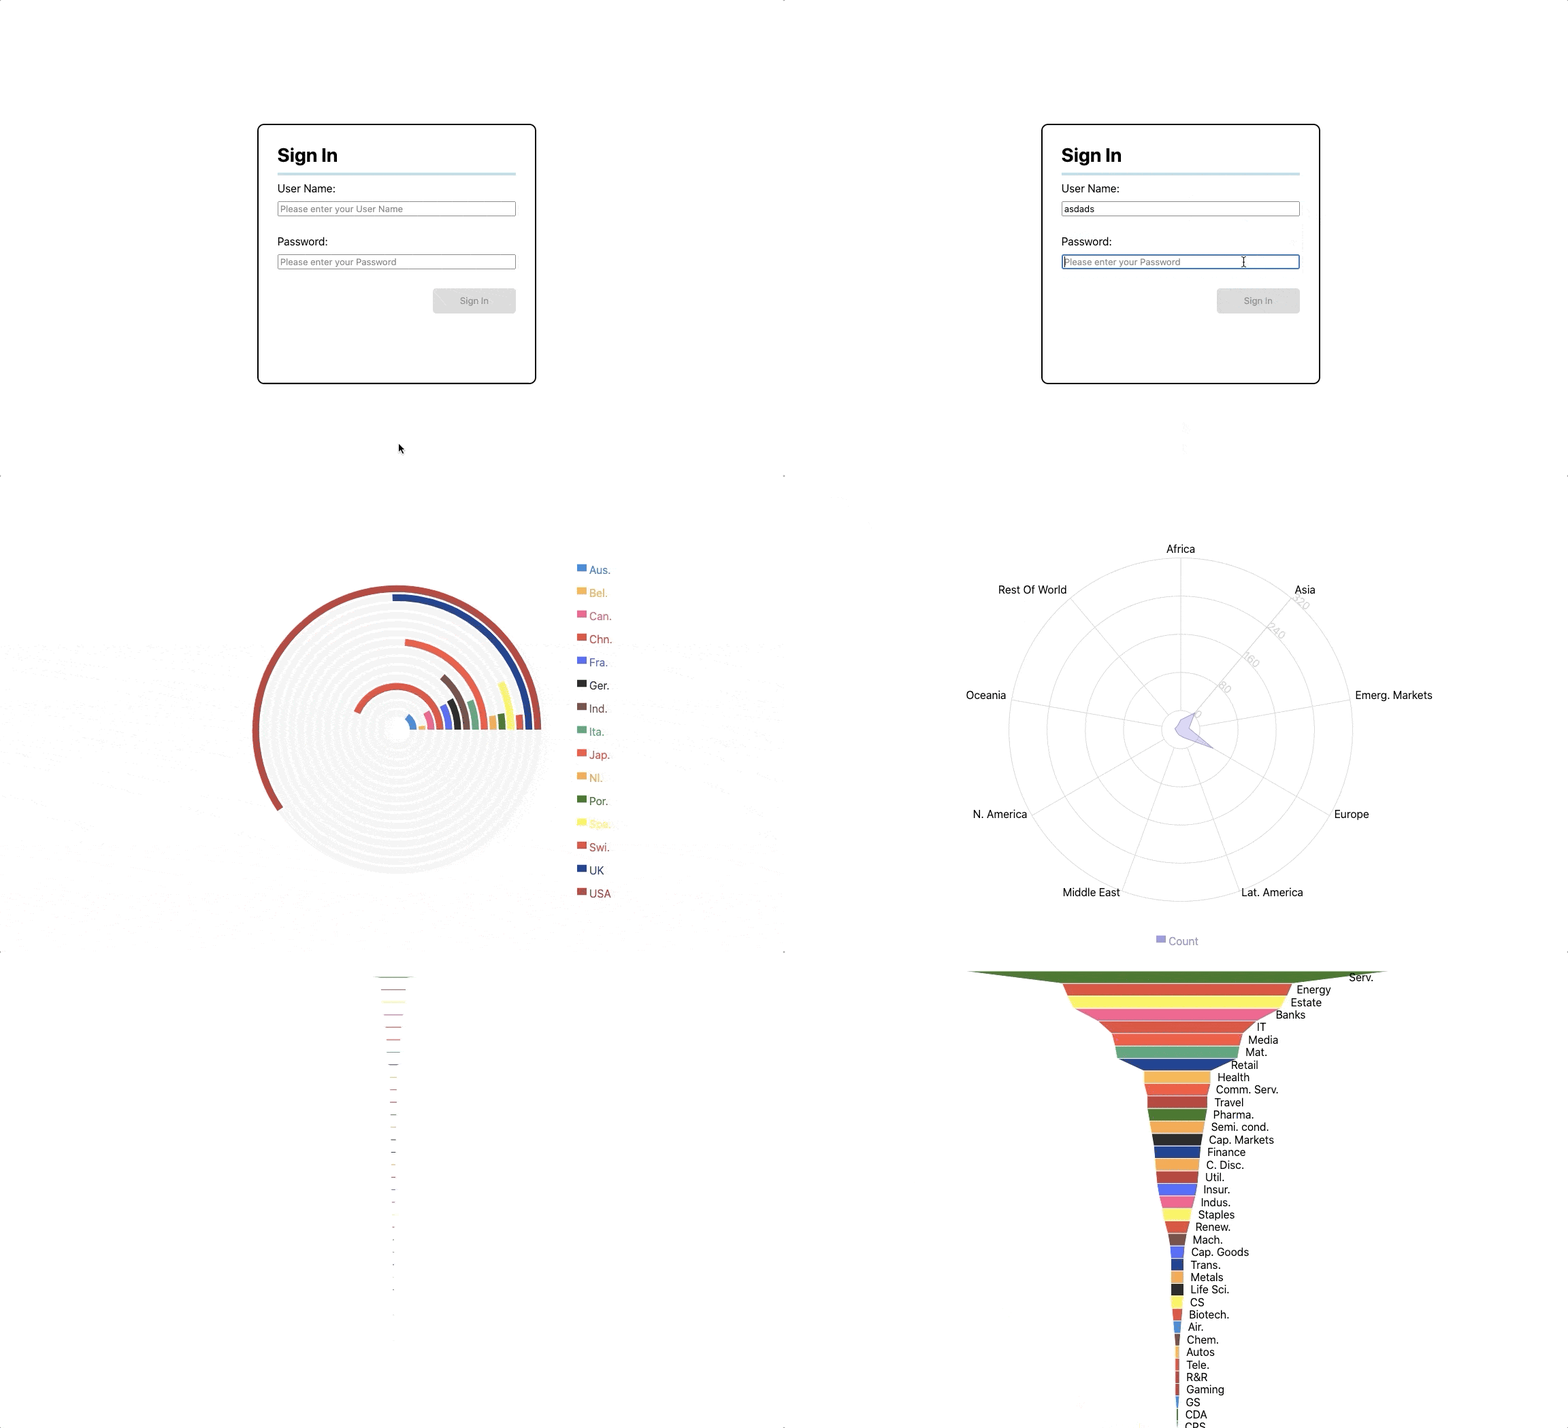
I started by building the basic Front-End components i.e. 'Log-In', 'Choice Buttons'
-
For the 'Log-In' component, I also added a functionality to disable the 'Sign in' button should there be no inputs for the 'Username' and 'Password' fields. This acts as a basic form validation
-
Next, I hard-coded the data that was provided to me before test building a basic graph
-
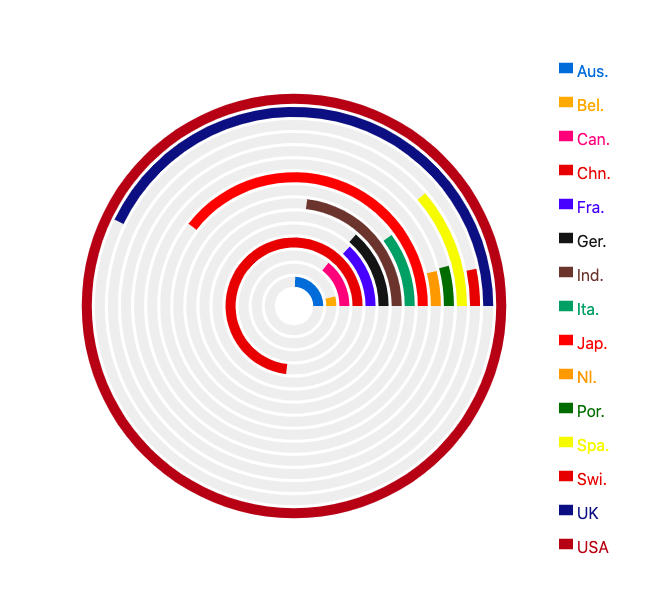
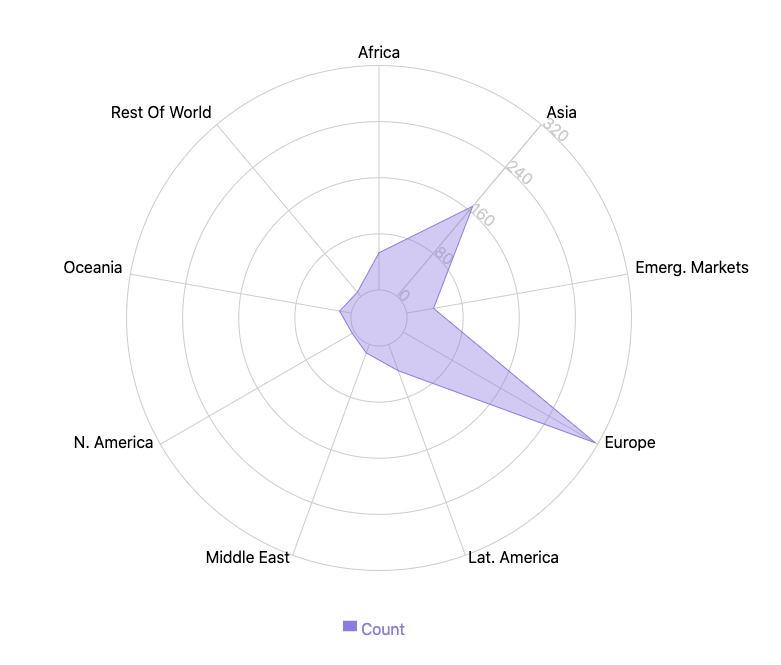
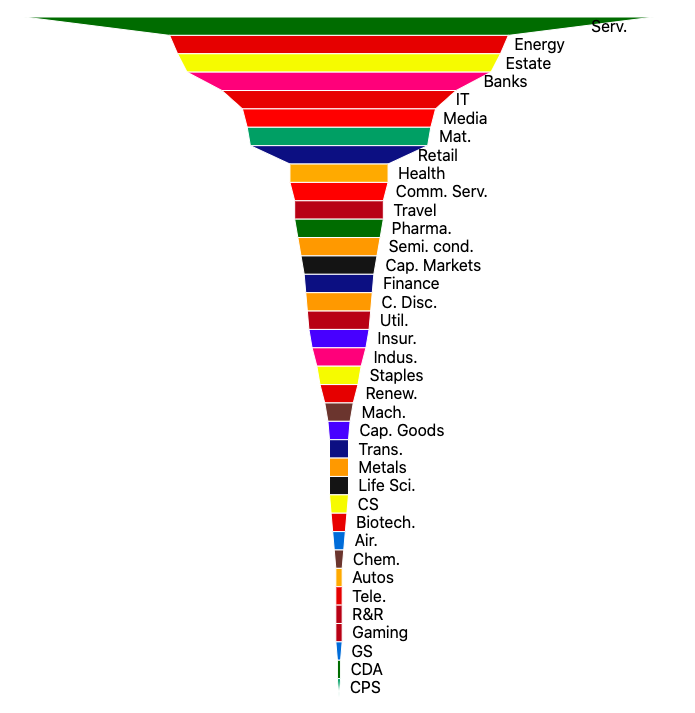
Finally, I chose 3 different graphs that are unique/unconventional yet still accurately presents the data
- GitHub repository containing project code
- Readme document containing thought processes and any assumptions made
- A simple, web application which takes a 'username' and 'password', upon successful log in, user can see data represented on a graph
The biggest win in this project was learning to use 3 new, unconventional (Radial Bar Chart, Funnel Chart, Radar Chart) but very powerful visual forms of data representations.
In the process, further building on my existing knowledge of the 'Recharts' library and adding additional forms of data representation to my toolkit.
If you wish to run it locally, you will need to follow the steps below:
- Fork or Clone the GitHub repository (https://github.com/tams2429/graph-visual-test),
- In the root project folder, run
npm installto install all dependencies, npm startto start the development server for the whole application,


