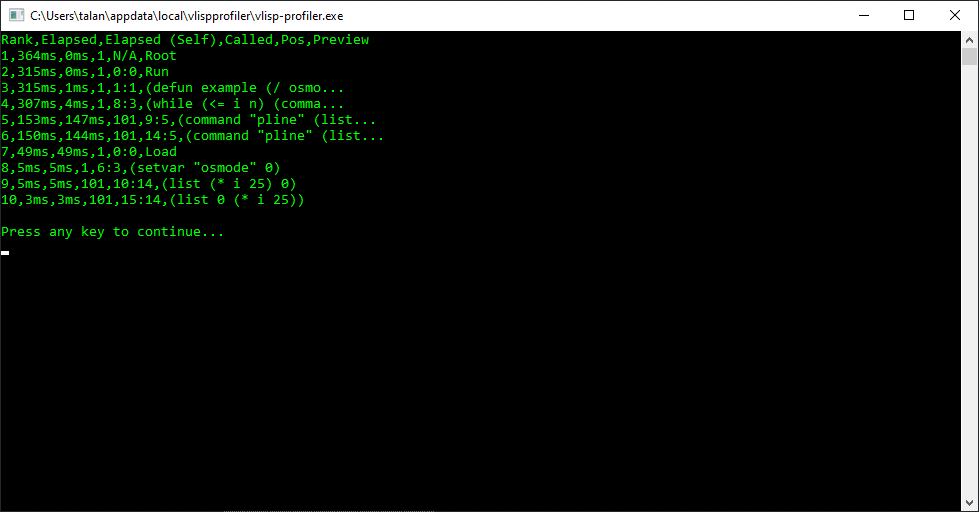
VLispProfiler is a tool for AutoCAD to measure the performance of applications built with Visual LISP.
Use this tool to see where your application is spending it's time and guide where you should optimize.
Requires AutoCAD 2011+ Full (not LT) to use.
- Easy to use installer that automatically sets up AutoCAD.
- One simple to use AutoCAD command:
prof. - Profile your LISP files and optionally specify an entry function.
- Reported output includes: elapsed time, self-elapsed time, run count, and file position.
- Interactive setup program for advanced configurations.
- Installs to current user, no admin required.
Download and run the latest installer. See Releases.
- Open AutoCAD
- Type
prof - Select a LISP file to profile.
- Type in an entry function, leave empty and press
Enterif the file doesn't have one. - Observe profiling results.
Use this method when there's no entry function in your file.
For example: when (load "file") loads and runs your program.
Use this method when there's an entry function in your file.
For example: when (load "file") loads your program and you follow it up with (entry-func) to run your program.


