Predicting the stock price has been researched for long. Now many people try to predict stock price with the machine learning algorithms, but there is not a single answer for this and it is still challenging problem.
It is also known that every country's stock market influences each other. In this project, I am going to predict the stock price in Japan with the data of US stock price and USD/JPY exchange rates.
LSTM is a one kind of the RNN (Recurrent neural network), capable of learning long-term dependencies. Both RNN and LSTM has the repeating module of neural network. RNN repeats it very simple structure, but LSTM repeats it with special way. So that LSTM can remember with longer context, and it is the reason to use LSTM for this problem.
Benchmark model is made by the DummyClassifier. The MSE (Mean Squared Error) of the prediction should be less than the benchmark score.
The data I am going to use is Nikkei 225, NASDAQ and USD/JPY currency data.
The data starts from January 1950 to current date. This data can be obtained at Quandl.
The input feature data is the change rate from the previous day of Nikkei 225.
The data starts from January 2003 to current date. This data can be obtained at Quandl.
The input feature data is the change rate from the previous day of the NASDAQ index.
The data starts from March 1991 to current date. This data can be obtained at Quandl.
The input feature data is the change rate from the previous day of the JPY/USD exchange rate.
Please download the csv data from Quandl.
- Nikkei225: https://www.quandl.com/data/NIKKEI/INDEX-Nikkei-Index
- NASDAQ: https://www.quandl.com/data/NASDAQOMX/COMP-NASDAQ-Composite-COMP
- Currency Exchange(JPY/USD) https://www.quandl.com/data/CURRFX/USDJPY-Currency-Exchange-Rates-USD-vs-JPY
Add /data directory and locate the downloaded files under /data directory.
$ docker build -t stock-price-predictor .
$ docker run -it stock-price-predictor python main.py-
Prediction result with Epochs: 100, hidden_neurons: 50
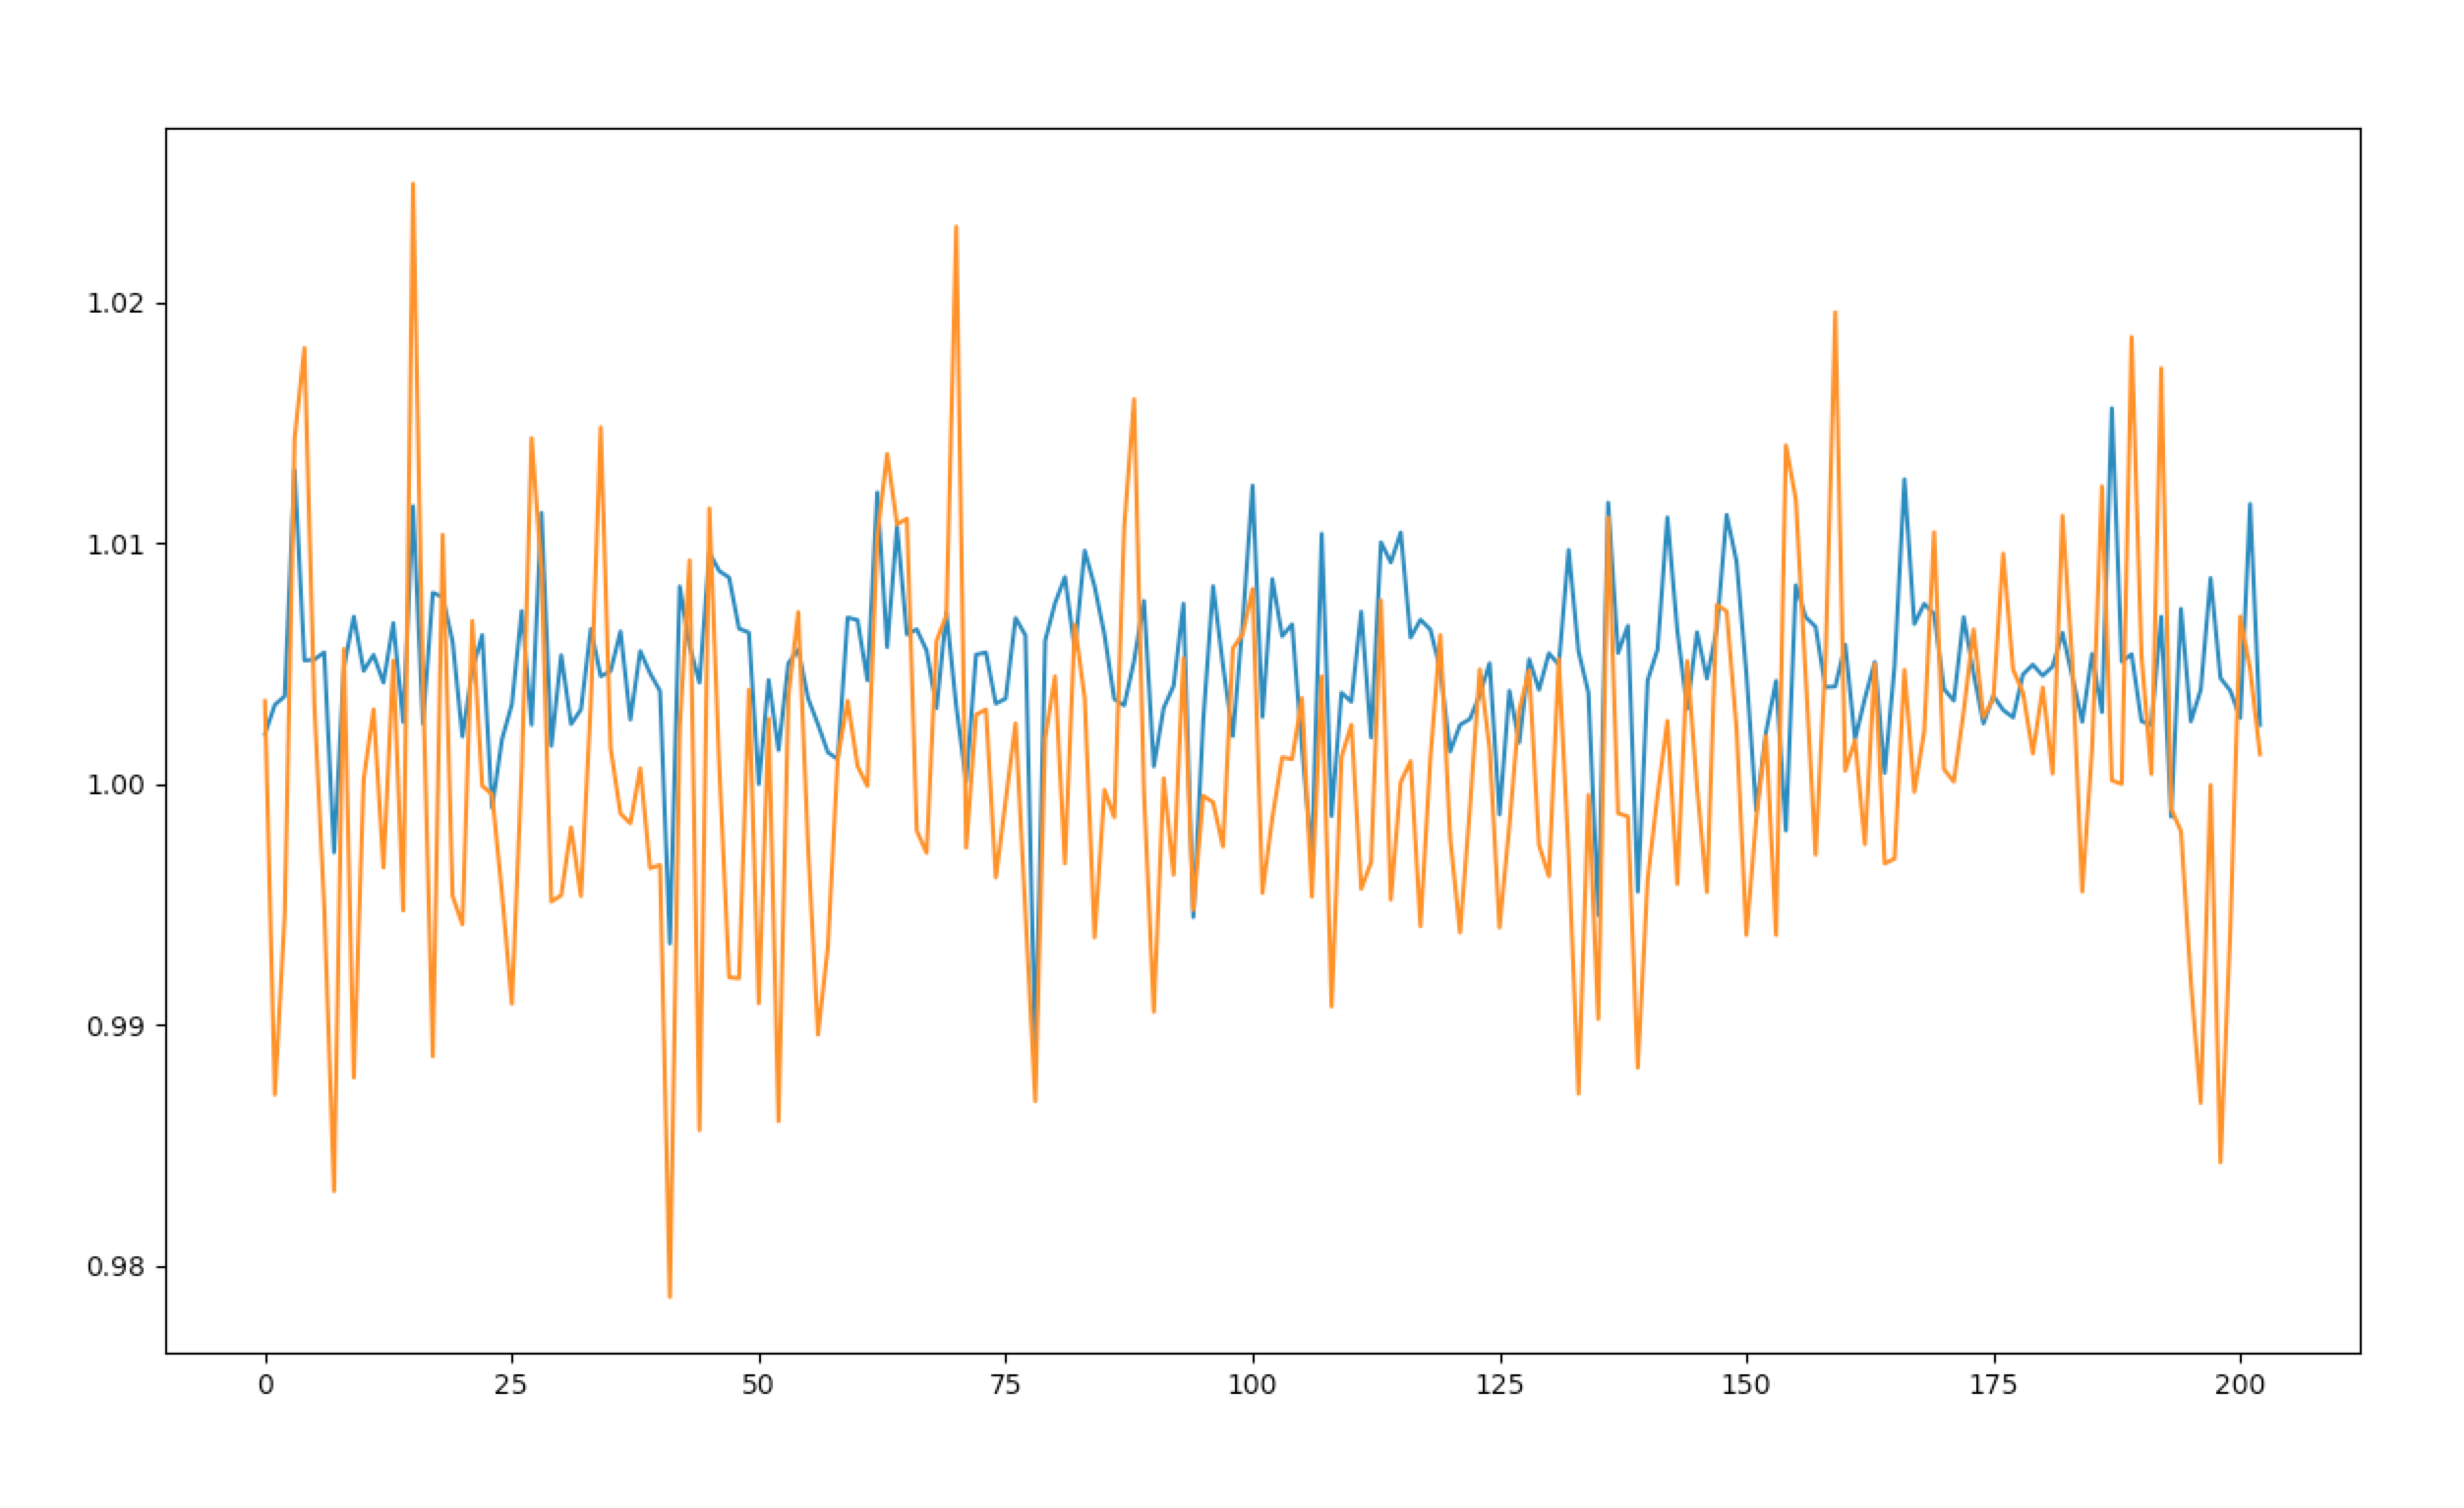 (Blue: Predicted, Orange: Actual)
 -
Prediction result with Epochs: 300, hidden_neurons: 50
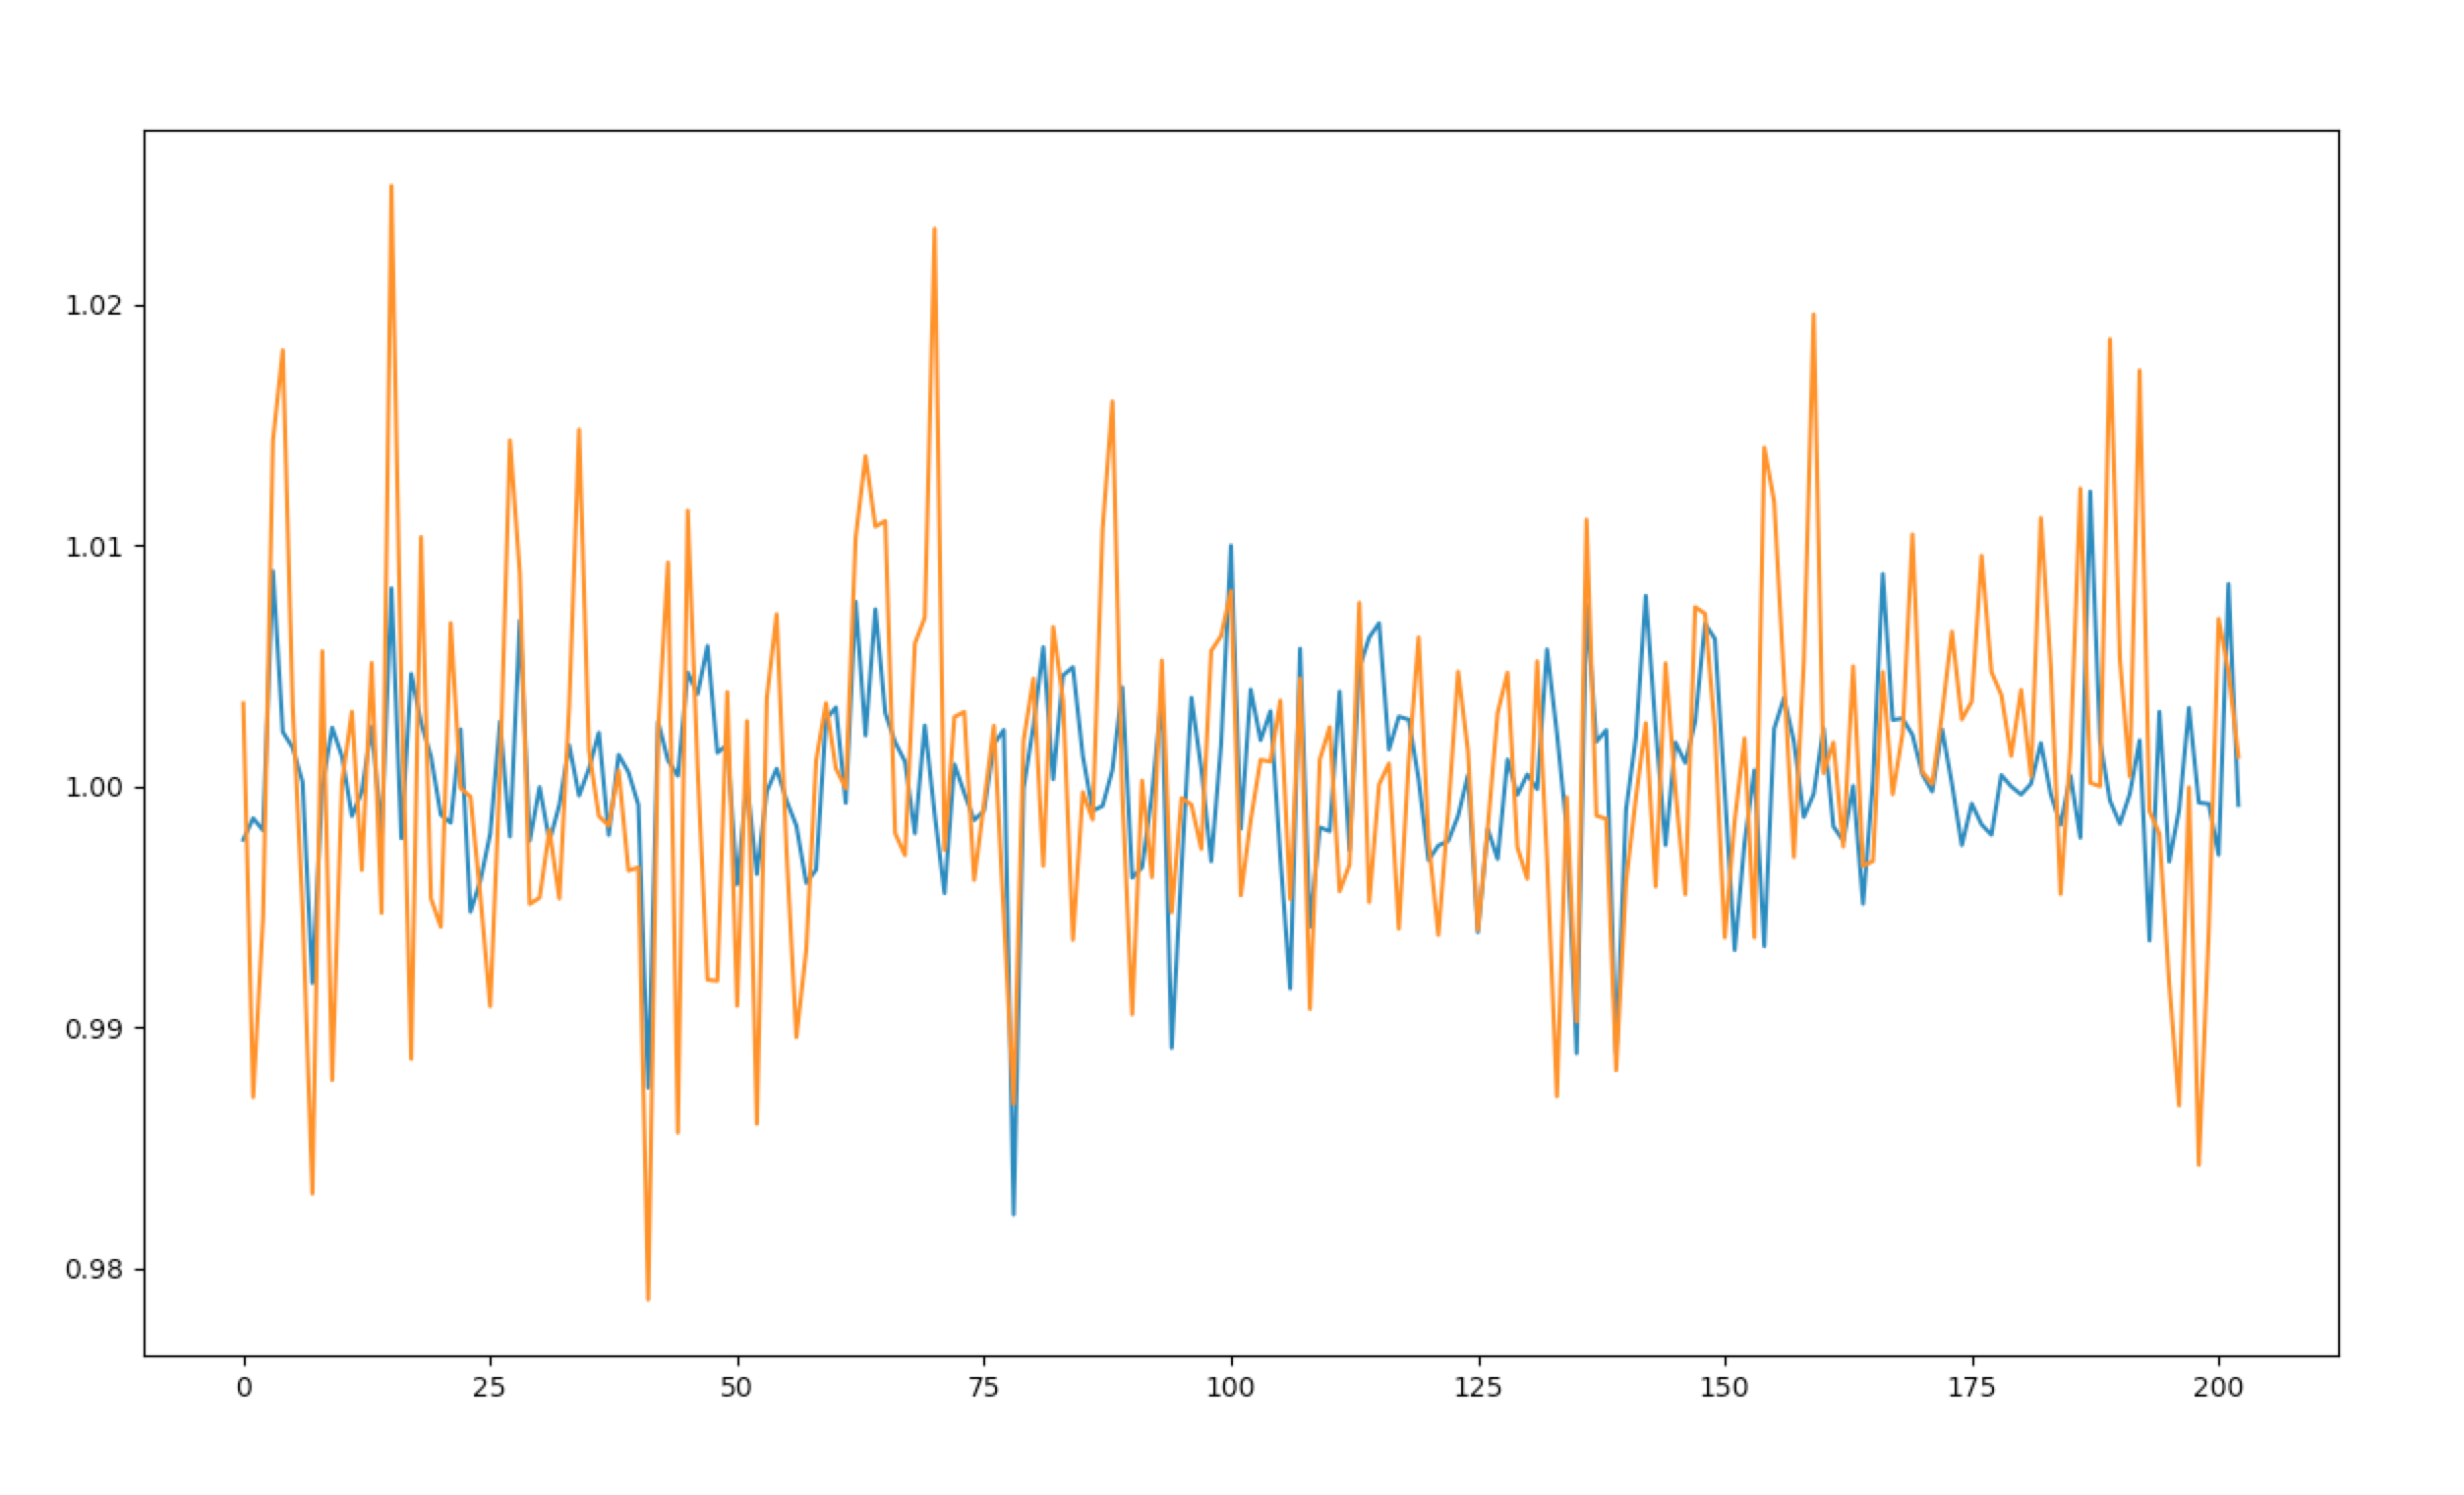 (Blue: Predicted, Orange: Actual)


This is the comparison between predicted change rate and actual change rate.
I noticed that the actual change rate has higher volatility and the predicted one has relatively lower volatility. But the remarkable result is that it predicts very well for the big drop and some of the rising. Of course it does not work well for some days, but as I see the graph I think the prediction results fit with the actual data.
You can find the proposal here.
You can find the frull report here.
Takayoshi Nishida takayoshi.nishida@gmail.com