energygraph
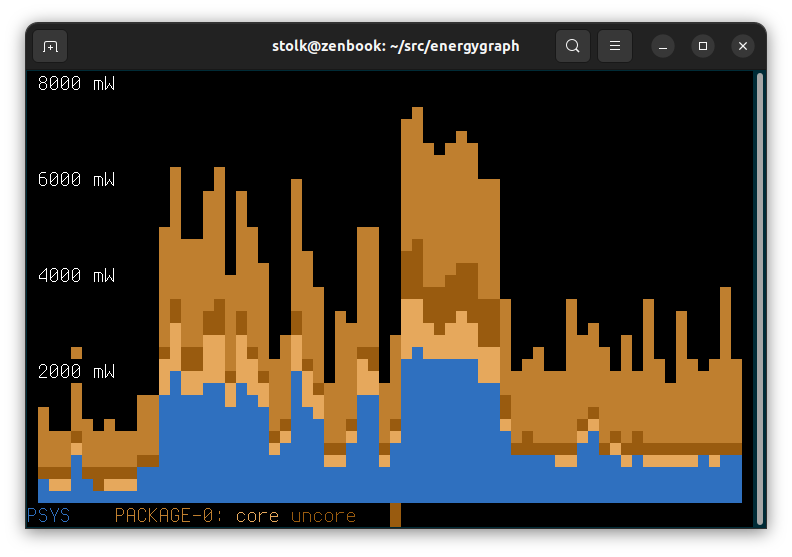
Graphs the power use of a host inside a text terminal, using intel-rapl data from the /sys filesystem.
Because the plot ticks at 1 sample per second, you can either read the values as power (Joules per second, or Watt) or as an absolute energy value (Joules.)
Building
$ make
Running
$ sudo ./energygraph
Interpreting
See the legend: top level zones are reported in capitals.
sub-zones have the same colour hue as parent.
Zone domains:
- psys: Platform.
- package-N: A CPU.
- core: On CPU package. Cores of a CPU.
- uncore: On CPU package, but not a core. Typically a gpu.
- dram: Memory.
Compatibility
Known to work on AMD as well.
Requires /sys/devices/virtual/powercap/intel-rapl/ entries.
Requires root privileges.
Copyright
Copyright 2022 by Bram Stolk, licensed using the MIT Open Source License.
