d3-x3d
3D Data Driven Charting Library with D3 and X3D

Combining the power of the D3.js data-driven documents visualisation library and the Extensible 3D X3D 3D graphics standard, d3-x3d makes it simple to produce beautiful 3D data visualisations with minimal code.
Inspired by Mike Bostock's reusable charts, d3-x3d is built on a foundation of building blocks, called components, which can be combined to create a variety of different data visualisations.
- Examples
- Getting Started
- API Reference
- Components and Charts
- Data Structures
- Download from GitHub
- Download from NPM
The aspiration for the X3D specification is for it to become the de facto HTML5 standard for 3D graphics in the browser, in a similar manner to that of SVG (Scalable Vector Graphics). The aim is that one day X3D will be integrated as standard into all browsers, without the need for additional plugins. For the time being, there are two JavaScript based players for X3D:
Both these players are compatible with modern browsers supporting HTML5 and enable X3D scenes to be embedded in any HTML page. d3-x3d has been tested to work with both X3DOM and X_ITE (there are a couple of more advanced features and charts which currently only work with X3DOM).
Examples
| Example | X3DOM | X_ITE | Observable |
|---|---|---|---|
| Area Chart | View | View | View |
| Multi Series Bar Chart | View | View | View |
| Vertical Bar Chart | View | View | View |
| Bubble Chart | View | View | View |
| Particle Plot | View | View | View |
| Scatter Plot | View | View | View |
| Surface Plot | View | View | View |
| Ribbon Chart | View | View | View |
| Vector Field Chart | View | View | View |
| Volume Slice | View | WIP | WIP |
Getting Started
Include the following JavaScript and CSS files in the <head> section of your page:
If using X3DOM:
<head>
   <script src="https://d3js.org/d3.v5.min.js"></script>
   <script src="https://x3dom.org/release/x3dom.js"></script>
   <link rel="stylesheet" href="https://x3dom.org/release/x3dom.css" />
   <script src="https://raw.githack.com/jamesleesaunders/d3-x3d/master/dist/d3-x3d.js"></script>
</head>
If using X_ITE:
<head>
   <script src="https://d3js.org/d3.v5.min.js"></script>
   <script src="https://code.create3000.de/x_ite/latest/dist/x_ite.min.js"></script>
   <script src="https://raw.githack.com/andreasplesch/x_ite_dom/master/latest/x_ite_dom.js"></script>
   <link rel="stylesheet" href="https://code.create3000.de/x_ite/latest/dist/x_ite.css" />
   <script src="https://raw.githack.com/jamesleesaunders/d3-x3d/master/dist/d3-x3d.js"></script>
</head>
Add the following chartholder <div> (or <X3DCanvas>) and <script> tags to your page <body>:
If using X3DOM:
<body>
   <div id="chartholder"></div>
   <script></script>
</body>
If using X_ITE:
<body>
   <X3DCanvas id="chartholder"></X3DCanvas>
   <script></script>
</body>
Place the following code between the <script></script> tags:
// Select chartholder
var chartHolder = d3.select("#chartholder");

// Generate some data
var myData = [
	{
		key: "UK",
		values: [
			{ key: "Apples", value: 9 },
			{ key: "Oranges", value: 3 },
			{ key: "Pears", value: 5 },
			{ key: "Bananas", value: 7 }
		]
	},
	{
		key: "France",
		values: [
			{ key: "Apples", value: 5 },
			{ key: "Oranges", value: 4 },
			{ key: "Pears", value: 6 },
			{ key: "Bananas", value: 2 }
		]
	}
];

// Declare the chart component
var myChart = d3.x3d.chart.barChartMultiSeries();

// Attach chart and data to the chartholder
chartHolder
	.datum(myData)
	.call(myChart);
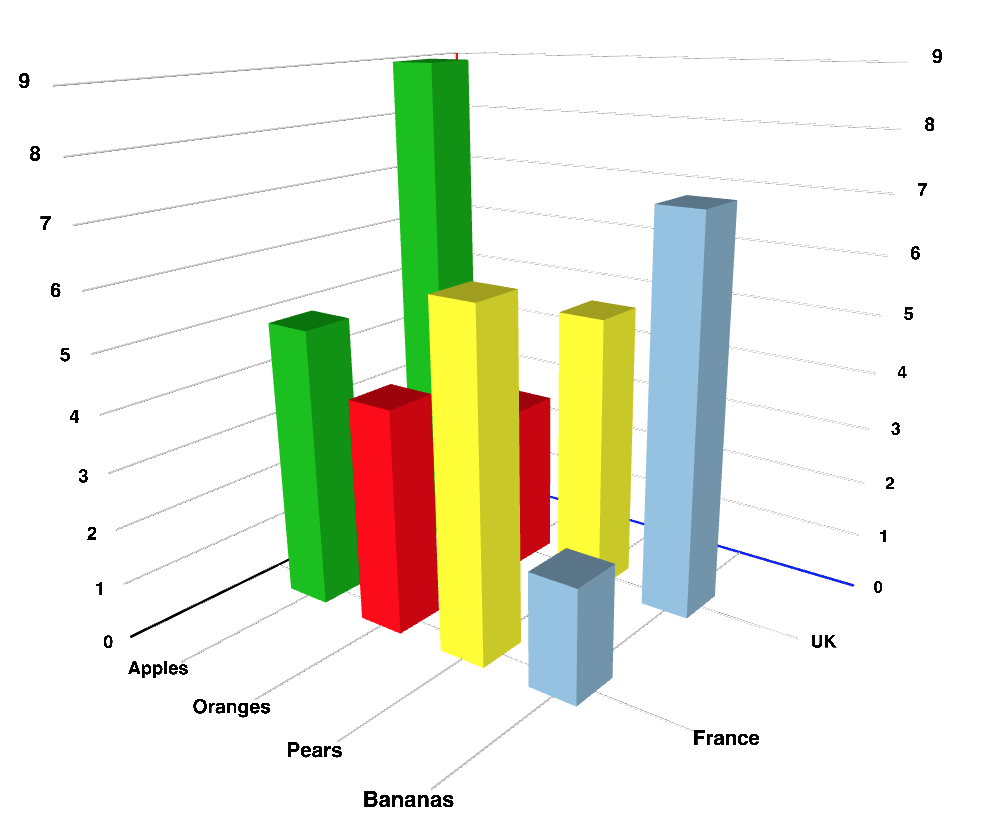
That's all there is to it! View the page in your browser and you should see a basic 3D bar chart:
Install from NPM
If your project is using ES6 modules you can also import d3-x3d, for example from NPM:
npm install --save d3-x3dThen in your project:
let d3X3d = require("d3-x3d");Components and Charts
d3-x3d has two types of reusable module: component and chart. For more information see the API Reference.
Components
The component modules are lower level building blocks which can be used independently, or combined to build higher level chart modules.
For example, combining component.bars(), component.axis() and component.viewpoint() modules together we have built the chart.barChartMultiSeries().
Component modules do not generate a <X3D> tag, these should be attached to an exiting <X3D> tag.
| Function | Description | Documentation |
|---|---|---|
| component.area() | Single series Area Chart | View |
| component.areaMultiSeries() | Multi series Area Chart | View |
| component.axis() | Single plane x/y Axis | View |
| component.axisThreePlane() | Three plane x/y/z Axis | View |
| component.bars() | Single series Bar Chart | View |
| component.barsMultiSeries() | Multi series Bar Chart | View |
| component.bubbles() | Bubble / Scatter Plot | View |
| component.bubblesMultiSeries() | Multi series Bubbles / Scatter Plot | View |
| component.crosshair() | Crosshair | View |
| component.particles() | Particle Plot | View |
| component.ribbon() | Ribbon Chart / Line Chart | View |
| component.ribbonMultiSeries() | Multi series Ribbon Chart | View |
| component.surface() | Surface Area | View |
| component.vectorFields() | Vector Field Chart | View |
| component.viewpoint() | Camera position | View |
| component.volumeSlice() | Volume Slice (MRI Scan) | View |
Charts
The chart modules are higher level, pre-combined components, making it even easier to quickly create charts.
All the chart modules are typically constructed from viewpoint, axis and one or more of the other components above.
Chart modules also generate the <X3D> tag, these should be attached to a regular HTML <div> tag.
| Function | Description | Documentation |
|---|---|---|
| chart.areaChartMultiSeries() | Multi series Area Chart & Axis | View |
| chart.barChartMultiSeries() | Multi series Bar Chart & Axis | View |
| chart.barChartVertical() | Vertical Bar Chart & Axis | View |
| chart.bubbleChart() | Bubble Chart & Axis | View |
| chart.particlePlot() | Particle Plot & Axis | View |
| chart.ribbonChartMultiSeries() | Multi series Ribbon Chart | View |
| chart.scatterPlot() | Scatter Plot & Axis | View |
| chart.surfacePlot() | Surface Plot & Axis | View |
| chart.vectorFieldChart() | Vector Field Chart | View |
| chart.volumeSliceChart() | Volume Slice Chart | View |
Data Structures
At its most basic description, the format of the d3-x3d data is a series of key / value pairs. Depending on whether the chart is a single series or multi series chart the data structure differ slightly.
Single Series Data
Used by charts such as a single series bar chart, the data structure is an object with the following structure:
key{string} - The series namevalues{array} - An array of objects containing:key{string} - The value namevalue{number} - The valuex{number} - X axis value*y{number} - Y axis value*z{number} - Z axis value*
*optional, x, y & z values are used for cartesian coordinate type graphs such as the scatter plot.
var myData = {
	key: "UK",
	values: [
		{ key: "Apples", value: 9, x: 1, y: 2, z: 5 },
		/* ... */
		{ key: "Bananas", value: 7, x: 6, y: 3, z: 8 }
	]
};
Multi Series Data
Used by charts such as the multi series scatter plot or area chart, the multi series data structure is simply an array of the single series data objects above.
var myData = [
	{
		key: "UK",
		values: [
			{ key: "Apples", value: 2 },
			/* ... */
			{ key: "Bananas", value: 3 }
		]
	},
	/* ... */
	{
		key: "France",
		values: [
			{ key: "Apples", value: 5 },
			/* ... */
			{ key: "Bananas", value: 9 }
		]
	}
];
Credits
- Fabian Dubois - For the original 3D Axis, Surface Area and Scatter Plot.
- David Sankel - For the original Bar Chart.
- Victor Glindås - Various contributions to JSDoc and ES6 standardisation.
- Jefferson Hudson - For contributions to axis labels and transitions.
- Andreas Plesch - For contributing the Area Chart and Components (and generally being an x3dom hero!).
- Also see alternative d3-3d by @Niekes.
