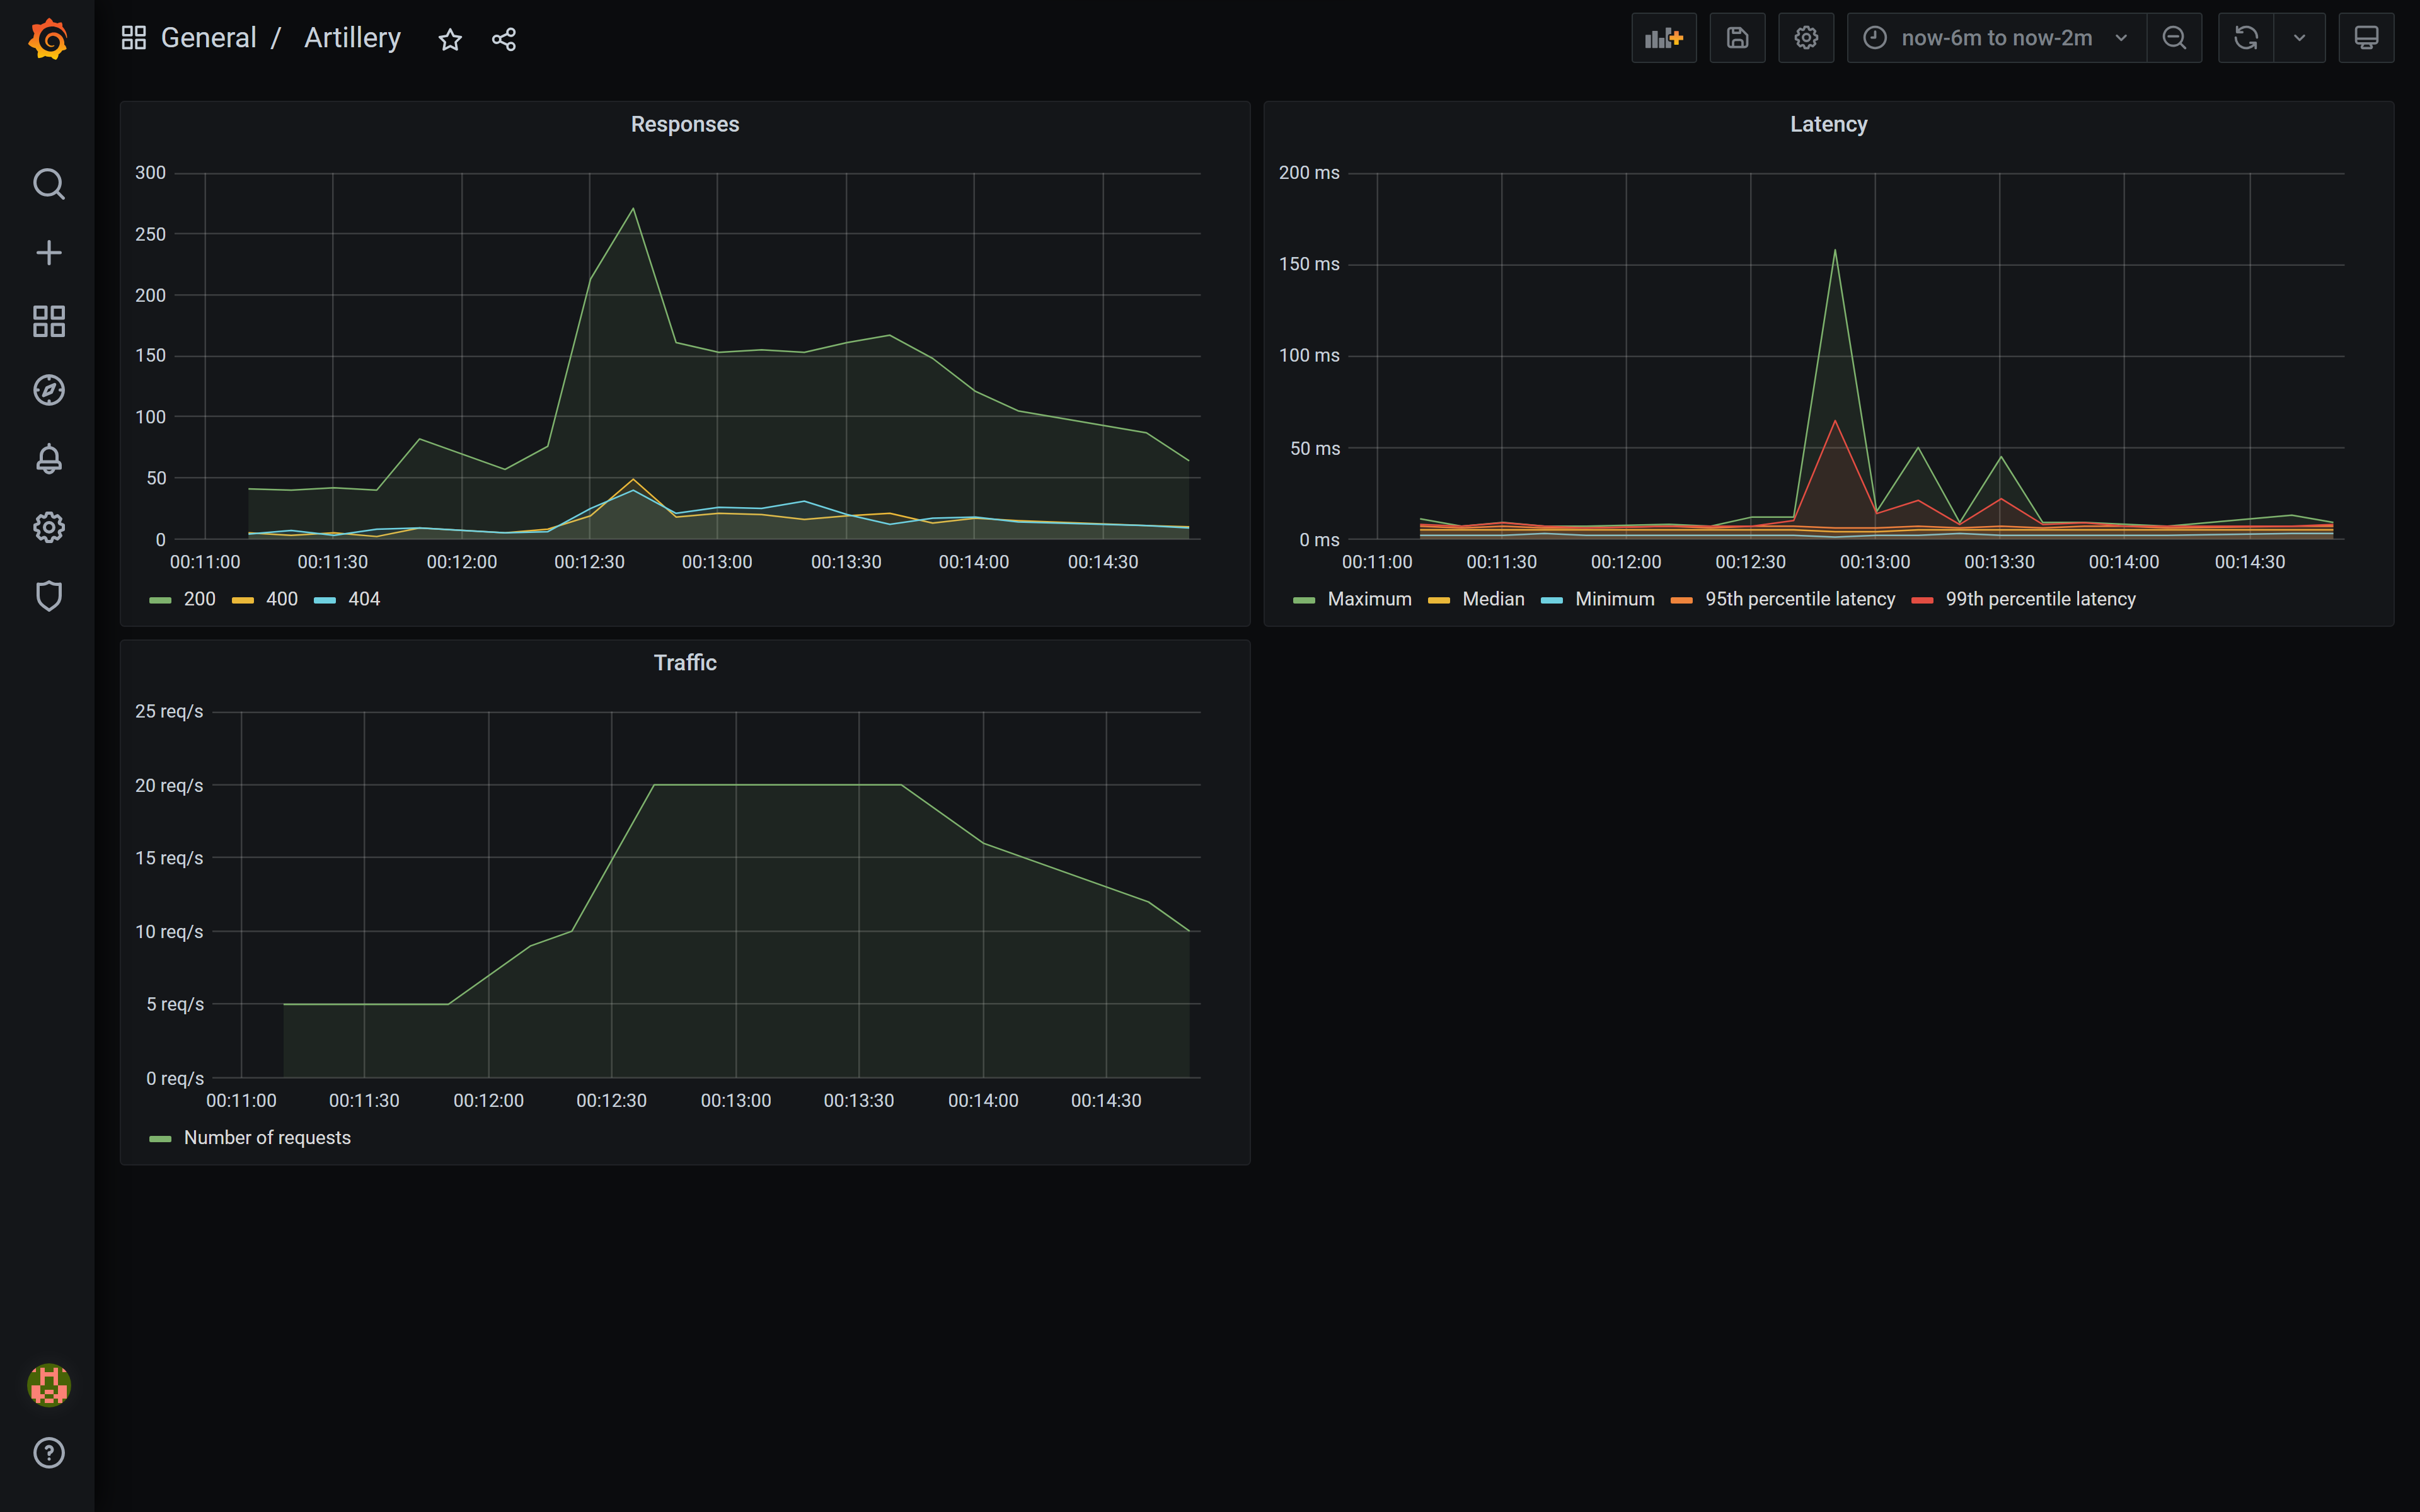
A Proof of Concept for using Artillery for backend performance testing, publishing metrics to InfluxDB 2.0 through Telegraf, and displaying them using Grafana.
-
Run Docker Compose:
docker-compose up -d- This will run InfluxDB 2.0, Telegraf, Grafana and a Weather Forecast API
-
Go to your Grafana and log in
- username:
admin - password:
admin
- username:
-
Connect Grafana to Influx DB
-
Go to Add data source, select InfluxDB and configure the following
Query Language: Flux # InfluxDB 2.0
HTTP:
  URL: http://influxdb2:8086 # InfluxDB address inside Docker
Auth:
  Basic auth: false # Turn off Basic Auth
InfluxDB Details:
  Organization: poc-organization
  Token: my-super-secret-auth-token # You should issue a new Read-Only access token for Grafana in your InfluxDB
  Default Bucket: poc-artillery.io
-
-
Create a new Grafana Dashboard (you can find the finished dashboard here)
- Go to Dashboards and click New Dashboard
- Click
Add an empty panel-
Responses
-
Panel (Settings)
- Panel title:
Responses
- Panel title:
-
Query
from(bucket: "poc-artillery.io") |> range(start: v.timeRangeStart, stop: v.timeRangeStop) |> filter(fn: (r) => r["testId"] == "weather-forecast") |> filter(fn: (r) => r["_measurement"] =~ /artillery_http_codes_1[0-9]{2}/ or r["_measurement"] =~ /artillery_http_codes_2[0-9]{2}/ or r["_measurement"] =~ /artillery_http_codes_3[0-9]{2}/ or r["_measurement"] =~ /artillery_http_codes_4[0-9]{2}/ or r["_measurement"] =~ /artillery_http_codes_5[0-9]{2}/) |> aggregateWindow(every: v.windowPeriod, fn: mean, createEmpty: false) |> yield(name: "mean") -
Overrides (Fields with name matching regex)
- 200 Responses
- RegEx:
artillery_http_codes_200.+ - Display name:
200
- RegEx:
- 400 Responses
- RegEx:
artillery_http_codes_400.+ - Display name:
400
- RegEx:
- 404 Responses
- RegEx:
artillery_http_codes_404.+ - Display name:
404
- RegEx:
- 200 Responses
-
-
HTTP Response Time (Latency)
-
Panel (Settings)
- Panel title:
HTTP Response Time (Latency)
- Panel title:
-
Field (Standard options)
- Unit:
milliseconds (ms)(under Time)
- Unit:
-
Query
from(bucket: "poc-artillery.io") |> range(start: v.timeRangeStart, stop: v.timeRangeStop) |> filter(fn: (r) => r["testId"] == "weather-forecast") |> filter(fn: (r) => r["_measurement"] == "artillery_http_response_time_max" or r["_measurement"] == "artillery_http_response_time_median" or r["_measurement"] == "artillery_http_response_time_min" or r["_measurement"] == "artillery_http_response_time_p95" or r["_measurement"] == "artillery_http_response_time_p99") |> aggregateWindow(every: v.windowPeriod, fn: mean, createEmpty: false) |> yield(name: "mean") -
Overrides (Fields with name matching regex)
- Maximum latency
- RegEx:
artillery_http_response_time_max.+ - Display name:
Maximum
- RegEx:
- Median latency
- RegEx:
artillery_http_response_time_median.+ - Display name:
Median
- RegEx:
- Minimum latency
- RegEx:
artillery_http_response_time_min.+ - Display name:
Minimum
- RegEx:
- 95th percentile latency
- RegEx:
artillery_http_response_time_p95.+ - Display name:
95th percentile latency
- RegEx:
- 99th percentile latency
- RegEx:
artillery_http_response_time_p99.+ - Display name:
99th percentile latency
- RegEx:
- Maximum latency
-
-
Traffic
-
Panel (Settings)
- Panel title:
Traffic
- Panel title:
-
Field (Standard options)
- Unit:
requests/sec (rps)(under Throughput)
- Unit:
-
Query
from(bucket: "poc-artillery.io") |> range(start: v.timeRangeStart, stop: v.timeRangeStop) |> filter(fn: (r) => r["testId"] == "weather-forecast") |> filter(fn: (r) => r["_measurement"] == "artillery_http_request_rate") |> aggregateWindow(every: v.windowPeriod, fn: mean, createEmpty: false) |> yield(name: "mean") -
Overrides (Fields with name matching regex)
- Maximum latency
- RegEx:
value.+ - Display name:
Number of requests
- RegEx:
- Maximum latency
-
-
- Go to test folder:
cd .\test\performance-testing\ - Install dependencies:
npm install - Run tests:
npm run weather-forecast
You should now see your Artillery output in Grafana.
If you can't see anything in Grafana, check InfluxDB bucket (Data/Buckets/poc-artillery.io).
- Tomas Svejnoha
- GitHub: svejnohatomas
- LinkedIn: Tomáš Švejnoha
