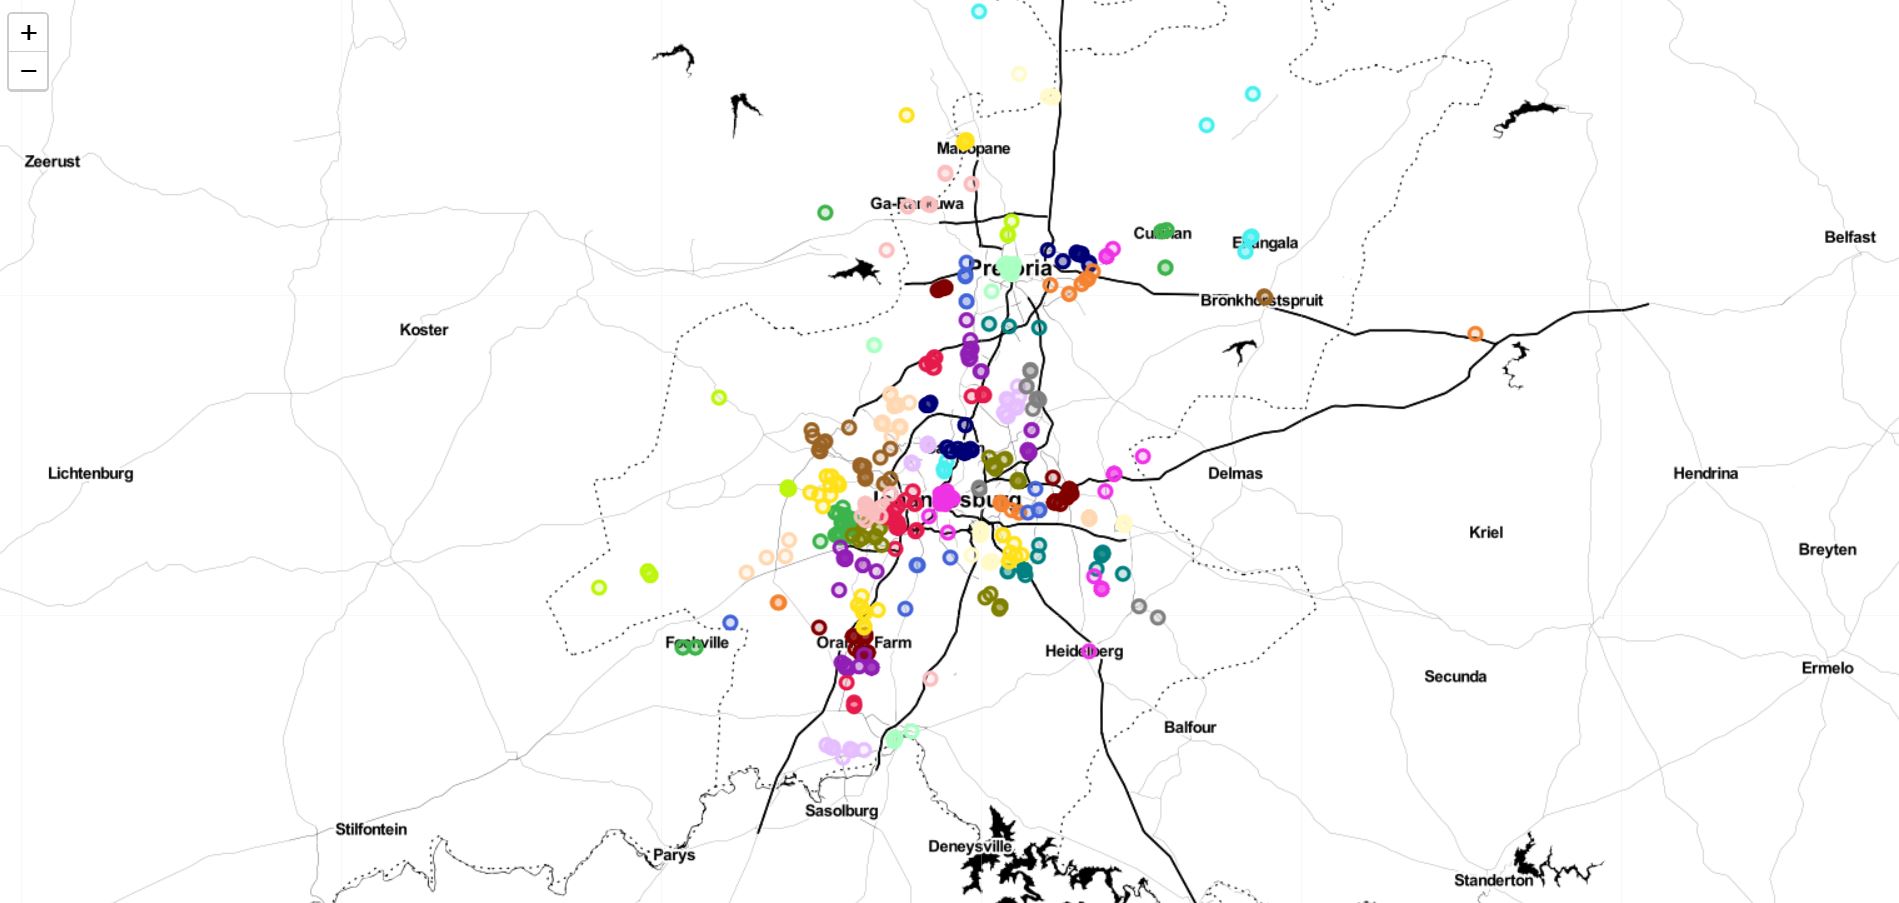
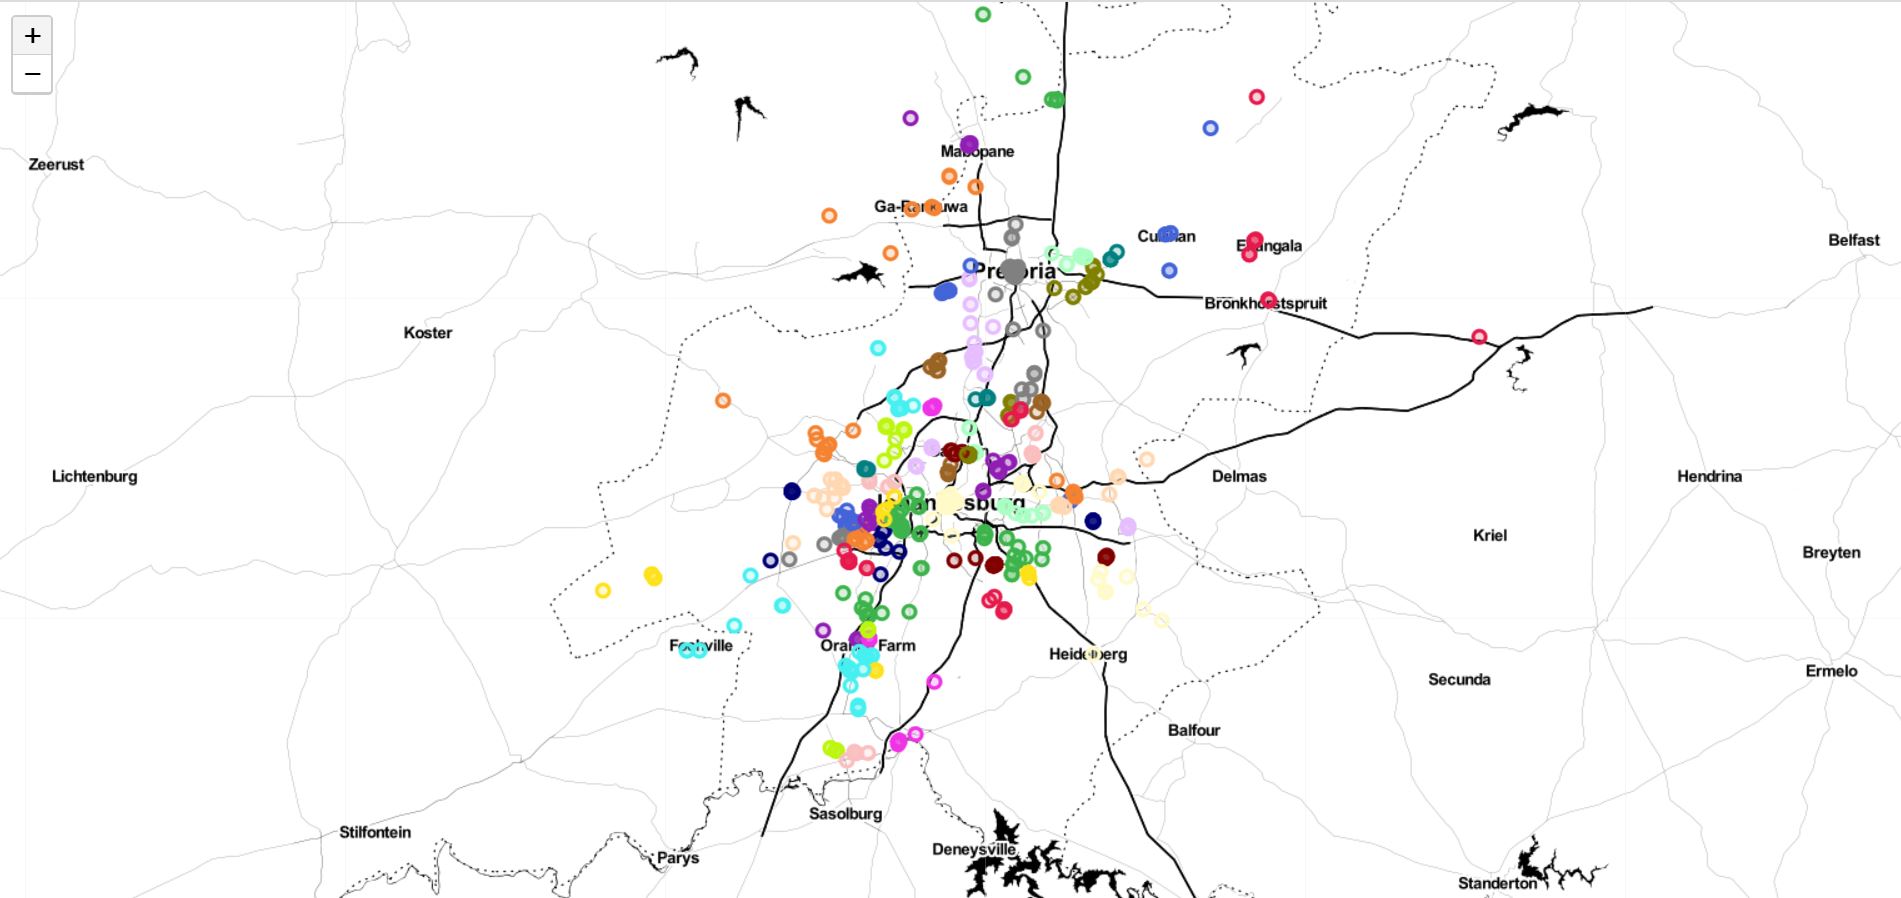
We have taxi rank locations, and want to define key clusters of these taxis where we can build service stations for all taxis operating in that region.
- Basic Matplotlib skills for plotting 2-D data clearly.
- Basic understanding of Pandas and how to use it for data manipulation.
- The concepts behind clustering algorithms.
- Exploratory Data Analysis
- Visualizing Geographical Data
- Clustering Strength / Performance Metric
- K-Means Clustering
- DBSCAN
- HDBSCAN
- Addressing Outliers
For some additional reading, feel free to check out K-Means, [DBSCAN] (https://scikit-learn.org/stable/modules/generated/sklearn.cluster.DBSCAN.html), and [HDBSCAN] (https://hdbscan.readthedocs.io/en/latest/) clustering respectively.
It may be of use to also check out [other forms of clustering] (https://scikit-learn.org/stable/modules/clustering.html) that are commonly used and available in the scikit-learn library. HDBSCAN documentation also includes [a good methodology] (https://hdbscan.readthedocs.io/en/latest/comparing_clustering_algorithms.html) for choosing your clustering algorithm based on your dataset and other limiting factors.

