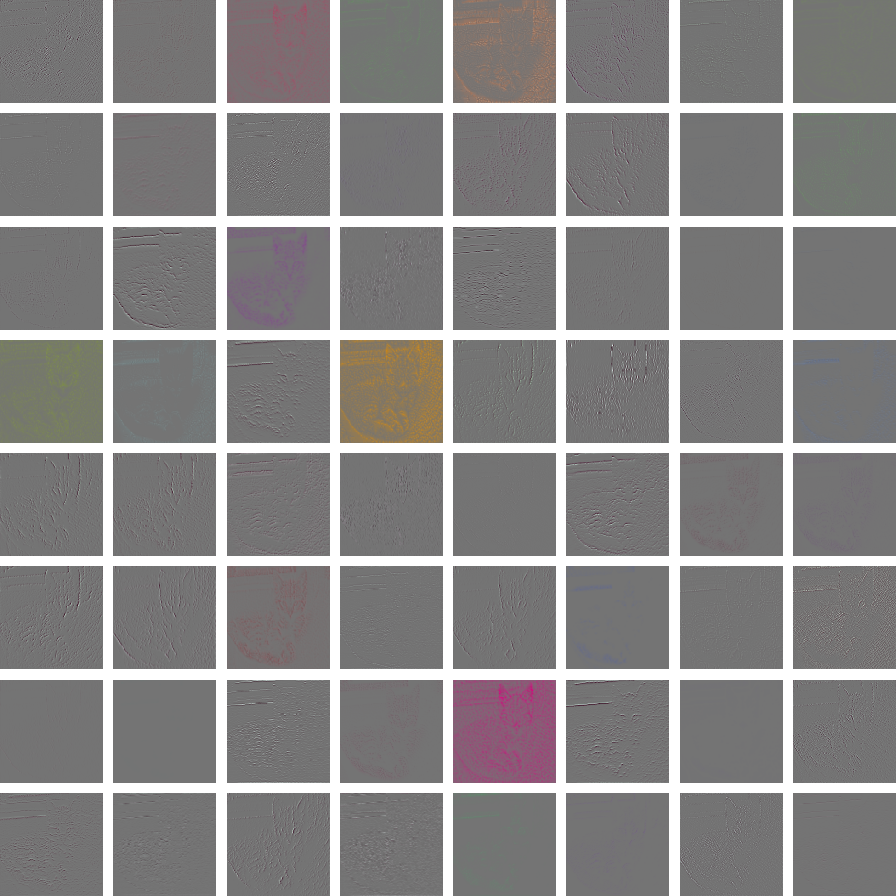
An implementation in Chainer of the neural network visualization by Zeiler and Fergus, Visualizing and Understanding Convolutional Networks, 2013.
Download a pretrained VGG Chainer model following the README in this repository.
Run the visualization script as follows. The VGG model will be feeded with an image and the activations in each of the five convolutional layer will be projected back to the input space, i.e. the space of the original image of size (3, 224, 224). The projections will be stored in the specified output directory.
python visualize.py --image-filename images/cat.jpg --model-filename VGG.model --out-dirname results --gpu 0You can visualize the activations for an image of arbitrary size since the image will be scaled to the size expected by the classifier automatically.
Activations visualized from the convolutional layers of VGG using an image of a cat.


