The Orbitronomy library is designed to simplify the process of plotting, calculating, visualizing, and animating the orbits of celestial bodies in 3D space. It employs Kepler's elliptical orbit equations and Keplerian Elements, in conjunction with PyAstronomy, to perform precise orbital calculations. For 3D plotting, it integrates the capabilities of Matplotlib, enhancing its utility in astronomical simulations and analyses.
The SimpleOrbit class provides the capability of simulating single object orbits, and multiple object orbits in the format of a list within list.
SimpleOrbit(plot_title, name)
plot_title: Title for the plot.name: Identifier for the celestial body.
faceColor(color): Sets the face color of the axes.paneColor(color): Sets the color of the 3D panes.gridColor(color): Sets the grid color.orbitTransparency(value): Sets the transparency of the orbits.labelColor(color): Sets the color of axis labels.tickColor(color): Sets the color of axis ticks.plotStyle(background_color): Sets the background style of the plot.semiMajorAxis(value),perihelion(value),eccentricity(value),inclination(value),longitudeOfAscendingNode(value),argumentOfPerihelion(value): Set specific orbital parameters.
from orbitronomy.orbitCalcs import SimpleOrbit

test = SimpleOrbit(plot_title="Test", name="Earth")

# Styling
test.faceColor("black")
test.paneColor("black")
test.gridColor("#222831")
test.orbitTransparency(0.5)
test.labelColor("white")
test.tickColor("white")

test.plotStyle(background_color="dark_background")

# the form of the "data" list should be as follows:
# "name", semi_major_axis, perihelion, eccentricity, inclination, longitude_of_ascending_node, argument_of_perihelion, color (optional)
data = [["object1", 1, 0.983289891, 0.01671123, 15, 0, 0, "green"], ["object2", 1.5, 0.483289891, 0.02671123, 6, 0, 0, "yellow"], ["object3", 1.3, 0.683289891, 0.01671123, 2, 0, 0, "red"]]

#you can also use the following instead of "data" array if you want to plot a single object
# test.semiMajorAxis(1)
# test.perihelion(0.983289891)
# test.eccentricity(0.01671123)
# test.inclination(0)
# test.longitudeOfAscendingNode(0)
# test.argumentOfPerihelion(0)

# Calculating and plotting orbits
test.calculateOrbit(plot_steps=1000, n_orbits=1, data=data, trajectory=True, sun=True)

#you can choose if you want to set boundaries for the plot
# test.xLim([20, 20])
# test.yLim([20, 20])
# test.zLim([0.1, 0.1])

# Setting axis labels
test.xLabel("X-Axis")
test.yLabel("Y-Axis")
test.zLabel("Z-Axis")

# Animating the orbits
test.animateOrbit(dpi=250, save=False, export_zoom=3, font_size="xx-small", export_folder="results")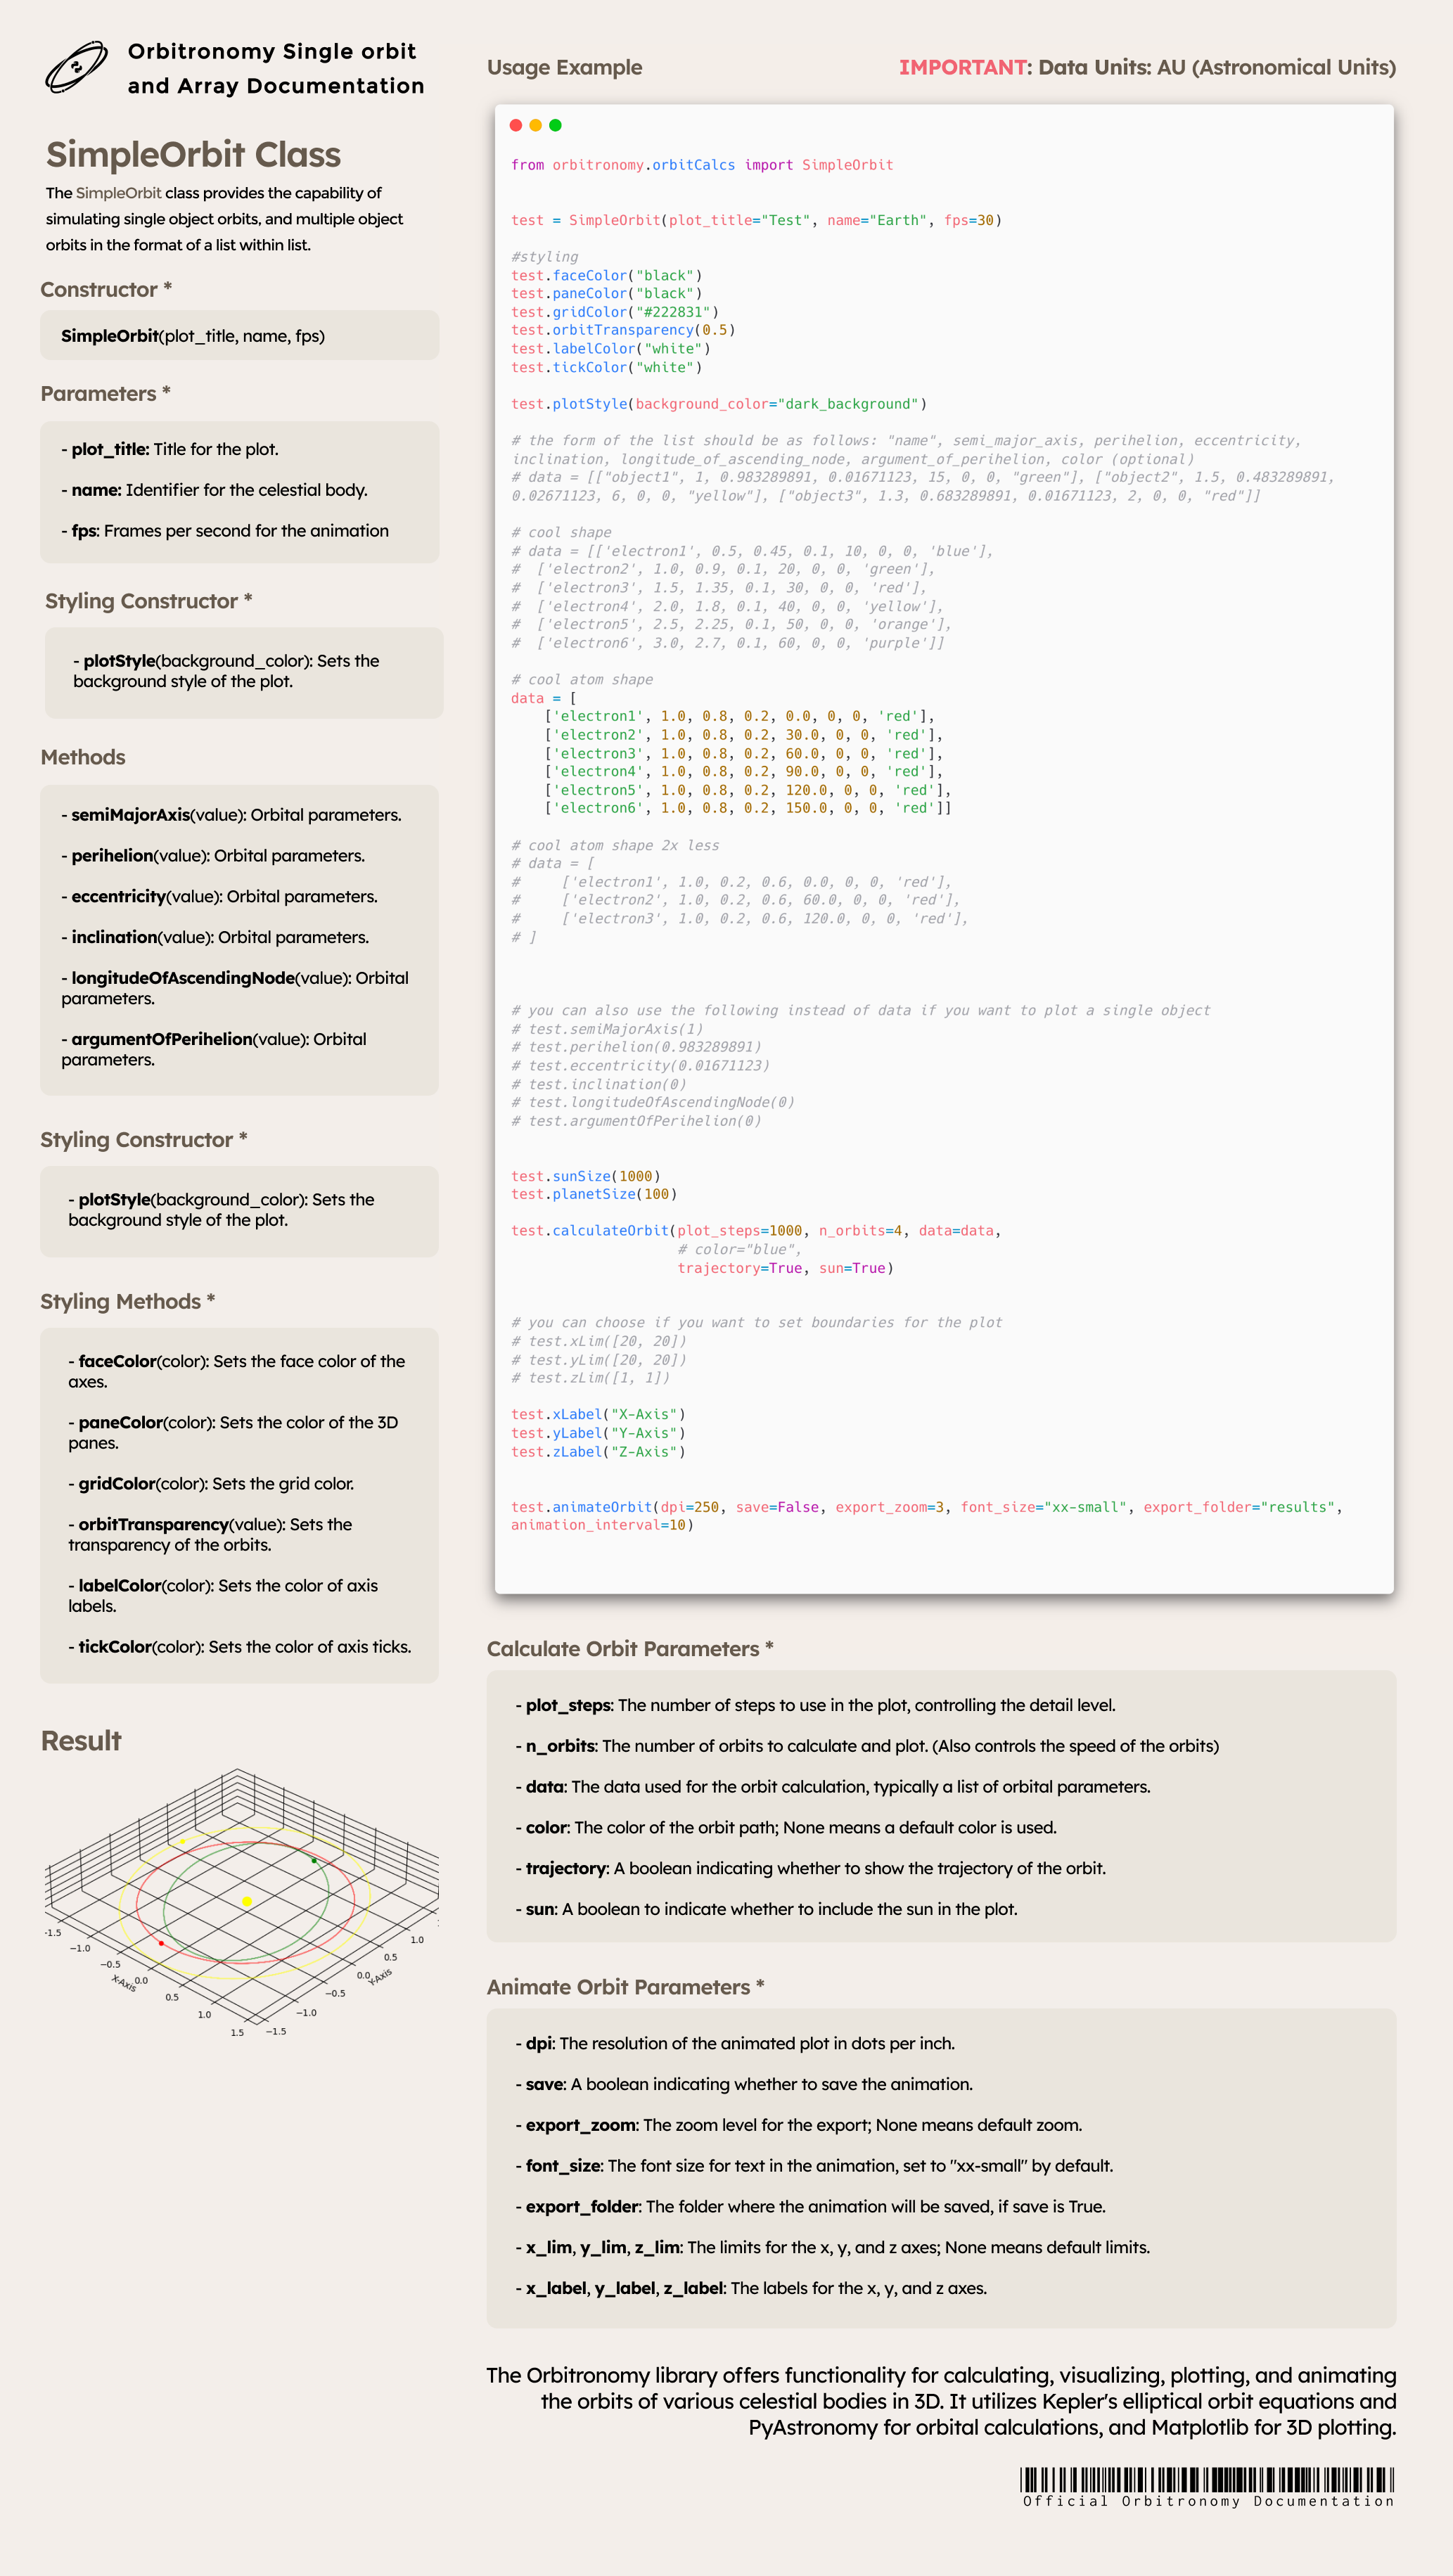
The Orbitronomy library is enhanced with functionality to calculate, visualize, plot, and animate orbits of celestial bodies in 3D using datasets. It utilizes Kepler's elliptical orbit equations, PyAstronomy for orbital calculations, and Matplotlib for 3D plotting.
The datasetOrbit class extends the capabilities of the SimpleOrbit class, allowing for the use of datasets to plot multiple celestial bodies.
datasetOrbit(plot_title, name)
plot_title: Title for the plot.name: Identifier for the celestial body or simulation.
faceColor(color)paneColor(color)gridColor(color)orbitTransparency(value)labelColor(color)tickColor(color)datasetPlotStyle(background_color)
columnSemiMajorAxis(column_name)columnPerihelion(column_name)columnEccentricity(column_name)columnInclination(column_name)columnLongitudeOfAscendingNode(column_name)columnArgumentOfPerihelion(column_name)columnColor(column_name)columnName(column_name)fileName(file_name)
datasetCalculateOrbit(plot_steps, n_orbits, color, trajectory, sun, random_color)xLim(lim), yLim(lim), zLim(lim)xLabel(label), yLabel(label), zLabel(label)datasetAnimateOrbit(dpi, save, export_zoom, font_size, export_folder)
from orbitronomy.datasetOrbit import datasetOrbit

test = datasetOrbit(plot_title="Test", name="Earth")

# Styling
test.faceColor("black")
test.paneColor("black")
test.gridColor("#222831")
test.orbitTransparency(0.5)
test.labelColor("white")
test.tickColor("white")

test.datasetPlotStyle(background_color="dark_background")

# Dataset column configuration
test.columnSemiMajorAxis("semi_major_axis")
test.columnPerihelion("perihelion")
test.columnEccentricity("eccentricity")
test.columnInclination("inclination")
test.columnLongitudeOfAscendingNode("longitude_of_ascending_node")
test.columnArgumentOfPerihelion("argument_of_perihelion")
test.columnColor("color")
test.columnName("name")

# Specifying the dataset file name
test.fileName("datasets/Planetary-Satellite-Data.csv")

# Calculating and plotting orbits from the dataset
test.datasetCalculateOrbit(plot_steps=1000, n_orbits=12, color="yellow", random_color=True, trajectory=True, sun=True)

#you can choose if you want to set boundaries for the plot
# test.xLim([20, 20])
# test.yLim([20, 20])
# test.zLim([0.1, 0.1])

# Setting axis labels
test.xLabel("X-Axis")
test.yLabel("Y-Axis")
test.zLabel("Z-Axis")

# Animating the orbits
test.datasetAnimateOrbit(dpi=250, save=False, export_zoom=3, font_size="xx-small")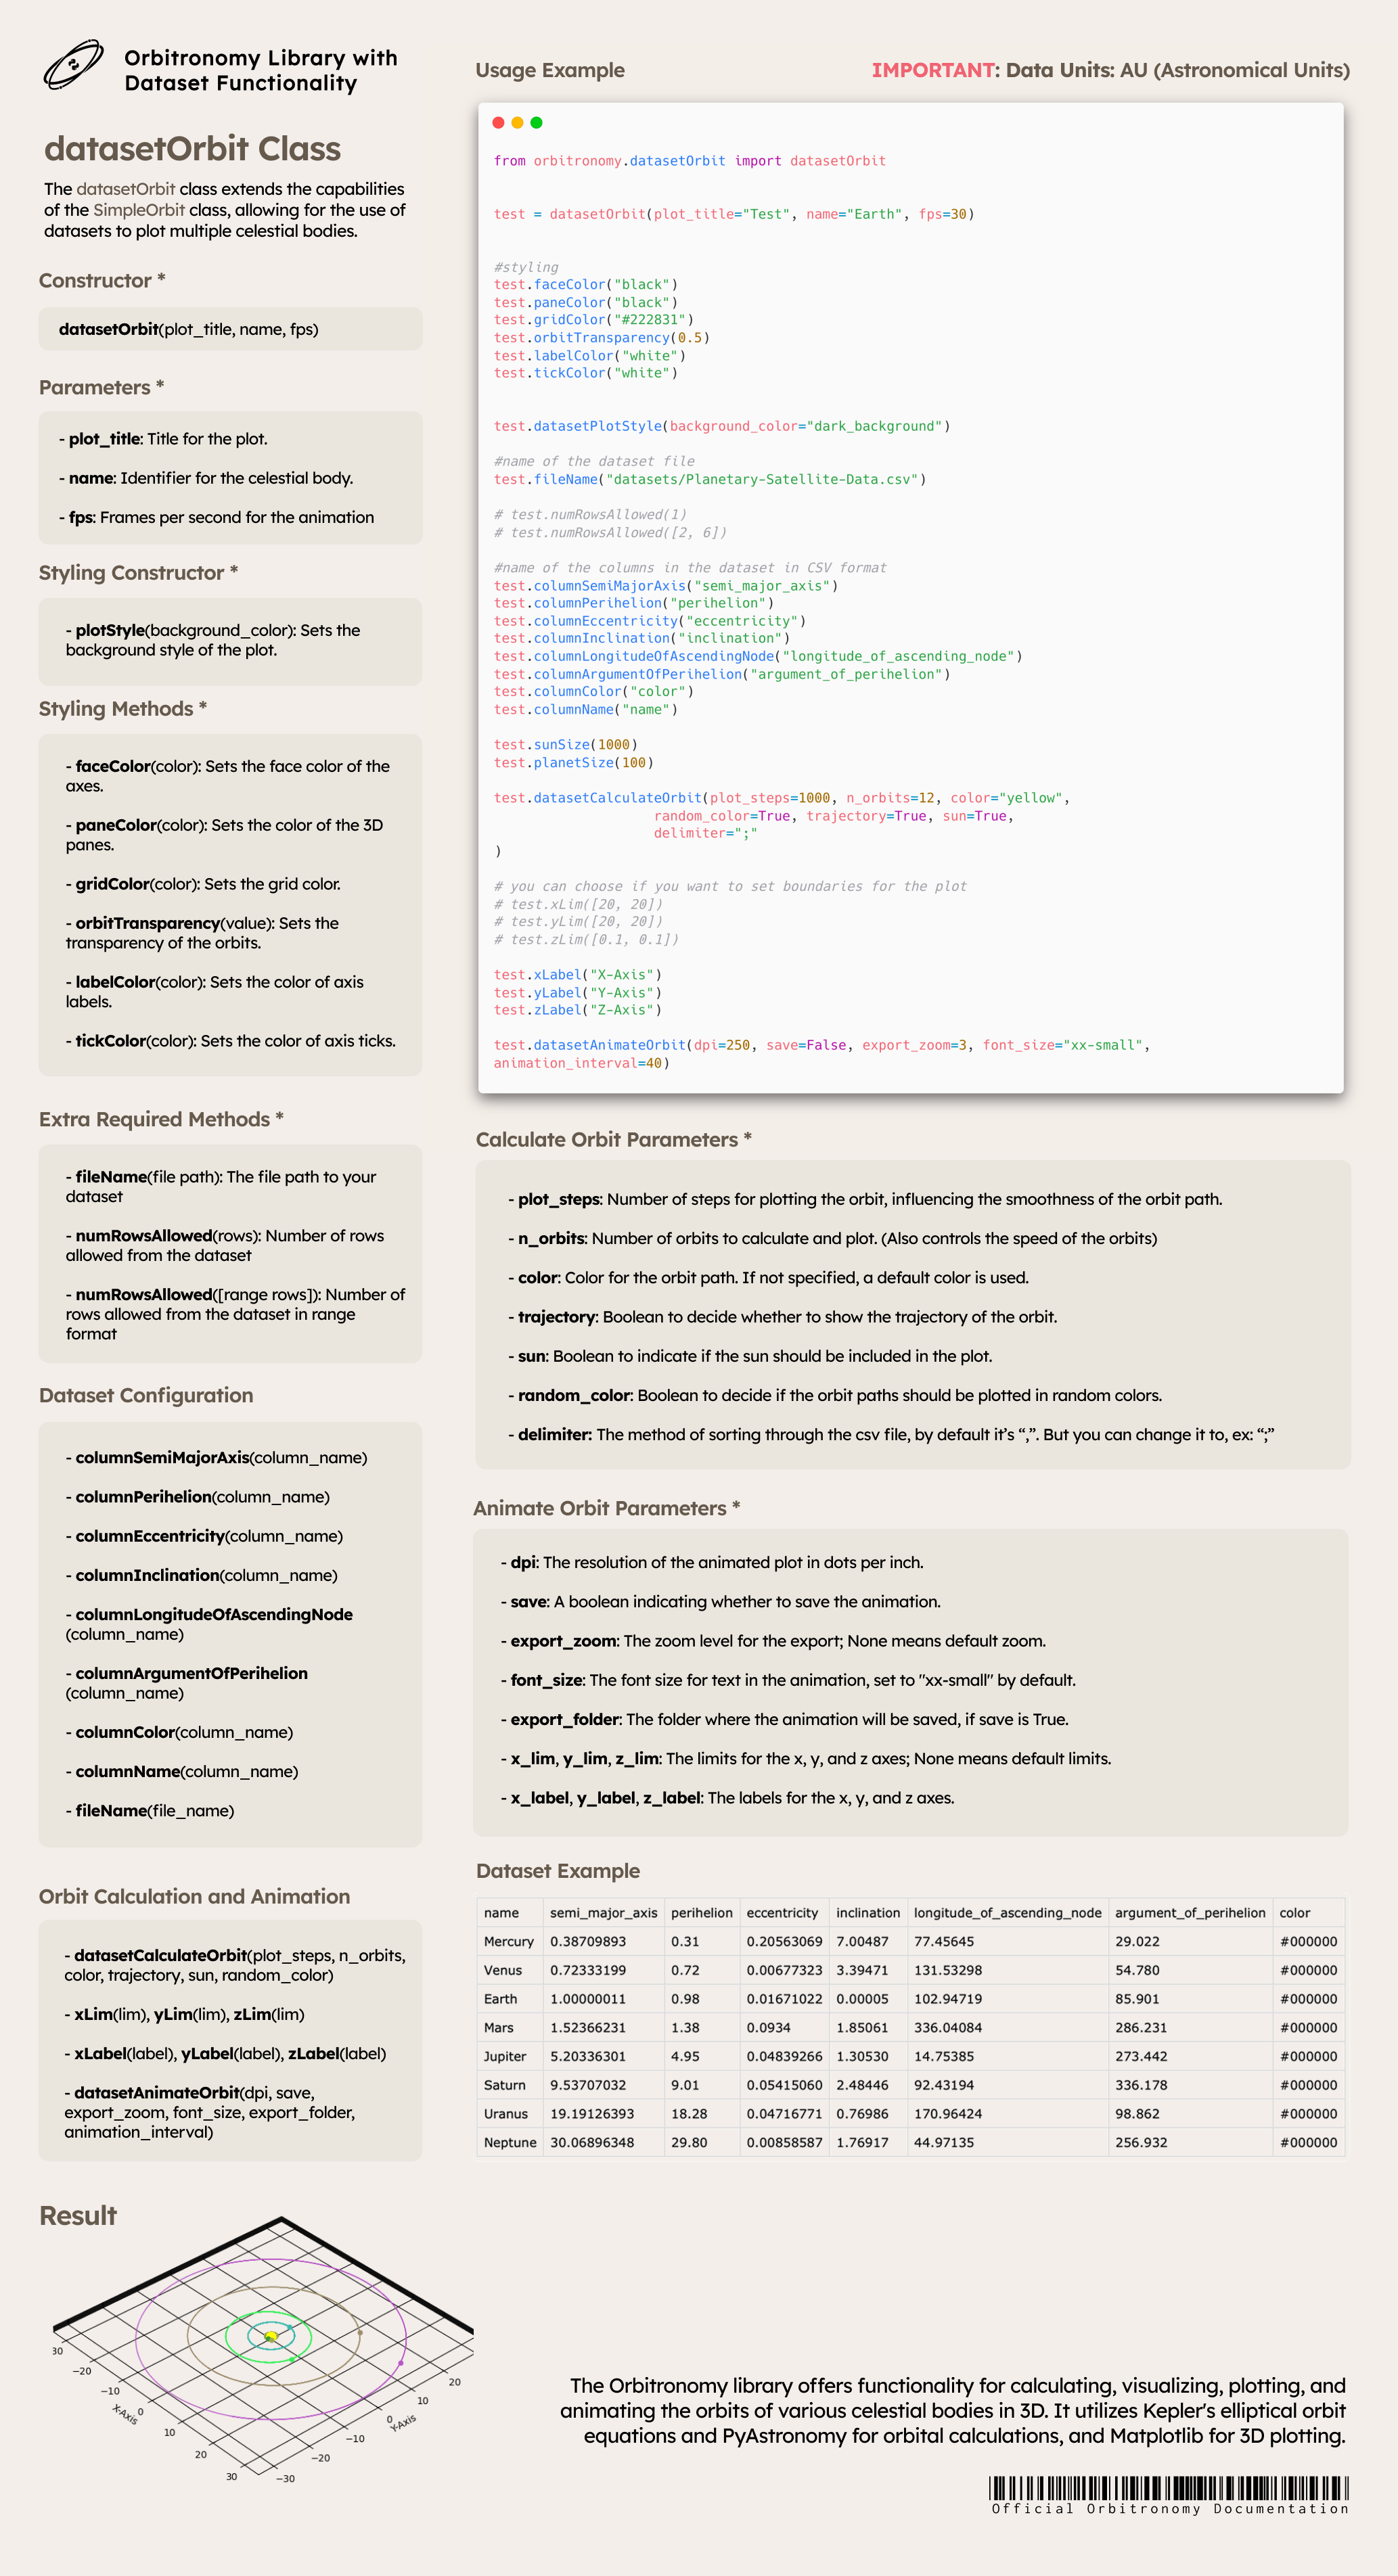
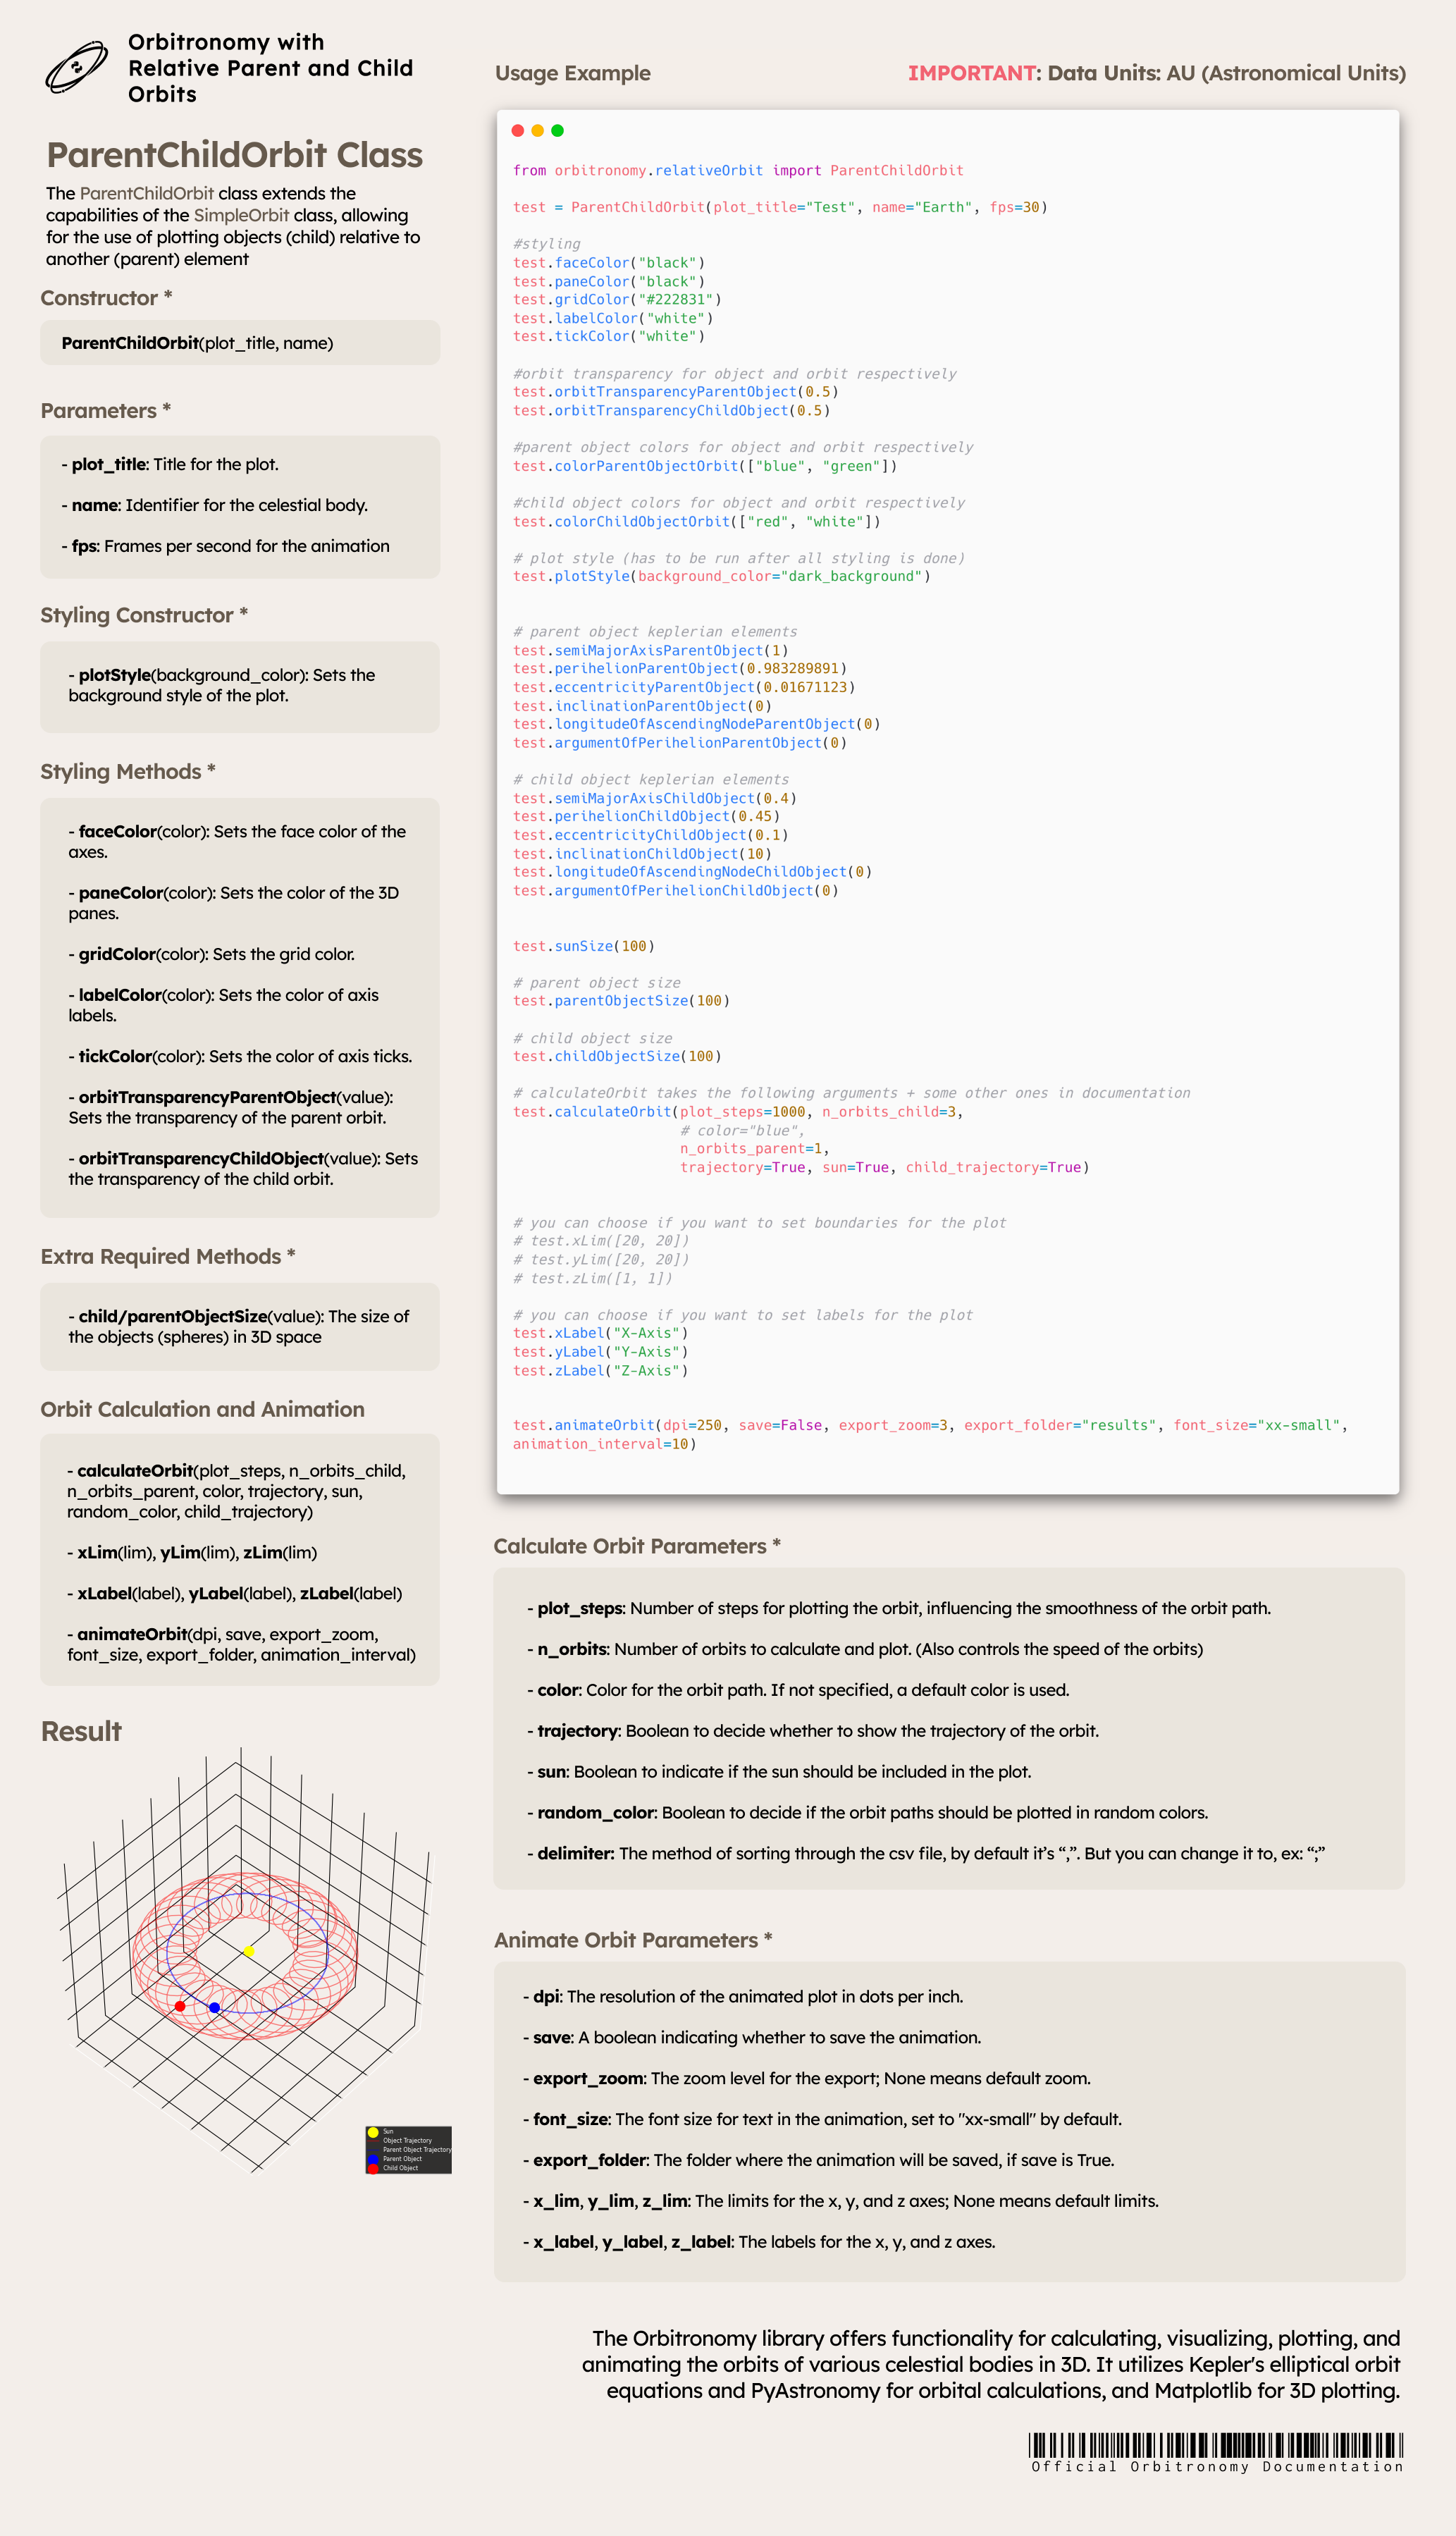
The ParentChildOrbit class extends the capabilities of the SimpleOrbit class, allowing for the use of plotting objects (child) relative to another (parent) element
from orbitronomy.relativeOrbit import ParentChildOrbit

test = ParentChildOrbit(plot_title="Test", name="Earth", fps=30)

#styling
test.faceColor("#F3EEEA")
test.paneColor("#F3EEEA")
test.gridColor("black")
test.labelColor("#F3EEEA")
test.tickColor("#F3EEEA")

#orbit transparency for object and orbit respectively
test.orbitTransparencyParentObject(0.5)
test.orbitTransparencyChildObject(0.5)

#parent object colors for object and orbit respectively
test.colorParentObjectOrbit(["blue", "blue"])

#child object colors for object and orbit respectively
test.colorChildObjectOrbit(["red", "red"])

# plot style (has to be run after all styling is done)
test.plotStyle(background_color="dark_background")


# parent object keplerian elements
test.semiMajorAxisParentObject(1)
test.perihelionParentObject(0.983289891)
test.eccentricityParentObject(0.01671123)
test.inclinationParentObject(0)
test.longitudeOfAscendingNodeParentObject(0)
test.argumentOfPerihelionParentObject(0)

# child object keplerian elements
test.semiMajorAxisChildObject(0.4)
test.perihelionChildObject(0.45)
test.eccentricityChildObject(0.1)
test.inclinationChildObject(10)
test.longitudeOfAscendingNodeChildObject(0)
test.argumentOfPerihelionChildObject(0)


test.sunSize(100)

# parent object size
test.parentObjectSize(100)

# child object size
test.childObjectSize(100)

# calculateOrbit takes the following arguments + some other ones in documentation
test.calculateOrbit(plot_steps=1000, n_orbits_child=4,
                    # color="blue",
                    n_orbits_parent=1,
                    trajectory=True, sun=True, child_trajectory=True)


# you can choose if you want to set boundaries for the plot
# test.xLim([20, 20])
# test.yLim([20, 20])
# test.zLim([1, 1])

# you can choose if you want to set labels for the plot
test.xLabel("X-Axis")
test.yLabel("Y-Axis")
test.zLabel("Z-Axis")


test.animateOrbit(dpi=250, save=False, export_zoom=3, export_folder="results", font_size="xx-small", animation_interval=10)