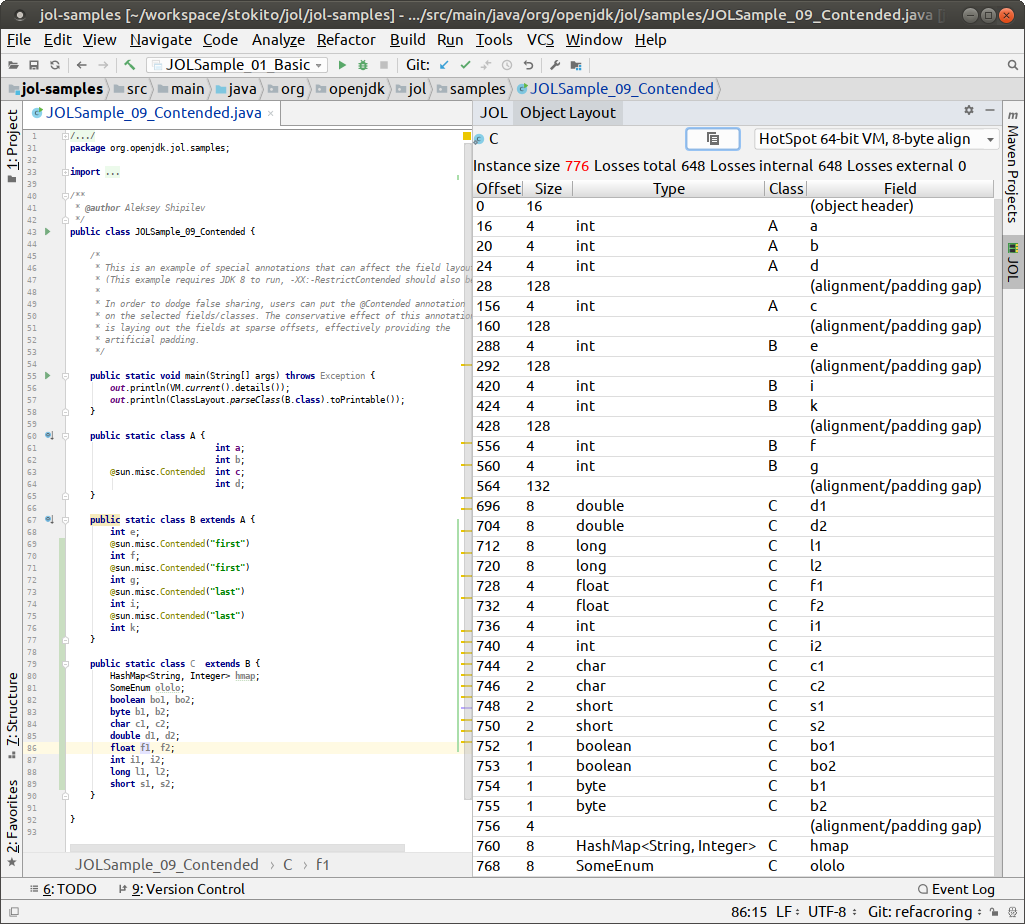
JOL (Java Object Layout) is the tool to analyze object layout schemes in JVMs. For example, in HotSpot VM on 64x processor an empty string takes 40 bytes i.e. 24 bytes for String object itself + 16 bytes for an internal empty char array.
The plugin is a GUI for JOL and allows you to make an estimate how much memory the object takes.
Set a cursor into a class name and then press Code / Show Object Layout and you'll see a right panel with layout info.
Thus, you can perform simplest but most efficient performance improvements. Just check your DTOs if they fit into 64 bytes of processor's cache line.
Only HotSpot VM is supported by JOL itself.
The plugin supports only basic estimate of class layout in different VM modes i.e. the same as jol-cli estimates command.
For more precise estimate use JOL library and estimate in run time on the real objects with GraphLayout:
import org.openjdk.jol.info.GraphLayout;
import java.util.HashMap;

public class JolTest {

    public static void main(String[] args) {
        HashMap<Object, Object> hashMap = new HashMap<>();
        hashMap.put("key", "value");
        System.out.println(GraphLayout.parseInstance(hashMap).toFootprint());
    }
}
Output will be like:
java.util.HashMap@7a79be86d footprint:
     COUNT       AVG       SUM   DESCRIPTION
         2        24        48   [B
         1        80        80   [Ljava.util.HashMap$Node;
         2        24        48   java.lang.String
         1        48        48   java.util.HashMap
         1        32        32   java.util.HashMap$Node
         7                 256   (total)
So you can see the full size including inner objects.
NOTE: Your app most likely will use the HotSpot with 64-bit VM, compressed references mode.
-
Using IDE built-in plugin system:
Settings/Preferences > Plugins > Marketplace > Search for "JOL" > Install Plugin
-
Manually:
Download the latest release and install it manually using Settings/Preferences > Plugins > ⚙️ > Install plugin from disk...
The plugin provides an inspection to see most big classes. It's enabled by default.
You can find the inspection by path Java | Memory | JOL: Class has too big memory footprint to configure or disable it.
Please leave a feedback for the plugin in marketplace.
- Java Objects Inside Out from the JOL author.
- Видео: Алексей Шипилёв — Java-объекты наизнанку
- Video: Java Object Layout | Ordinary Object Pointer | Object Header | CompressedOops | OpenJdk HotSpot JVM
- Video: JVM Benchmarking with Aleksey Shipilev
Java VM and it's version.
HotSpot is from OpenJDK. The Lilliput in development. The Raw is a layout by itself without real gaps and aligns.
CPU word size 32 or 64 bits i.e. size of a pointer.
COOPS is compressed references i.e. a trick to store 64 bits pointer in only 32 bits but all fields needs to be aligned.
Align is typically 8-byte but for a very large RAM may need to be 16-byte.
CCPS is Compressed Classes in an object header i.e. 4 bytes instead of 8.
You may find most typical layouters here https://github.com/openjdk/jol/blob/master/jol-cli/src/main/java/org/openjdk/jol/operations/EstimatedModels.java
Heap dump *.hprof files analysers:
- The Lightweight Java Visualizer (LJV) a tool for visualizing Java data structures
- The IntelliJ IDEA has a built-in heap dump analyser
- Eclipse Memory Analyzer (MAT)
- VisualVM can also monitor heap in real time. Based on NetBeans
- Java Mission Control
- JMH Micro benchmarks tool and the Intellij JMH plugin
