- Prometheus: for recording/scraping metrics from the application
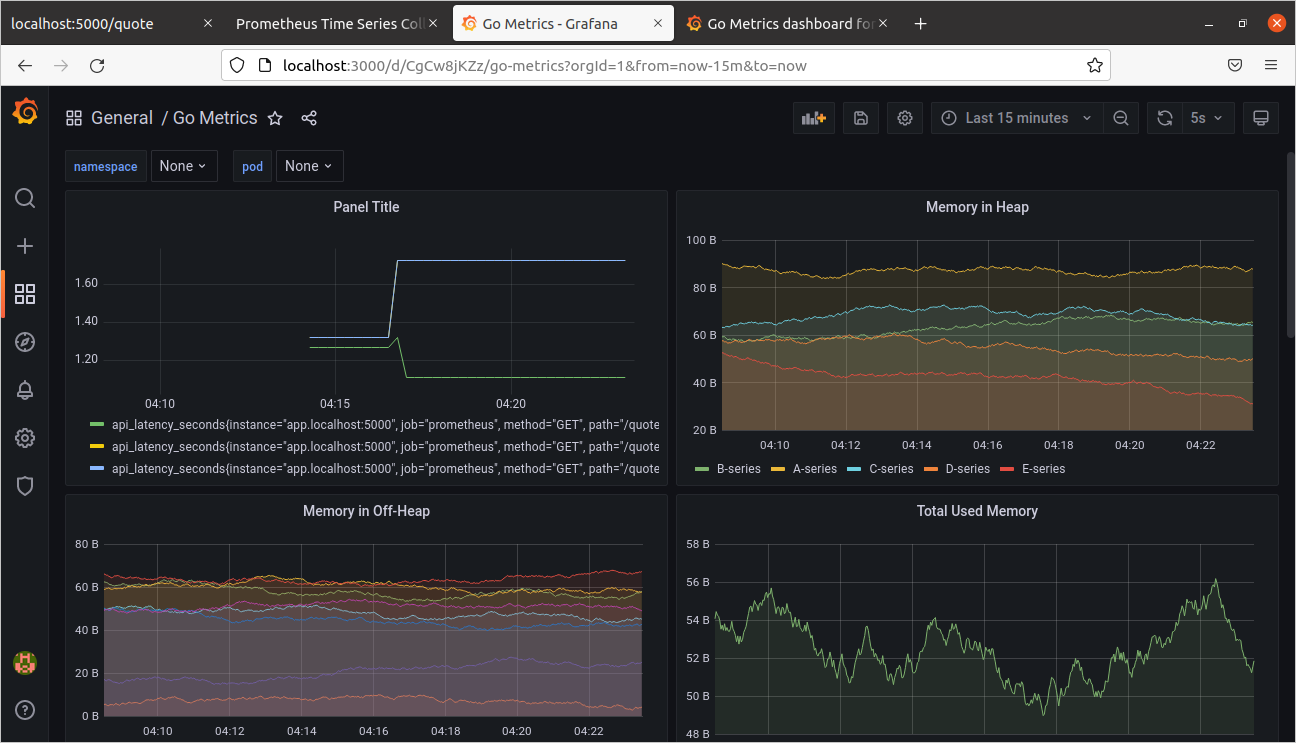
- Grafana: for visualizing the obtained metrics from the prometheus server
NOTE: Docker and Docker compose are required.
- Run the services (app, prometheus, grafana) using docker-compose -
docker-compose.yml
$ docker-compose up --build - View the scraped metrics at
http://localhost:5000/metrics - Hit the quote endpoint at
http://localhost:5000/quoteto record theapi_latency_secondsmetric for that path. - Query the metrics on the prometheus server at
http://localhost:9090 - Visualize the metrics on grafana at
http://localhost:3000
Grafana authentication details are available at
/grafana/grafana.ini
Create your dashboard on Grafana, add the desired datasource (prometheus server), and PromQL queries to visualize the metrics.
