Power BI Releases
Looking for an easy way to stay up to date with official Microsoft feature release dates? Use the Power BI Release Plan Report.
Built for the #STLPBIUG, used globally
Around The Web
Interesting content without you having to Bing search for it. (Yes, people use Bing!)
Content Glossary
- June 2021
- May 2021
- March 2021
- February 2021
- November 2020
- October 2020
- August 2021
- July 2020
- June 2020
- April 2020
June 2021
Introduction to Power BI L100
Description: This training provides an introduction to Power BI, the business analytics service that delivers insights to enable fast, informed decisions. Learn how easy it is to transform your data into powerful visuals and share with colleagues on any device. Participants will leave understanding how they can connect with and get value out of their data in a way that was previously not possible.
Power BI Skills Triangle
Description: Power BI is becoming this huge product, with so many different components, the possibilities are almost endless. From data modelling, to data visualisation, to data governance, to machine learning, to embedding... you name it! But one thing Mara Pereira noticed over the years is that, because Power BI grew so much, people started to "specialise" in one of 3 core areas: Data Modelling, Data Visualisation and Governance & Admin.
Enter the Power BI Skills Triangle!

Intro to AutoML in Power BI
Description: In this session, Sandeep Pawar will take a technical deep dive into AutoML and not just build models but also look at how to evaluate, interpret and manage these models. If you are new to machine learning, he will cover the practical aspects of machine learning and best practices of deploying the models.
Paginated Reports GOTCHAS
Description: Greyskull Analytics (Johnny Winter) introduces a series exploring 'GOTCHAS' when using Power BI Paginated Reports.

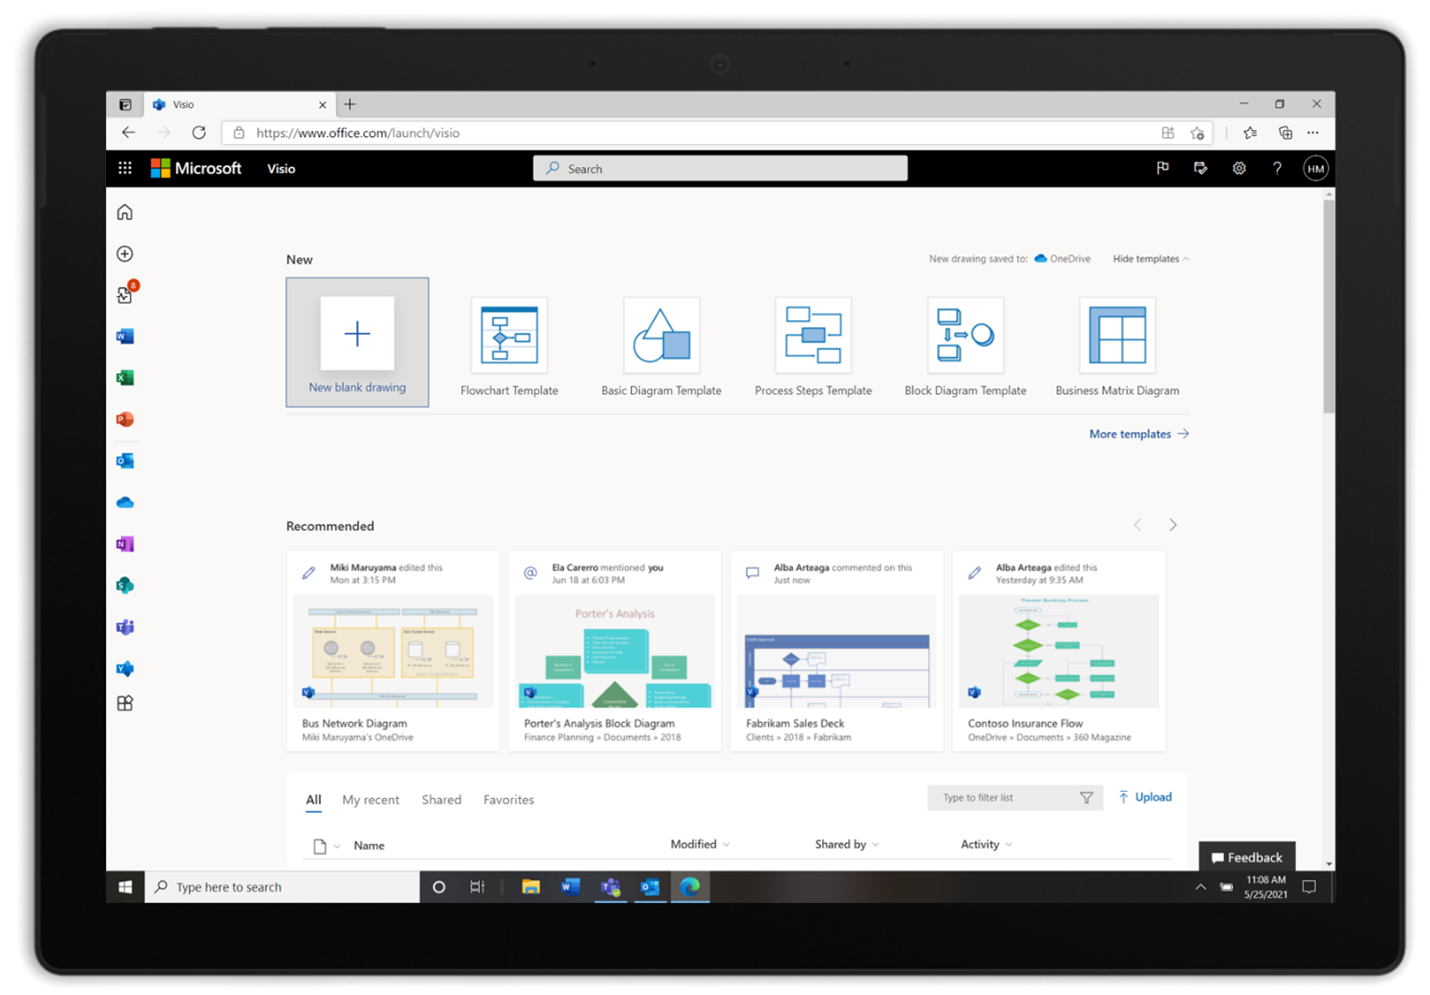
Visio Licensing
Description: Chris Webb explores the Visio web app licensing changes and the added benefit for Power BI users.
Official Announcement: In July, we’ll start rolling out a lightweight version of the Visio web app in Microsoft 365 to bring visual diagramming and collaboration to all teams—both of which are especially important in this hybrid work environment. But the best part? It’ll be available, at no additional cost, for all commercial license subscribers.
St Louis SQL Server and Business Intelligence User Group
Description: The St. Louis SQL Server (STLSSUG) and Business Intelligence (STLBIUG) user groups purpose is to establish channels of communication and education for individuals working with the SQL Server Database Management System, Microsoft's Modern Data Warehouse and Business Intelligence tools.
Learning SQL
Description: Here is a blog by Barrett Studdard, https://datastud.dev/ covering the basics of SQL in short articles.
Best Practices to Improve Power BI Performance and Design
Description: In this session, Michael Kovalsky (PBICAT) will teach attendees how to automatically scan their model to ensure that it aligns to standard best practices for performance and design.
May 2021
STLPBIUG
Description: St Louis Power BI User Group is dedicated to Power BI power users, developers, or dabblers to share their enthusiasm and knowledge of Microsoft's Business Intelligence services. (Power BI Community Forum)
Organizational Reporting
Description: Microsoft Learn Organizational Reporting is a service available to enterprise customers and educational organizations to view Microsoft Learn training progress and achievements of the individuals within their tenant using Azure Data Share. Azure Data Share enables organizations to securely share data with multiple customers and partners. In just a few clicks, you can provision a new data share account, add datasets, and invite your customers and partners to your data share. Data providers are always in control of the data that they have shared and Azure Data Share makes it simple to manage and monitor what data was shared, when, and by whom.

Enable QUERY FOLDING for native queries
Description: How to enable query folding when writing native queries. (Limited supported connectors)
PowPoCo
Description: We are a bunch of Power Platform enthusiasts looking to share knowledge, find answers, and also some fun.

Analysis Services Tabular Protocol
Description: Specifies an extension of the SQL Server Analysis Services protocol [MS-SSAS] by specifying the methods for a client to communicate with and perform operations on an analysis server that uses Tabular databases that are at compatibility level 1200 or higher.
Charticulator Visual Series
Description: Users can create a wide range of custom chart designs within PBI using the brand-new Microsoft Charticulator custom visual. PowerBI.tips has created a video series on YouTube to walk new users through the creation experience.

Bing Wallpaper
Description: Bing Wallpaper includes a collection of beautiful images from around the world that have been featured on the Bing homepage. Not only will you see a new image on your desktop each day, but you can also browse images and learn where they're from.

March 2021
Drive a data culture with Power BI
Description: Power BI can help you drive a data culture. Learn why 97% of the Fortune 500 use Power BI today and customers large and small are standardizing on Power BI. We will cover our vision and roadmap. You will see how AI automatically find patterns in your data, you will learn about how Power BI is built into Teams and Excel to enable incredible collaboration experiences, and how Power BI with Synapse meets your most demanding needs. We also have a few exciting new announcements to share!
Premium Per User Pricing Announcement
Price: $20 USD as a standalone / $10 as an add-on to existing Pro/E5 licensed users
Availability: April 2nd, 2021
Power BI Embedded Playground
Description: Updated Embedded Playground experience, including drag and drop code building.

Data Modeling and Shaping
Description: This fantastic team will walk us through Power BI capabilities to enhance the data model and help shape your data for business users.
Click here! to join Power BI instructor led training part 1. Wednesday 24 March, 2021 from 3:00 PM – 7:00 PM CST.
Click here! to join Power BI instructor led training part 2. Thursday 25 March, 2020, from 3:00 PM – 7:00 PM CST.

12 Days of Paginated Reports
Description: Laura Graham Brown introduces Paginated Reports to new users over the course of twelve short YouTube videos.
PowerPivotPro Paginated Reports Series
Description: A multipart series that includes excellent commentary around how Power BI Reports and Paginated Reports can be #BetterTogether when used in tandem.
Power BI and Paginated Reports: Have We Come Full Circle?
Paginated Reporting and Power BI: Why You Probably Need Both
Power BI and Paginated Reports: Better Together

February 2021
Microsoft Ignite 2021
Description: Microsoft’s annual gathering of technology leaders and practitioners delivered as a digital event experience. Numerous Power BI announcements including Premium Per User pricing.
When: March 2–4, 2021
Admin in a Day
Description: This course covers key aspects of a successful Power BI administration, creating a Power BI tenant, managing access and permissions, managing resources and capacity, Premium capacity administration, broadening the reach – embedded, working with the Data Gateway and best practices for successful Power BI administration. Each of the 10 modules will be delivered and monitored for questions by an MVP.
When: February 24th and 25th, 2021 (2 half sessions) - starting at 7:00 AM to 11:00 AM CST
Workout Wednesday
Description: A staple within the data visualization community for years, the Power BI edition of #WorkoutWednesday will welcome new users to the community with a new challenge released every week.

Customer Story Nestle
Description: In early 2018, Nestlé released Power BI to all its users globally. Since becoming generally available, the company’s user base has grown to over 45,000 monthly active users. As Nestlé has developed its strategy around self-service BI, it has taken action in phases. By incrementally implementing Power BI, it continues to create a strong and lasting solution.
Power BI Dev Camp
Description: Various pro-level topics ranging from embedding in custom applications, PowerShell cmdlets, developing custom visuals, M deep dives

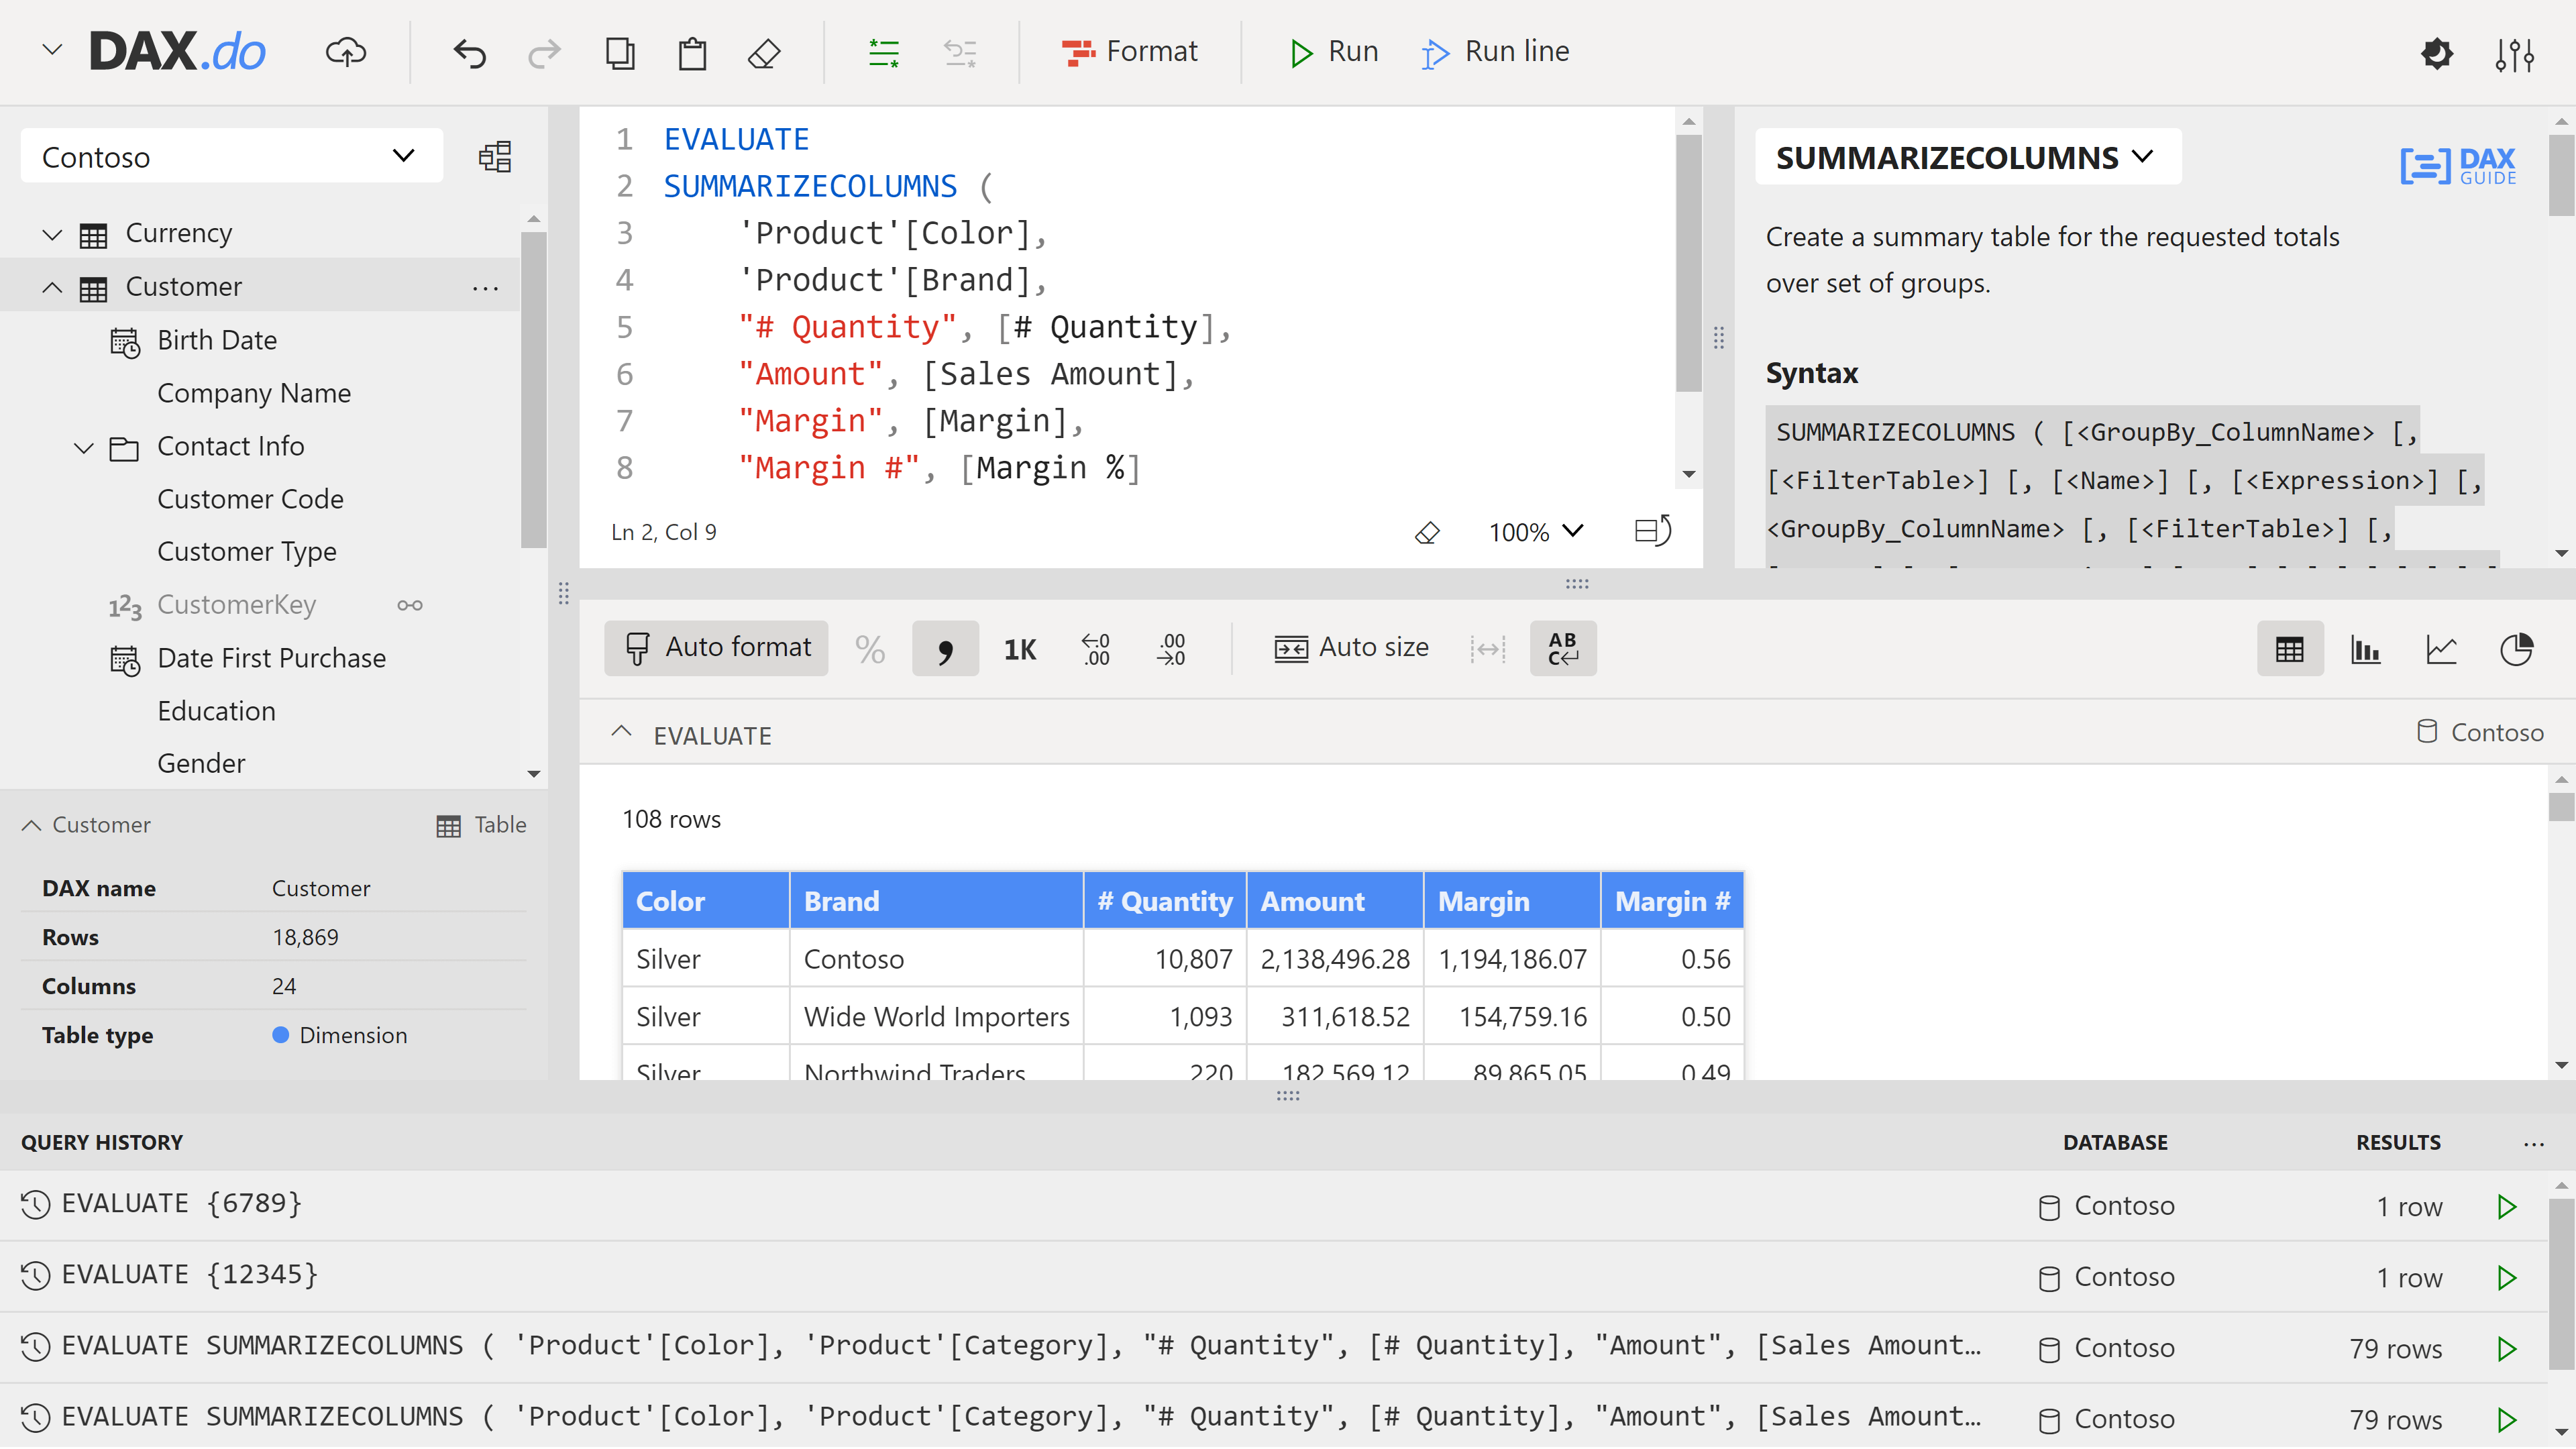
DAX.do
Description: A new website by SQLBI where you can write and run DAX queries over a sample Contoso database. The goal of DAX.do is purely educational: if you are learning DAX or are merely curious to test a new DAX syntax, you now have a readily-available playground to do that. It does not require you to install any software. It does not even require a computer. If you suddenly feel the urge to test a new DAX idea, DAX.do also works on your mobile phone!
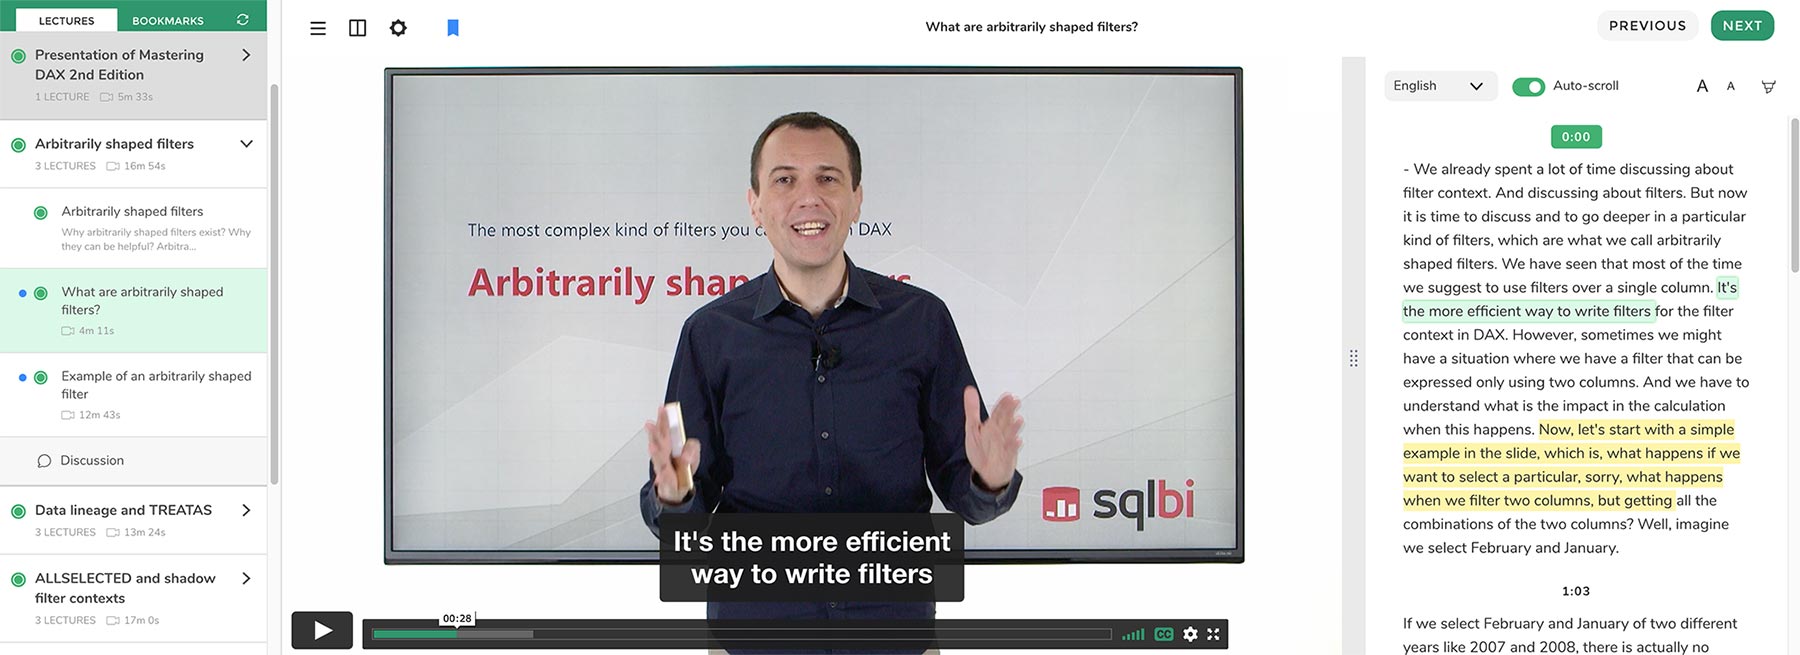
DAX Tools
Description: A new FREE course by SQLBI, the DAX Tools video course teaches how to use three popular tools to write and optimize DAX: DAX Studio, VertiPaq Analyzer, and Analyze in Excel for Power BI Desktop. All these tools are free and open-source.
Composite Models
Description: "This is how evolution works… and technological evolution is no exception. But failures caused by the misuse of a technology do not constitute proof of its irrelevance. It is the adoption of this technology throughout the next decade that will write the story." - SQLBI
November 2020
Advanced Power BI Training
Description: The Advanced Power BI Training can be re-watched on demand. This was a 1-day instructor led training to walk users through Power BI capabilities to enhance data models for your business users.
Power BI Women
Description: A community to help create equal opportunities for women in Power BI.

Power BI Field Finder
Description: There's no easy way of finding out where columns and measures are used in the visuals of reports, problem solved with the Field Finder :)

Create an interactive legend in your Power BI Map
Descripton: In this post Shannon Lindsay will show you how she created an interactive legend in Power BI that can be used with any of the map visuals.

October 2020
Curbal show last label only on a line chart in Power BI
Special shout out to Barrett Studdard
Description: Displaying only the last label on a line chart is quite a common scenario that is not supported in Power BI by default, in this video Curbal shows you how to do that with a little bit of DAX magic!
August 2020
PowerBI.tips Business Ops
Description: The Business Ops tool is designed to simplify your Development Experience with Power BI Desktop. There are a lot of challenges remembering where all the best power bi external tools are stored. Many MVPs contribute amazing projects to make your development experience better. The Business Ops installer is intended to streamline and increase your efficiency when working in Power BI.
July 2020
Power Query / M Language - Visual Studio Code extension
Description: Provides a language service for the Power Query / M formula language with the following capabilities:
- Suggestions / Auto complete (Based on M standard library functions, and keywords)
- Parameter hints
- Hover
- Code formatting
- Syntax validation
DA-100 Exam (General Availability)
Description: Data Analysts enable businesses to maximize the value of their data assets by using Microsoft Power BI. As a subject matter expert, Data Analysts are responsible for designing and building scalable data models, cleaning and transforming data, and enabling advanced analytic capabilities that provide meaningful business value through easy-to-comprehend data visualizations. Data Analysts also collaborate with key stakeholders across verticals to deliver relevant insights based on identified business requirements.
Rendering 1.2 Million points in Power BI
Description: Just to be clear, this only proof of concept, rendering a big dataset will be slow and will eat all your memory, and you will probablyget errors in shared workspace, or if you are in a premium workspace, you will probably end up in trouble, but it is cool.
Learn more about the Icon Map.

June 2020
DAX Studio Query Builder
Description: The query builder provides a drag and drop interface for building queries against your data model.

April 2020
Microsoft Editor Spelling & Grammar Checker Extension
Description: Editor provides grammar, spelling, and style suggestions across multiple sites (1), so you can confidently write clear, concise posts and emails. This is a free browser extension and additional features can be unlocked when signing in with your O365 credentials.

Paginated Reports in a Day
Description: The Power BI Paginated Reports in a Day video-based course empowers you as a report author with the technical knowledge required to create, publish, and distribute Power BI paginated reports.
Tabular Editor Playlist
Description: Tabular Editor is an incredible Tool that enables users to manipulate a Tabular model at lighting speeds. Daniel Otykier is the creator of the Tabular Editor program. PowerBI.tips produced a video series to enable users of Power BI and data modelers for Analysis Services to learn more about this program.
Power Query Data Mashup cmdlets
Description: Import and export Power Query from Microsoft Excel (xlsx, xlsm, xlsb) and Microsoft Power BI (pbix, pbit) files using PowerShell Core!