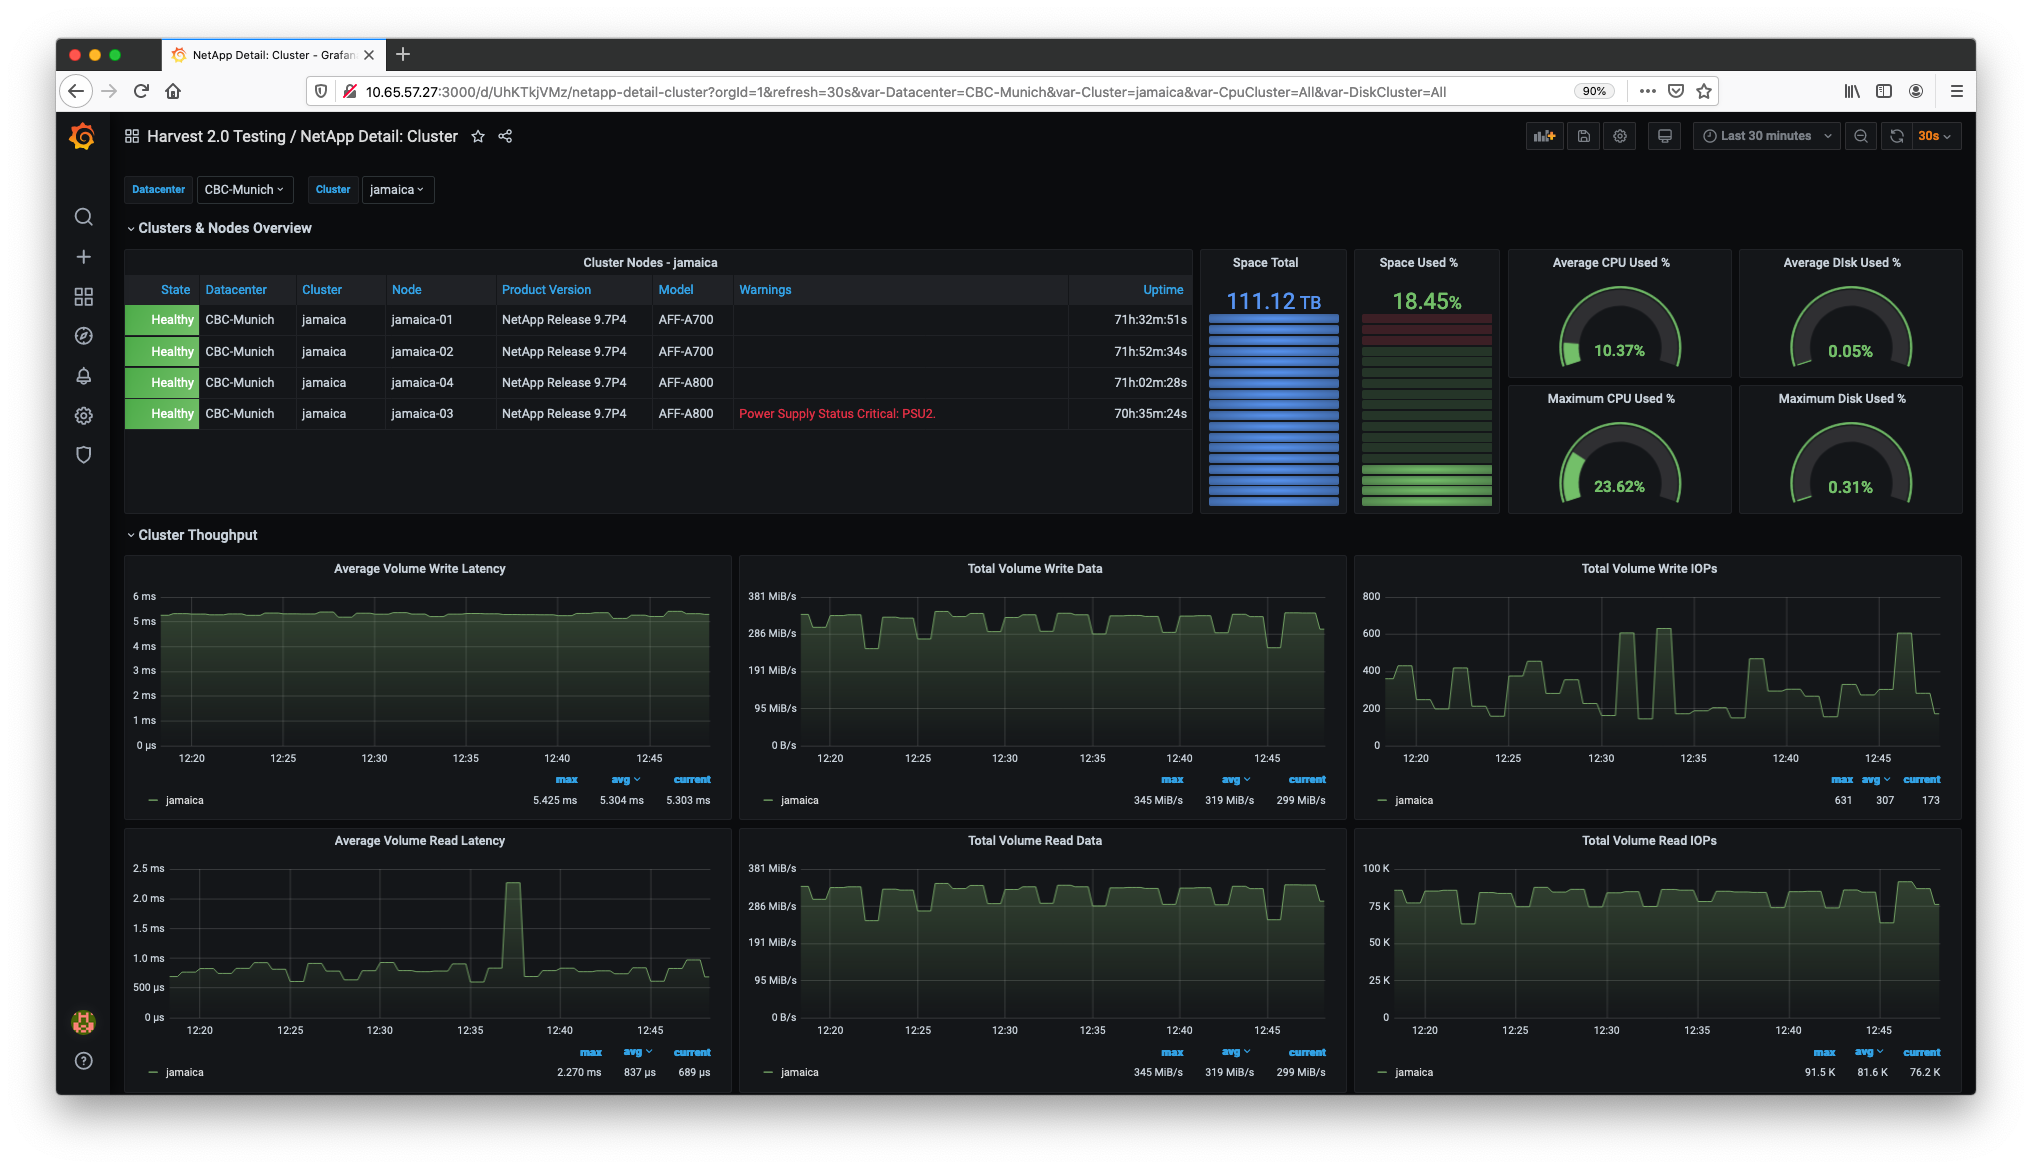
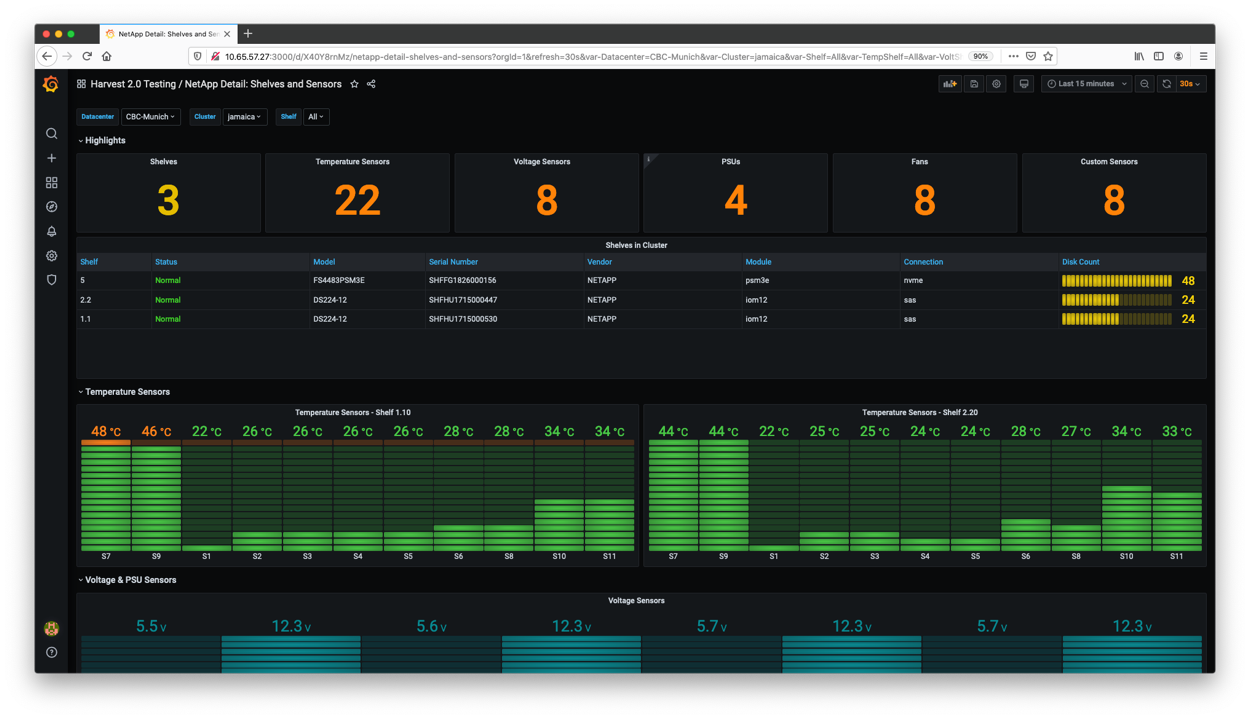
The swiss-army knife for monitoring datacenters. The default package collects performance, capacity and hardware metrics from ONTAP clusters. New metrics can be collected by editing the config files. Metrics can be delivered to Prometheus and InfluxDB databases - and displayed in Grafana dashboards.
Harvest's architecture is flexible in how it collects, augments, and exports data. Think of it as a framework for running collectors and exporters concurrently. You are more than welcome to contribute your own collector, plugin or exporter (start with our ARCHITECTURE.md).
Harvest is written in Go, which means it runs on recent Linux systems. It also runs on Macs, but the process isn't as smooth yet.
Optional prerequisites:
dialogorwhiptail(used by theconfigutility)openssl(used byconfig)
Hardware requirements depend on how many clusters you monitor and the number of metrics you chose to collect. With the default configuration, when monitoring 10 clusters, we recommend:
- CPU: 2 cores
- Memory: 1 GB
- Disk: 500 MB (mostly used by log files)
Harvest is compatible with:
- Prometheus:
2.24or higher - InfluxDB:
v2 - Grafana:
7.4.2or higher
We provide pre-compiled binaries for Linux, RPMs, and Debs.
Visit the Releases page and copy the tar.gz link you want to download. For example, to download the v21.05.1 release:
wget https://github.com/NetApp/harvest/releases/download/v21.05.1/harvest-21.05.1-1.tar.gz
tar -xvf harvest-21.05.1-1.tar.gz
cd harvest-21.05.1-1

# Run Harvest with the default unix localhost collector
bin/harvest start
If you don't have wget installed, you can use curl like so:
curl -L -O https://github.com/NetApp/harvest/releases/download/v21.05.1/harvest-21.05.1-1.tar.gz
Installation of the Harvest package may require root or administrator privileges
Download the latest rpm of Harvest from the releases tab and install with yum.
$ sudo yum install harvest.XXX.rpm
Once the installation has finished, edit the harvest.yml configuration file located in /opt/harvest/harvest.yml
After editing /opt/harvest/harvest.yml, manage Harvest with systemctl start|stop|restart harvest
- Directories
/var/log/harvest/and/var/log/run/are created - A
harvestuser and group are created and the installed files are chowned to harvest - Systemd
/etc/systemd/system/harvest.servicefile is created and enabled
Installation of the Harvest package may require root or administrator privileges
Download the latest deb of Harvest from the releases tab and install with apt.
$ sudo apt install ./harvest-<RELEASE>.amd64.deb
Once the installation has finished, edit the harvest.yml configuration file located in /opt/harvest/harvest.yml
After editing /opt/harvest/harvest.yml, manage Harvest with systemctl start|stop|restart harvest
- Directories
/var/log/harvest/and/var/log/run/are created - A
harvestuser and group are created and the installed files are chowned to harvest - Systemd
/etc/systemd/system/harvest.servicefile is created and enabled
Work in progress. Coming soon
To build Harvest from source code, first make sure you have a working Go environment with version 1.15 or greater installed.
Clone the repo and build everything.
git clone https://github.com/NetApp/harvest.git
cd harvest
make
bin/harvest version
If you're building on a Mac use GOOS=darwin make build
Checkout the Makefile for other targets of interest.
Harvest's configuration information is defined in harvest.yml. There are a few ways to tell Harvest how to load this file:
-
If you don't use the
--configflag, theharvest.ymlfile located in the current working directory will be used -
If you specify the
--configflag like soharvest status --config /opt/harvest/harvest.yml, Harvest will use that file
To start collecting metrics, you need to define at least one poller and one exporter in your configuration file. The default configuration comes with a pre-configured poller named unix which collects metrics from the local system. This is useful if you want to monitor resource usage by Harvest and serves as a good example. Feel free to delete it if you want.
The next step is to add pollers for your ONTAP clusters in the Pollers section of the configuration file. Refer to the Harvest Configuration Section for more details.
Start all Harvest pollers as daemons:
$ bin/harvest startOr start a specific poller(s):
$ bin/harvest start jamaica grenadaReplace jamaica and grenada with the poller names you defined in harvest.yml. The logs of each poller can be found in /var/log/harvest/.
The Grafana dashboards are located in the $HARVEST_HOME/grafana directory. You can manually import the dashboards or use the harvest grafana command (more documentation).
Note: the current dashboards specify Prometheus as the datasource. If you use the InfluxDB exporter, you will need to create your own dashboards.
If you use a Prometheus Exporter, open a browser and navigate to http://0.0.0.0:12990/ (replace 12990 with the port number of your poller). This is the Harvest created HTTP end-point for your Prometheus exporter. This page provides a real-time generated list of running collectors and names of exported metrics.
The metric data that's exposed for Prometheus to scrap is available at http://0.0.0.0:12990/metrics/. For more help on how to configure Prometheus DB, see the Prometheus exporter documentation.
If you can't access the URL, check the logs of your pollers. These are located in /var/log/harvest/.
The main configuration file, harvest.yml, consists of the following sections, described below:
All pollers are defined in harvest.yml, the main configuration file of Harvest, under the section Pollers.
| parameter | type | description | default |
|---|---|---|---|
| Poller name (header) | required | poller name, user-defined value | |
datacenter |
required | datacenter name, user-defined value | |
addr |
required by some collectors | IPv4 or FQDN of the target system | |
collectors |
required | list of collectors to run for this poller | |
exporters |
required | list of exporter names from the Exporters section. Note: this should be the name of the exporter (e.g. prometheus1), not the value of the exporter key (e.g. Prometheus) |
|
auth_style |
required by Zapi* collectors | either basic_auth or certificate_auth |
basic_auth |
username, password |
required if auth_style is basic_auth |
||
ssl_cert, ssl_key |
optional if auth_style is certificate_auth |
Absolute paths to SSL (client) certificate and key used to authenticate with the target system. If not provided, the poller will look for <hostname>.key and <hostname>.pem in $HARVEST_HOME/cert/.To create certificates for ONTAP systems, see the Zapi documentation |
|
use_insecure_tls |
optional, bool | If true, disable TLS verification when connecting to ONTAP cluster | false |
log_max_bytes |
Maximum size of the log file before it will be rotated | 10000000 (10 mb) |
|
log_max_files |
Number of rotated log files to keep | 10 |
|
This section is optional. If there are parameters identical for all your pollers (e.g. datacenter, authentication method, login preferences), they can be grouped under this section. The poller section will be checked first and if the values aren't found there, the defaults will be consulted.
All exporters need two types of parameters:
exporter parameters- defined inharvest.ymlunderExporterssectionexport_options- these options are defined in theMatrixdatastructure that is emitted from collectors and plugins
The following two parameters are required for all exporters:
| parameter | type | description | default |
|---|---|---|---|
| Exporter name (header) | required | Name of the exporter instance, this is a user-defined value | |
exporter |
required | Name of the exporter class (e.g. Prometheus, InfluxDB, Http) - these can be found under the cmd/exporters/ directory |
Note: when we talk about the Prometheus Exporter or InfluxDB Exporter, we mean the Harvest modules that send the data to a database, NOT the names used to refer to the actual databases.
This section is optional. You can uncomment the grafana_api_token key and add your Grafana API token so harvest does not prompt you for the key when importing dashboards.
Tools:
  #grafana_api_token: 'aaa-bbb-ccc-ddd'
Collectors are configured by their own configuration files, which are subdirectories in conf/. Each collector can define its own set of parameters.

