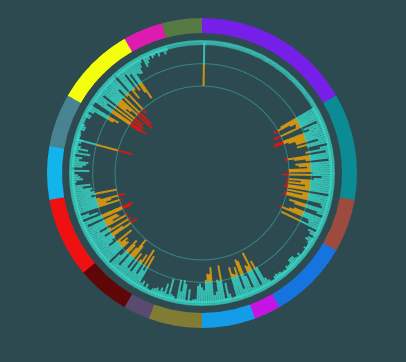
A D3.js library to create a circular historgram with interior series
Based on the micropolar polar plot library.
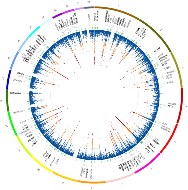
Inspired by Nat Genet's work with immune-related loci.
The best set up is to have an html page where the chart is displayed (e.g. index.htm) which calls a javascript set up file (histogram-start.js):
index.htm
	<!DOCTYPE html>
	<html lang="en">
	  <head>
	    <meta charset="utf-8">
	    <meta http-equiv="X-UA-Compatible" content="IE=edge">
	    <meta name="viewport" content="width=device-width, initial-scale=1">
	    <!-- The above 3 meta tags *must* come first in the head; any other head content must come *after* these tags -->
	    <meta name="description" content="">
	    <meta name="author" content="">

	    <title>Circular Historgram</title>

	    <!-- Polar -->
	    <!--<script type='text/javascript' src="http://d3js.org/d3.v3.min.js"></script> -->
	    <script type='text/javascript' src="../lib/d3.js"></script>
	    <script type='text/javascript' src="../src/blackholesun.js"></script>

	  </head>
	  <body bgcolor="#2d4a50">
	    <div>
	          <center><div id="blackholesun"></div></center>
	    </div>
	    <script type='text/javascript' src="js/histogram-start.js"></script>
	  </body>
	</html>
histogram-start.js
	var configs = [
	    //r:  Length of BLUE series
	    {
	      dimensions: [
	            {label: 'Twitter', startArc: 0, endArc: 60, color: '#761fe8', name: 'Layer1', geometry: 'AreaChart', groupId: 1},
	            {label: 'Malware', startArc: 60, endArc: 100, color: '#0b8b94', name: 'Layer2', geometry: 'AreaChart', groupId: 2},
	            {label: 'Botnets', startArc: 100, endArc: 120, color: '#9d493f', name: 'Layer3', geometry: 'AreaChart', groupId: 3},
	            {label: 'Ransomware', startArc: 120, endArc: 150, color: '#1574e2', name: 'Layer4', geometry: 'AreaChart', groupId: 4},
	            {label: 'OpenSource', startArc: 150, endArc: 160, color: '#c614e4', name: 'Layer5', geometry: 'AreaChart', groupId: 5},
	            {label: 'CI Banking', startArc: 160, endArc: 180, color: '#139de8', name: 'Layer6', geometry: 'AreaChart', groupId: 6},
	            {label: 'CI Power', startArc: 180, endArc: 200, color: '#827b33', name: 'Layer7', geometry: 'AreaChart', groupId: 7},
	            {label: 'CI Comms', startArc: 200, endArc: 210, color: '#594970', name: 'Layer8', geometry: 'AreaChart', groupId: 8},
	            {label: 'CVE', startArc: 210, endArc: 230, color: '#5f0706', name: 'Layer9', geometry: 'AreaChart', groupId: 9},
	            {label: 'DDoS', startArc: 230, endArc: 260, color: '#ef1011', name: 'Layer10', geometry: 'AreaChart', groupId: 10},
	            {label: 'Idenity Theft', startArc: 260, endArc: 280, color: '#13b4eb', name: 'Layer11', geometry: 'AreaChart', groupId: 11},
	            {label: 'CyberCrime', startArc: 280, endArc: 300, color: '#498391', name: 'Layer12', geometry: 'AreaChart', groupId: 12},
	            {label: 'APT', startArc: 300, endArc: 330, color: '#f4ff0d', name: 'Layer13', geometry: 'AreaChart', groupId: 13},
	            {label: 'ShadowBroker', startArc: 330, endArc: 345, color: '#dd1baf', name: 'Layer14', geometry: 'AreaChart', groupId: 14},
	            {label: 'DoD Cyber', startArc: 345, endArc: 360, color: '#577943', name: 'Layer15', geometry: 'AreaChart', groupId: 15}


	          ],

	      layout: { title: '', width: 400, height: 400, margin: { left: 30, right: 30, top: 00, bottom: 00, pad: 0 },
	        font: { family: 'Arial, sans-serif', size: 10, color: '#3ae1d0' },
	        direction: 'clockwise',
	        orientation: 375,
	        span: 360,
	        reverseOrder: true,
	        barWidth: 2,
	        radialAxis: { visible: true},
	        barmode: 'stack', backgroundColor: '#3ae1d0', showLegend: false }
	    }
	];

	configs.forEach(function(_config){
	    var config = {layout: {width: 300, height: 300}};
	    mu.util.deepExtend(config, _config);
	    console.log(JSON.stringify(mu.adapter.plotly().convert(config, true)));
	    var ms =blackholesun.Axis().config(config).render(d3.select('#blackholesun').append('div'));

	    //blackholesun.randomBars();

	    //Create some animation
	    grpChannelCount = [60,40,20,30,10,20,20,210,20,30,20,20,30,15,15]

	    grpLevels = [];
	    for(grp=1; grp<=15; grp++) {
	        maxLevel = Math.random();
	        channelLevel = [];
	        for(channel=1; channel <=grpChannelCount[grp-1]; channel++) {
	            channelLevel.push(maxLevel*Math.random());
	        }
	        grpLevels.push(channelLevel);
	    }

	    function updateGraph(levels) {
	        for(grp = 0; grp< levels.length; grp++) {
	            nextGroup=levels[grp];
	            for(channel=0; channel < nextGroup.length; channel++) {
	                t = nextGroup[channel];
	                blackholesun.updateBar(grp, channel, t);
	            }
	        }

	    }


	    function tweakLevels(levels) {

	        for(grp = 0; grp< levels.length; grp++) {
	            nextGroup=levels[grp];
	            for(channel=0; channel < nextGroup.length; channel++) {
	                old = nextGroup[channel];
	                change=Math.random();
	                if(change > 0.5) {
	                    delta = 0.25-(0.65*Math.random());
	                    newvalue=  old+delta;
	                    if(newvalue <0) newvalue=0;
	                    nextGroup[channel] = newvalue;

	                    blackholesun.updateBar(grp+1, channel, newvalue);
	                }
	            }
	        }

	    }

	    updateGraph(grpLevels);


	    setInterval(function () {
	        tweakLevels(grpLevels);
	    }, 1000);


	});

