NiMCity is a proof of concept for a simulator that can model the workings of a real-life housing market under simplified conditions. It is meant to help policy-makers craft new housing policies by testing them in a simulated municipality that resembles theirs.
- images: Folder with .png diagrams of the program's objects and behavior.
- simulations.ipynb: Jupyter Notebook with an example of a simulation run on San Francisco from 1980 - 2017, with plotted visualizations and hypothesis tests.
- nimcity.py: The Python code defining all the objects and functions in the program.
- nontechnical_slideshow.pdf: A pitch deck by a pretend consultancy to sell policy-makers on the utility of the program.
- sf1970.csv: Annual population estimates for San Francisco. (See source for the file in simulations.ipynb.)
NimCity contains objects for people and objects for places. The simulation generates as many people objects as the user inputs. These objects--'households', 'developers', and 'council'--call methods on the place objects in pursuit of their own economic self-interest. The place objects are 'districts', 'blocks', 'residences', and 'units.'D Developers 'build' these buildings; councils 'zone' them; households 'move into' and 'out of' them.
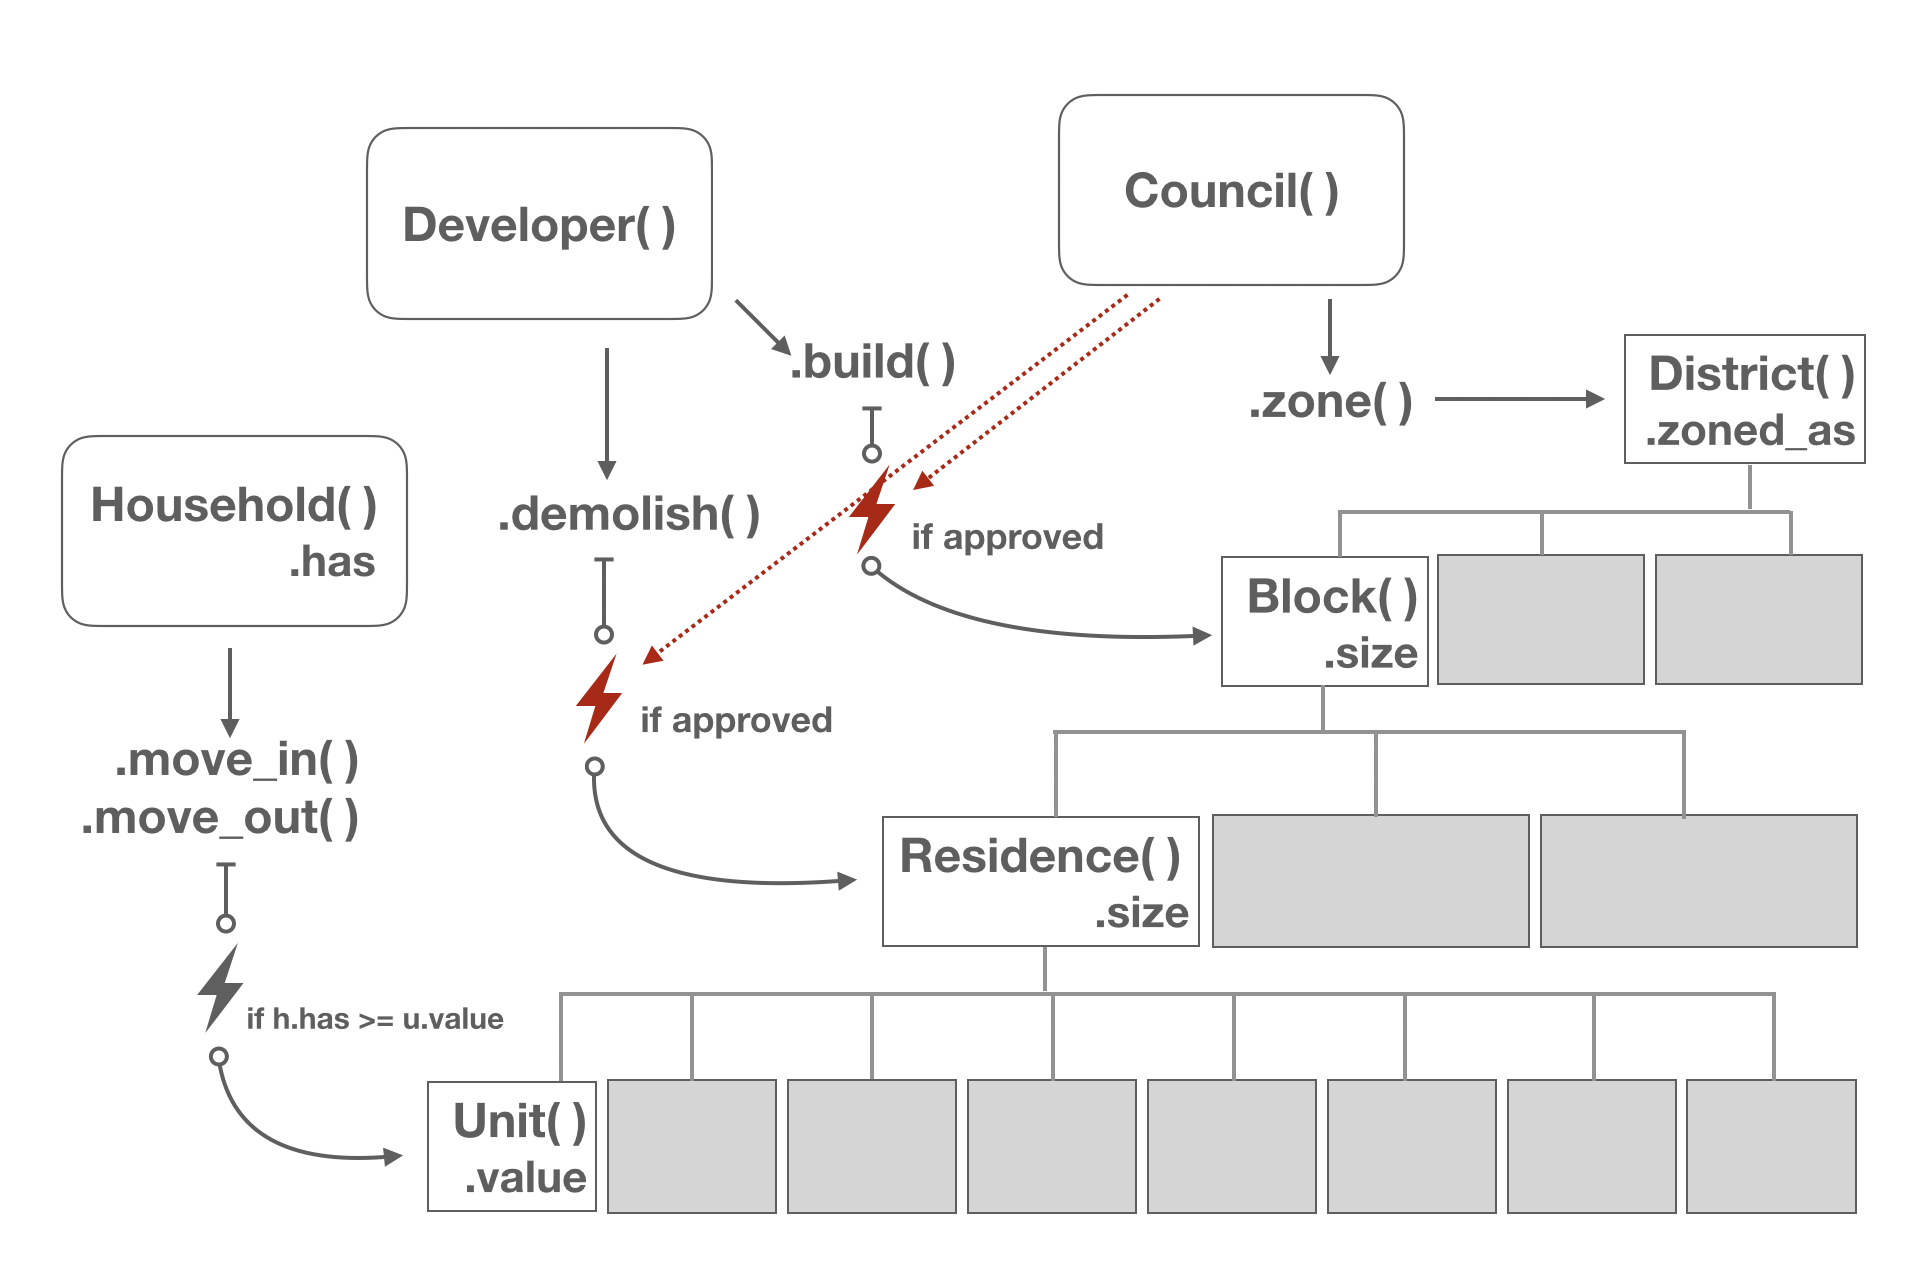
NimCity does not contain any actual 'space' or geographical data. Its objects understand the space they occupy as floating point numbers. They are attached to each other as attributes. If the simulation were a 'space', its objects' attachments to each other would give it a structure like this:
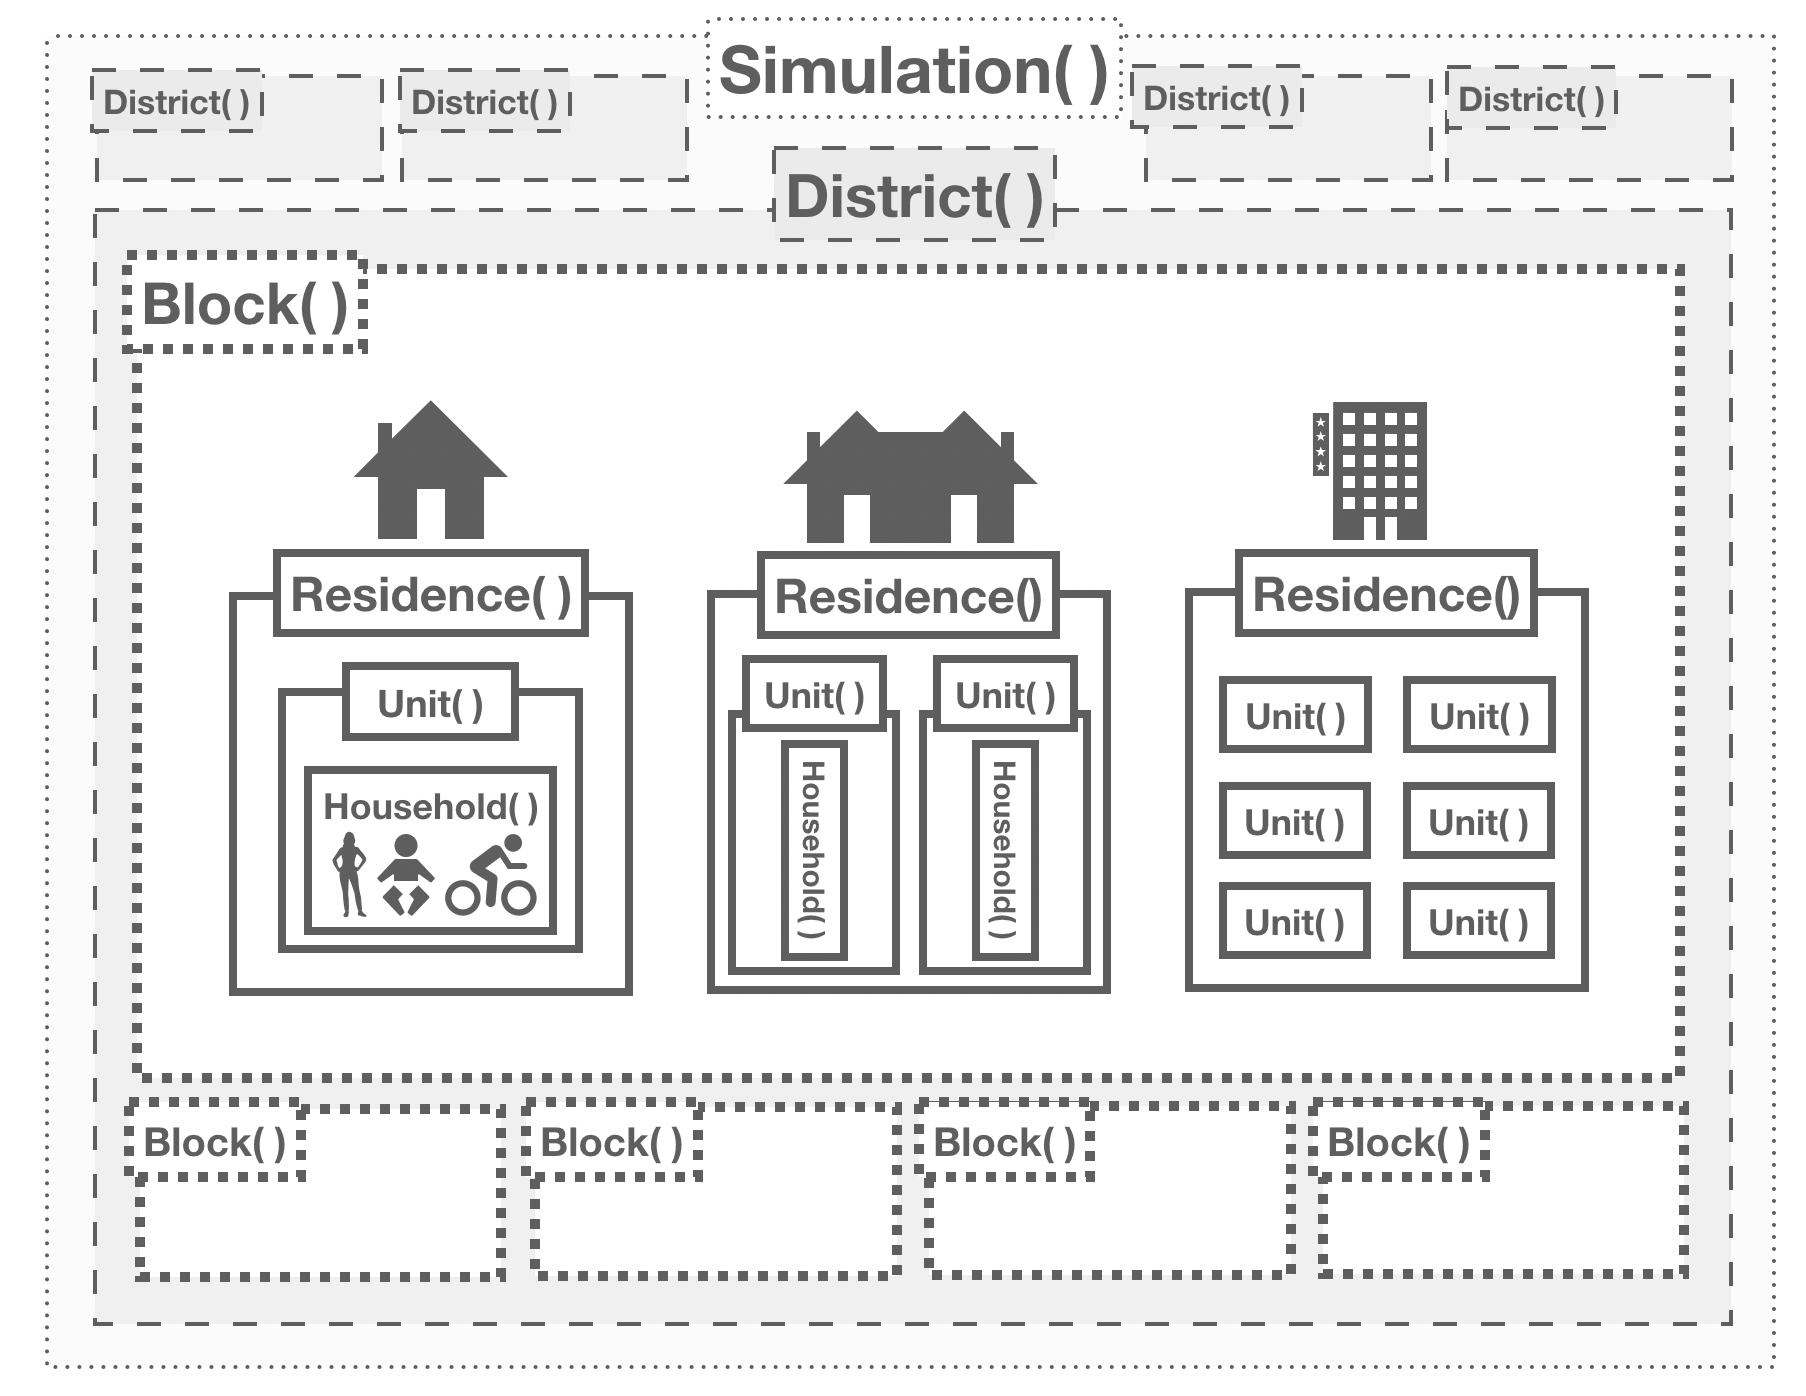
Households in units, units in residences, residences on blocks, blocks in districts, districts in the simulation.
A demand algorithm simulates the effect of supply and demand on the cost of housing over time. When households seek more units of housing at a given price point than are available, the percentage of households who didn't get what they wanted becomes a price 'spike.' The value they could have afforded becomes a 'ceiling.' All units of housing below the 'ceiling' get their price increased as a function of the 'spike.'
Over time, this may cause the price of housing to depart from the expected exponential trend of inflation.
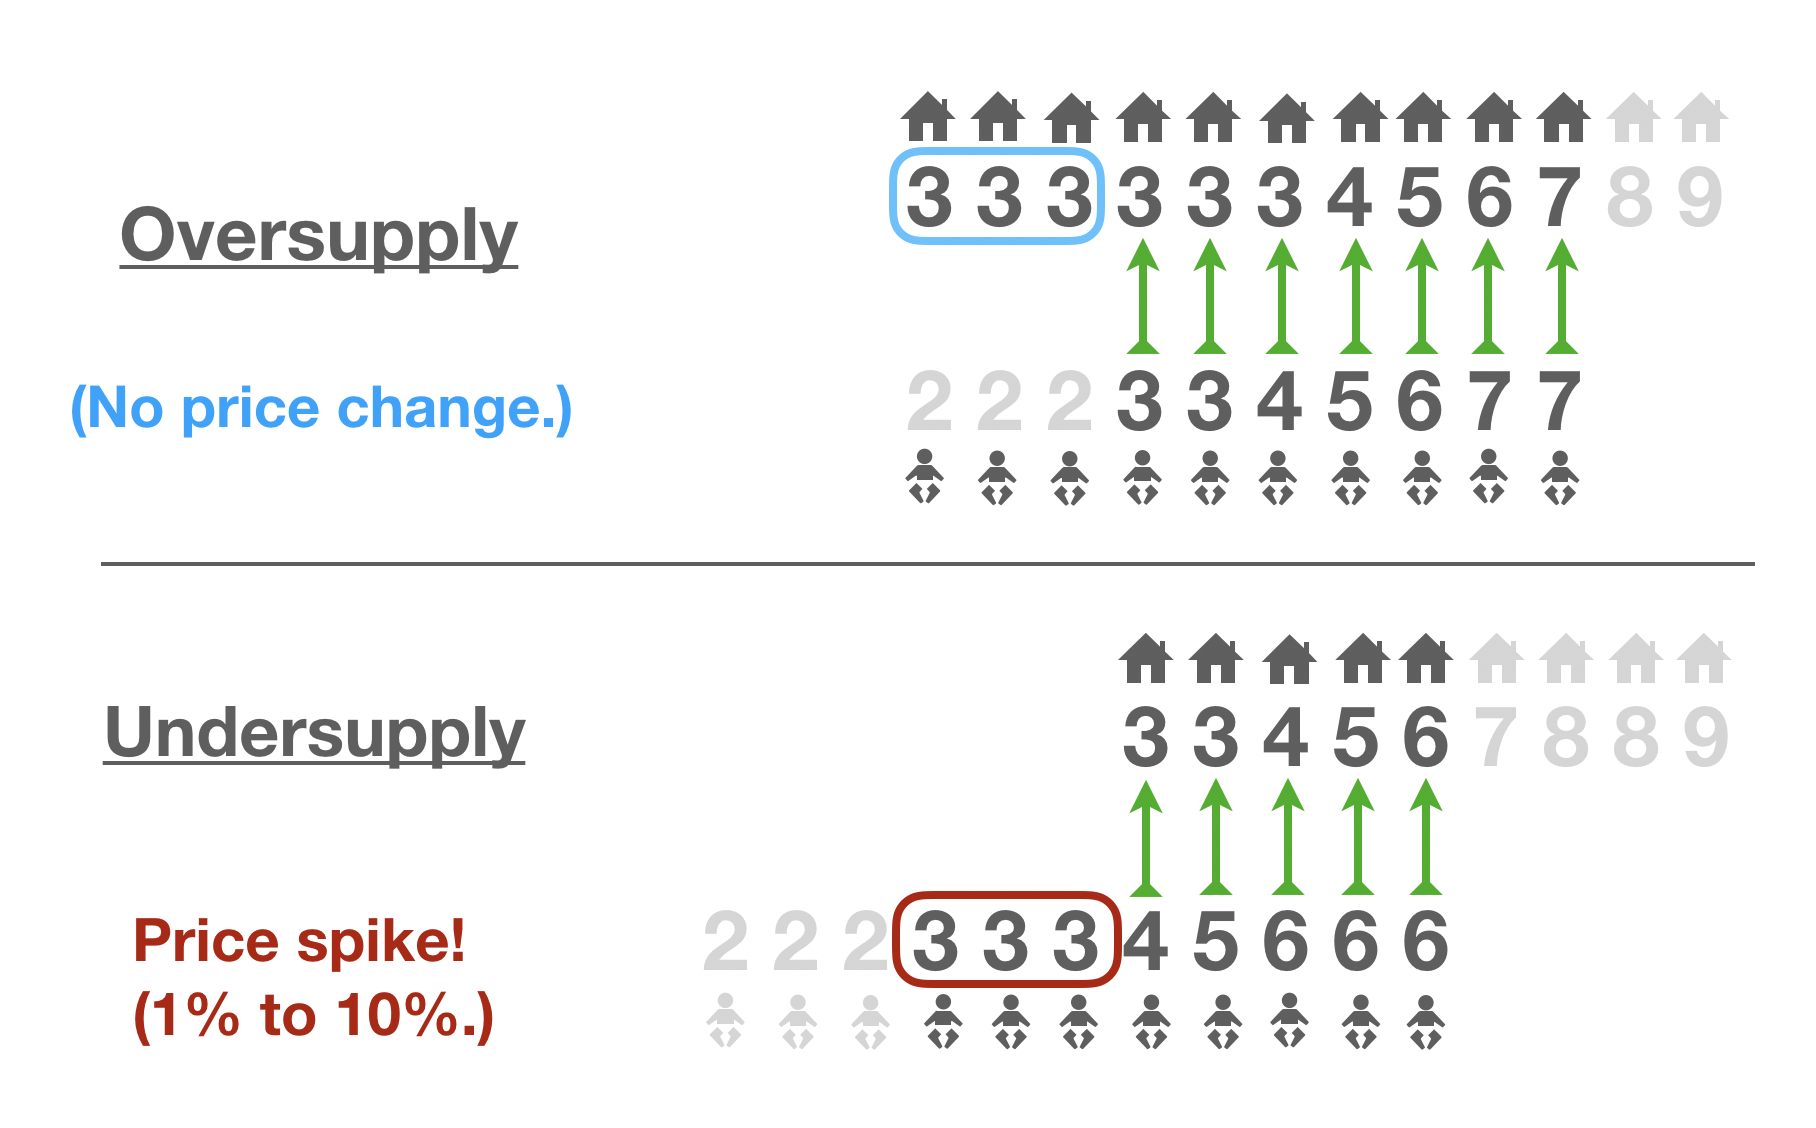
(The simulation does not contain an algorithm to reduce price in a scenario of over-supply.)
When you instantiate the simulation with the specified hyperparameters, it builds out the city and populates it with the first round of households. You may then run it for as many time steps as you like. Time steps are assumed to be 'years.' Shorter time steps would be possible but would require adjustments to some of the constants, e.g. annual inflation.
'Time' passes in a turn-based way in the simulation. At each time step, new households arrive, new buildings are constructed, old buildings are knocked down, households who can no longer afford their unit move out, and prices respond to demand.
To run the simulation with around half a million households and half a million housing units for 40 years takes about 2 minutes.
Objects accumulate personal histories as each time step passes. Each object has lists to record the other objects it was attached to and any numerical attributes, like value for a unit or spending power for a household.
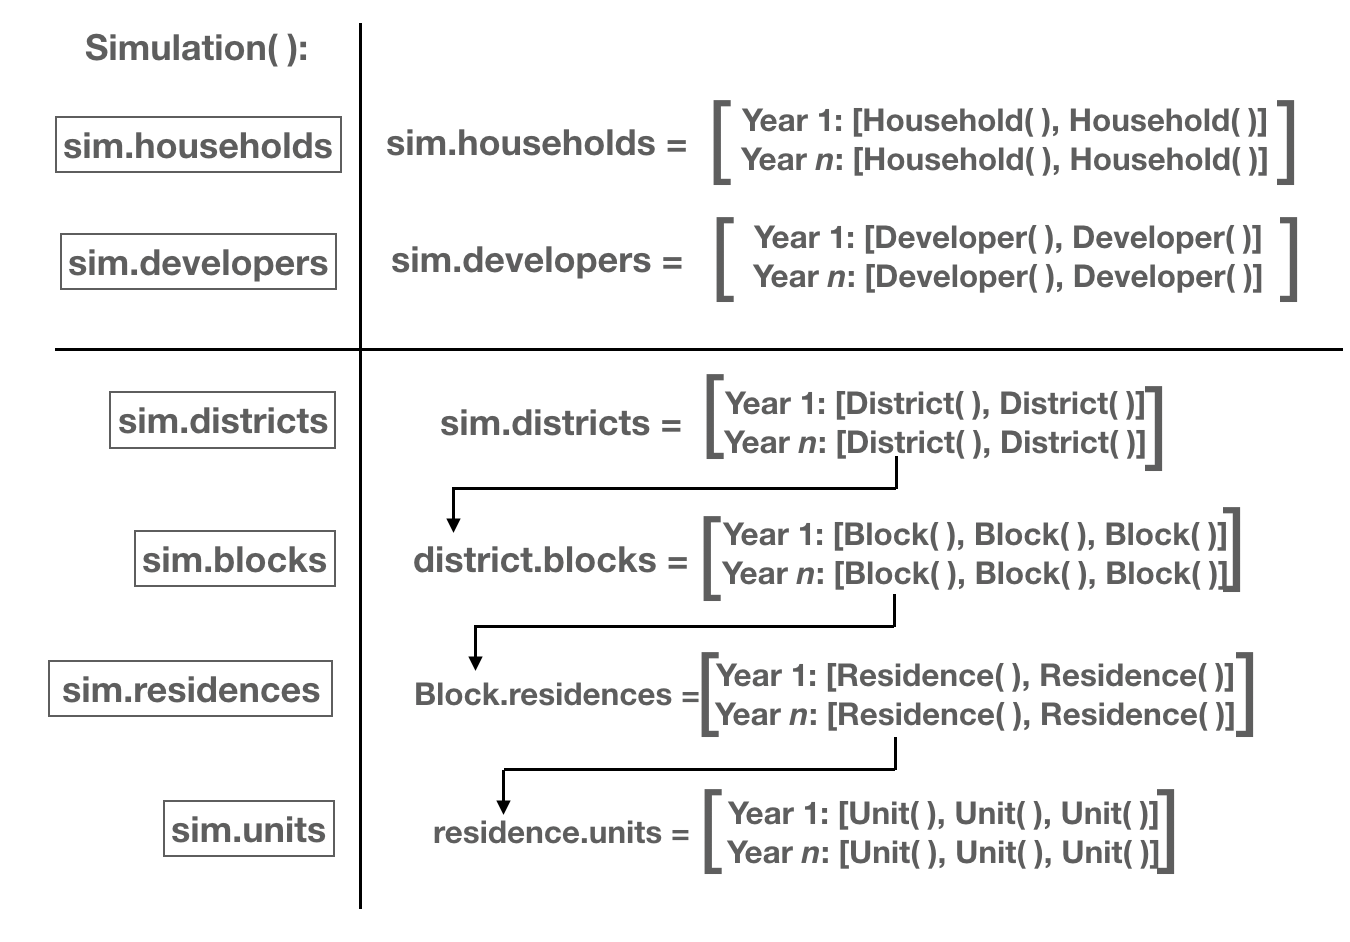
At the end of the simulation, the user may create a History object with the simulation passed to it as a parameter. The History object will take about the same amount of time to instantiate as the simulation took to run. THe history object uses a set of list comprehensions to crunch the loose unstructured data that accumulated during the simulation into tabular data. The user may extract and analyze the tabular data.
The user may also access objects from the simulation object using the list structure above. E.g. the first unit from the first time step would be sim.units[-1][0]. If that unit were assigned to the variable test_unit, you could follow the structure all the way up to see what district that unit lived in at a given time step, e.g. test_unit.housed[-1].residence.block.district would return the district object that that unit was in at the last time step.