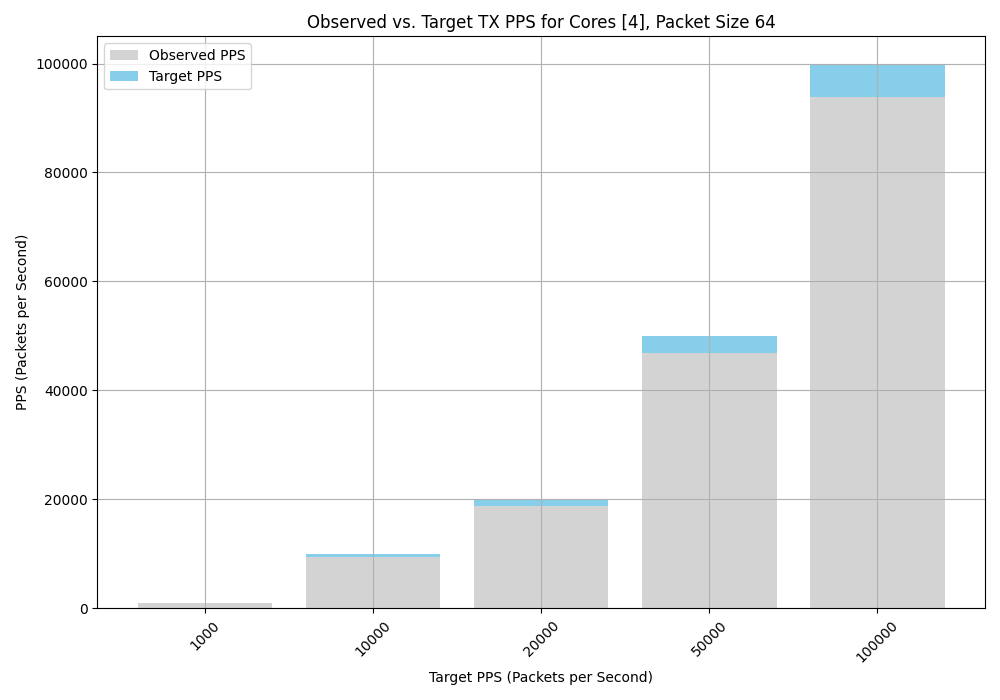
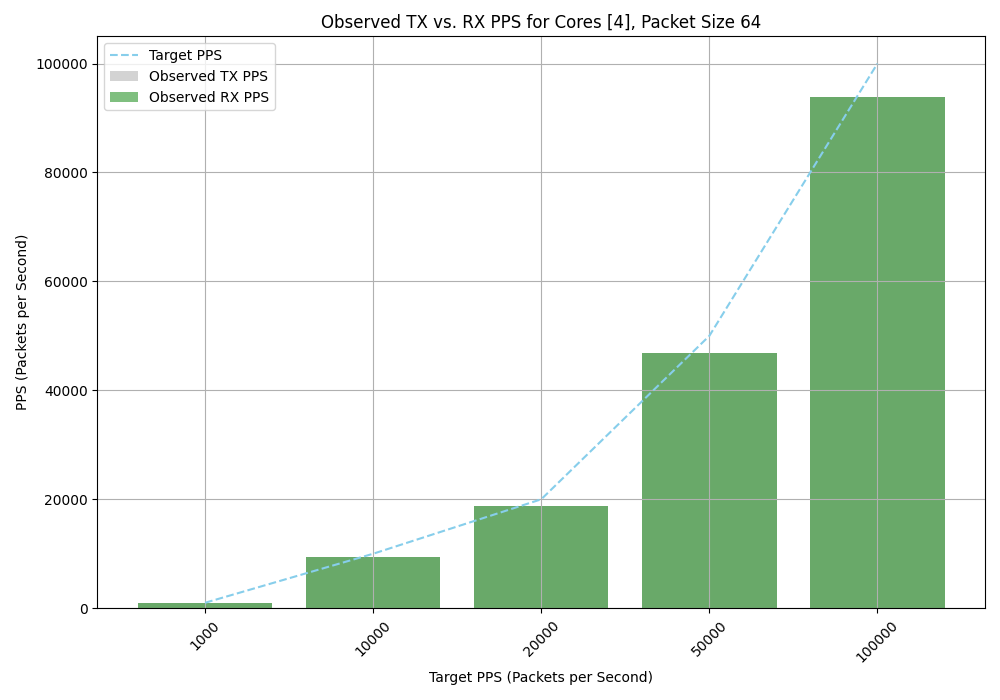
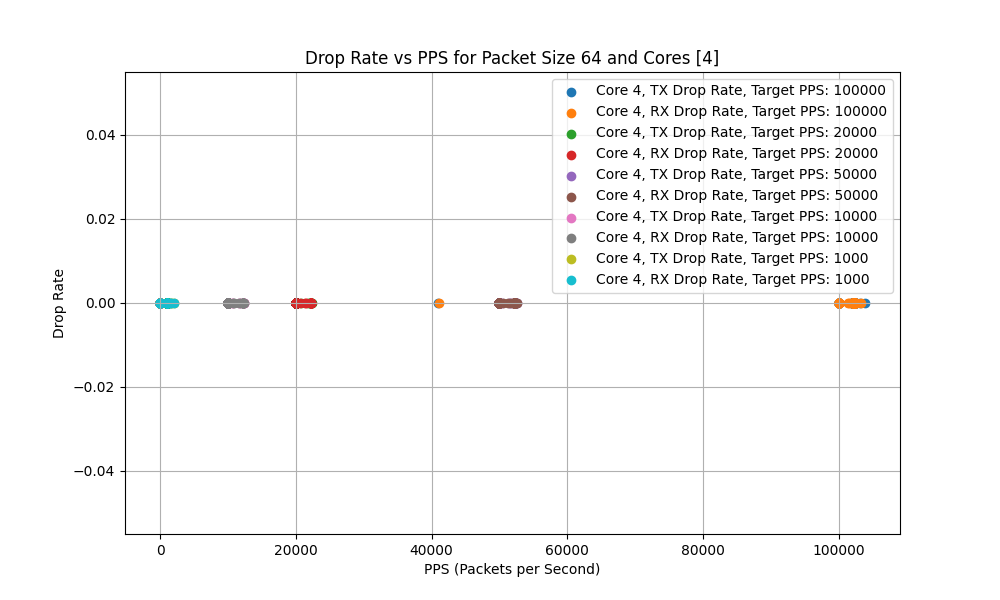
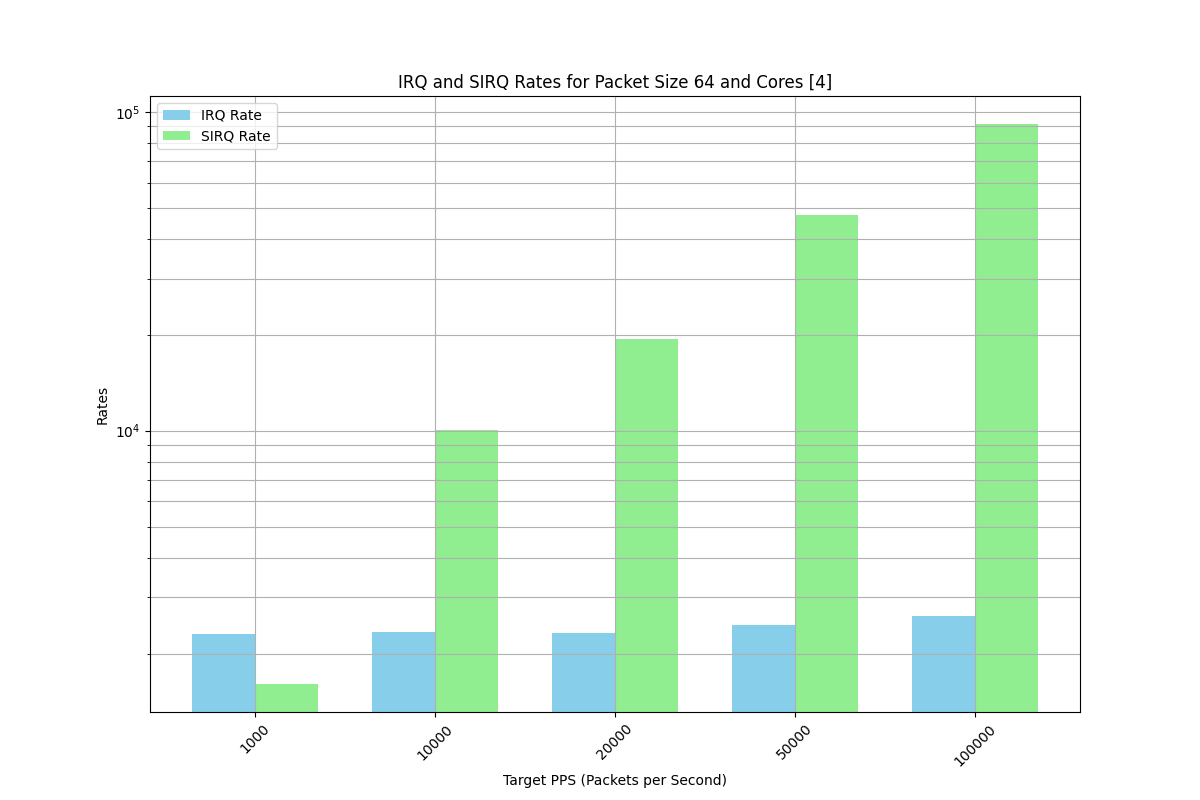
This repo hosts a set of inference tools and bash scripts and inference scripts that I use to benchmark the Linux IP stack and in Kubernetes environment, and maily focus for CNI performance. The scripts are designed to automate packet generation, data collection and metrics from pods, worker node,
Please note script requires access to kubeconfig, and ssh access to a worker node.( by default it assume no password authentication).
Goals validate performance at different packet sizes and packet rates; identify potential blocker and source of packet drops or any other bounds that can reduce performance.
Thus, script creates N traffic profiles for each POD during the initial phase. Later, each run consumes the generated profiles and pass to [https://github.com/netsniff-ng] trafgen each run can change core affinity, packet size, packet rate.
All data is collected into separate files and later passed to inference tools for offline inference,
a set of correlations and visualization.
- Python 3.9 or later
- kubectl
- Kubeconfig
- passwordless ssh access to worker nodes
- static cpu pinning in kubelet.
- worker node should have sudo access, so it can read /procfs and /sysfs
-
For custom pod image, scripts require following tools. numactl , ethtool, bash 3.2 or later, arping, ifconfig and trafgen.
-
For worker node all data collected via /procfs and /sysfs, and ethtool.
First, create pods by running create_pods.sh script. This script will create N server and N client pods. Then, run the generate_per_pod.sh script to generate the config for each pod. This script will be copied to each pod pkt_generate_template.sh
The pkt_generate_template.sh is then executed on each pod, producing a set of traffic profiles. Initially, the script resolves the default gateway IP address. It send a single ICMP packet transmission to populate the ARP cache and uses arping. The default gateway MAC address is utilized as the destination MAC address in the generated frame. Each pod receives a specific destination IP address, which create a one-to-one mapping thus test generate a unidirectional flow from TX to RX POD In other words, there is a pair of N TX-RX sets, where each server transmits traffic to its corresponding RX POD.
- By default, the script will create 3 TX and 3 RX pods.
- Each TX and RX pod will have 4 core and 4 GB memory.
- pkt_generate_template.sh will generate 4 profiles for 64, 128, 512, and 1024 byte frame sizes.
- by default during run 64 byte frame size is used and single core per pod.
-
create_pods.sh - create pod and executed from compute that has access to kubeconfig.
-
generate_per_pod.sh - generate per pod config executed from compute that has access to kubeconfig.
-
run_monitor.sh - run monitor script executed from compute that has access to kubeconfig.
-
inference.py - inference script executed from compute that has access to kubeconfig.
-
pkt_generate_template.sh - executed inside each pod ( called by generate_per_pod.sh)
-
monitor_queue_rate.sh - executed inside each worker node ( i.e. script pushed to each worker node)
-
monitor_txrx_int.sh - executed inside each worker node ( i.e. script pushed to each worker node)
-
pkt_generate_template.sh - uploaded to each POD
-
monitor_pps.sh - uploaded to each POD
-
monitor_queue_rate.sh - pushed to each worker node
-
monitor_txrx_int.sh - pushed to each worker node
- pkt_generate_template create all udp flow template, it needs access to src mac/dst mac, arp cache to generate right templates.
- monitor_pps - monitor script that will collect data from each pod, so we have viewed on TX / RX , interrupts , IRQ etc.
- monitor_queue_rate - identify TX or RX queue load in balance.
- monitor_txrx_int - identify TX / RX interrupts load and separation and balance.
cd src
cp your_kubeconfig .
create_pods.sh
generate_per_pod.sh
By default, kubeconfig should be in same spot where all scripts.
- generate_per_pod.sh will create 6 pod (default) 3 TX / 3 RX pod.
- generate_per_pod.sh will create set of profile in tmp dir for 64/128/512/1024 frame size test.
- serverX is sender, clientX is receiver and it 1:1 pair.
4 pair of server-client will be created.
create_pods.sh -n 42 pair 2 core per pod 2 GB memory per pod
create_pods.sh -n 4 -c 2 -m 2Check output
src/pod-client-template.yaml - template for client pods src/pod-server-template.yaml - template for server pods src/pod-client-template-same_node.yaml - template for same worker node (Later one in case of bare metal OCP like on single node)
If you run for different cores
 pip install numpy
 pip install matplotlib
# create_pods.sh
#generate_per_pod.sh
./inferece.pyDefault setting will use 1 core, 64 byte frame size profile and 3 pair. '-m' will tell script to output to stdout and sample every 1 sec metrics.
./run_monitor_ssh.sh -p 1000 -mTwo core per pod default 3 pair.
./run_monitor_ssh.sh -p 1000 -m -c 24 core per pod 4 pair in monitor mode
./run_monitor_ssh.sh -p 1000 -m -c 2 -n 44 core per pod 4 pair in collector mode. ( without -m script will collect on TX and RX pods and write separate files)
./run_monitor_ssh.sh -p 1000 -c 2 -n 4Generate per pod will output C struct, so you can check that dst mac IP set per pod. This phase need to be done only once during pod creation.
During initial pod creation create pod read pod spec from template and replace value that need to be replaced per pod. Hence, So if you need adjust anything adjust template first.
Default mode example for 1000 pps/sec. -m enable monitor mode. By default run will use single core. i.e we select from numa topology let say we have 4 core 0, 1, 2, 3 script will pick 2. It will never use 0, 1 in case we have something heavy running on the pod.
Note this is relevant in case we don't have static pining in kubelet. (i.e if you do static pining 0,1 will not allocate anyway)
run_monitor_pps.sh -p 1000 -m
Starting traffic generator with 1000 pps for 120 seconds on cores 4
Starting on pod server0-ve-56377f29-e603-11ee-a122-179ee4765847 core 4 with 1000 pps for 120 sec
Starting monitor pod server0-ve-56377f29-e603-11ee-a122-179ee4765847 core 4 with 120 sec.
TX eth0: 7 pkts/s RX eth0: 2000 pkts/s TX DROP: 0 pkts/s RX DROP: 0 pkts/s IRQ Rate: 1590, SIRQ Rate: 1912 NET_TX_RATE: 0, NET_RX_RATE: 1008 AVG_SIZE: 88
TX eth0: 1 pkts/s RX eth0: 1000 pkts/s TX DROP: 0 pkts/s RX DROP: 0 pkts/s IRQ Rate: 2764, SIRQ Rate: 1711 NET_TX_RATE: 0, NET_RX_RATE: 1032 AVG_SIZE: 88
TX eth0: 1 pkts/s RX eth0: 1000 pkts/s TX DROP: 0 pkts/s RX DROP: 0 pkts/s IRQ Rate: 1823, SIRQ Rate: 1449 NET_TX_RATE: 0, NET_RX_RATE: 1002 AVG_SIZE: 88
TX eth0: 1 pkts/s RX eth0: 1000 pkts/s TX DROP: 0 pkts/s RX DROP: 0 pkts/s IRQ Rate: 3723, SIRQ Rate: 1803 NET_TX_RATE: 0, NET_RX_RATE: 1017 AVG_SIZE: 88
TX eth0: 3 pkts/s RX eth0: 1002 pkts/s TX DROP: 0 pkts/s RX DROP: 0 pkts/s IRQ Rate: 2882, SIRQ Rate: 1545 NET_TX_RATE: 1, NET_RX_RATE: 775 AVG_SIZE: 57
TX eth0: 1 pkts/s RX eth0: 1000 pkts/s TX DROP: 0 pkts/s RX DROP: 0 pkts/s IRQ Rate: 1694, SIRQ Rate: 1213 NET_TX_RATE: 0, NET_RX_RATE: 738 AVG_SIZE: 88
TX eth0: 1 pkts/s RX eth0: 1000 pkts/s TX DROP: 0 pkts/s RX DROP: 0 pkts/s IRQ Rate: 1369, SIRQ Rate: 1094 NET_TX_RATE: 0, NET_RX_RATE: 741 AVG_SIZE: 88
TX eth0: 1 pkts/s RX eth0: 1000 pkts/s TX DROP: 0 pkts/s RX DROP: 0 pkts/s IRQ Rate: 1548, SIRQ Rate: 1133 NET_TX_RATE: 0, NET_RX_RATE: 740 AVG_SIZE: 88
TX eth0: 1 pkts/s RX eth0: 1000 pkts/s TX DROP: 0 pkts/s RX DROP: 0 pkts/s IRQ Rate: 3191, SIRQ Rate: 1500 NET_TX_RATE: 0, NET_RX_RATE: 741 AVG_SIZE: 88
TX eth0: 1 pkts/s RX eth0: 1000 pkts/s TX DROP: 0 pkts/s RX DROP: 0 pkts/s IRQ Rate: 1482, SIRQ Rate: 1461 NET_TX_RATE: 1, NET_RX_RATE: 1045 AVG_SIZE: 88
TX eth0: 1 pkts/s RX eth0: 1000 pkts/s TX DROP: 0 pkts/s RX DROP: 0 pkts/s IRQ Rate: 1425, SIRQ Rate: 1103 NET_TX_RATE: 0, NET_RX_RATE: 742 AVG_SIZE: 88
TX eth0: 1 pkts/s RX eth0: 1000 pkts/s TX DROP: 0 pkts/s RX DROP: 0 pkts/s IRQ Rate: 2121, SIRQ Rate: 1200 NET_TX_RATE: 0, NET_RX_RATE: 744 AVG_SIZE: 88
TX eth0: 1 pkts/s RX eth0: 1000 pkts/s TX DROP: 0 pkts/s RX DROP: 0 pkts/s IRQ Rate: 3422, SIRQ Rate: 1812 NET_TX_RATE: 0, NET_RX_RATE: 1011 AVG_SIZE: 88During collection mode, we schedule the operation to monitor N pairs of server and client pods while simultaneously initiating traffic generation. Throughout this process, we gather logs from both the server and client pods. The data is preprocessed for efficient loading into numpy, optimized to function as a vector of observations.
Concurrently, we collect the rate of observations on each Transmission (TX) and Reception (RX) queue, monitoring their status per queue. Additionally, gather interrupt rates per TX and RX queue per CPU.
All these logs are generated under the "metrics" directory.
Example
In collect mode for 2 pair client_client0-ve-56377f29-e603-11ee-a122-179ee4765847_1000pps_120_core_6_size_64_20240406043813.txt client_client1-ve-56377f29-e603-11ee-a122-179ee4765847_1000pps_120_core_6_size_64_20240406043813.txt
server_server0-ve-56377f29-e603-11ee-a122-179ee4765847_1000pps_120_core_6_size_64_20240406043813.txt server_server1-ve-56377f29-e603-11ee-a122-179ee4765847_1000pps_120_core_6_size_64_20240406043813.txt
Stats for each queue in TX and RX pod are in logs
queue_rate_rx_1000pps_1cores_3pairs_64pkt_20240406043811.log queue_rate_tx_1000pps_1cores_3pairs_64pkt_20240406043811.log
The data in log describe first 8 columns are for TX and next 8 columns are for RX pod.
1 1 0 6 2 5 8 7 1 1 0 6 2 5 8 7
1 1 0 2 0 20 21 19 1 1 0 2 0 20 21 19
Interrupt rate collected per TX and RX queue in logs tx_rx_int_rx Note this log collect from TX pod and RX pod.
tx_rx_int_rx_1000pps_1cores_3pairs_64pkt_20240406043811.log tx_rx_int_tx_1000pps_1cores_3pairs_64pkt_20240406043811.log
Example each chunk 8 is for 8 queues, index position is CPU.
0 0 0 0 0 0 0 0 0 0 0 0 0 0 0 0 0 197 0 0 0 1309369 0 0 0 0 0 0 0 51114 0 0 0 0 0 0 0 0 0 0 0 0 578 0 0 0 0 0 0 0 0 0 0 0 0 0 0 39281 0 0 0 0 0 0 0 0 0 201 0 0 0 0 0 0 0 0 0 0 0 0 0 0 0 0 0 0 0 0 0 0 186174 0 210 0 0 0 0 0 0 0 0 0 0 0 0 0 0 0 0 0 2553460 0 0 0 0 0 0 680 0 0 0 0 0 0 0 0 0 58694 0 0 0 0 0 0 0 0 0 0 0 0 0 0 238 0 0 0 0 74120 0 0 0 0 0 0 0 0 0 0 0 0 0 0 0 0 0 0 0 229 0 0 0 0 157 0 0 0 0 0 0 0 0 0 0 0 207300 0 0 0 0 0 0 0
in case we want monitor or collect run ./run_monitor_ssh script.
This script will run trafgen between two target POD. ( by default it use server0 and serve1) (we want to validate POD to POD communication on same worker node.)
This script takes -p as mandatory argument, it is pps rate in second -p 1000 1000 pps per sec.
same script launch trafgen and collect data on sender and receiver pod.
During data generation if we run in monitor mode it will only show data collected on receiver.
It does so by executing monitor_pps.sh on receiver pod.
-
In collection mode it will run same monitor_pps.sh on sender and receiver pod and serialize metric as cvs value per sample time.
-
All data read from sysfs and collected to separate file.
Assume we want use default core ( single core per trafgen)
./run_monitor_ssh.sh -p 1000
./run_monitor_ssh.sh -p 10000
./run_monitor_ssh.sh -p 100000
./run_monitor_ssh.sh -p 1000000
During a run, in collection mode, data is gathered from each transmit (TX) and receive (RX) pod, as well as from each worker node. This includes data samples from TX and RX queues, interrupts per queue on both TX and RX pods, and core usage. All the data is formatted into a single vector, which is then loaded into a NumPy array
Note we have logs from POD and Worker node.
  rx_1000000pps_120_core_0_size_64_20240328122409.txt
  rx_100000pps_120_core_0_size_64_20240328120635.txt
  rx_10000pps_120_core_0_size_64_20240328120118.txt
  rx_1000pps_120_core_0-1_size_64_20240328112149.txt
  rx_1000pps_120_core_0_size_64_20240328115617.txt
Later we can run inference.py to read all this file and run cross correlation and visualization.


