- Jenkins OTEL plugin (by Cyrille Le Clerc) can be used with an OTEL collector to send APM data to Splunk Observability Cloud (formerly SignalFx) APM, and/or Splunk HEC (if desired)
- Quick linux install of Splunks OTEL collector:
    curl -sSL https://dl.signalfx.com/splunk-otel-collector.sh > /tmp/splunk-otel-collector.sh && \
    sudo sh /tmp/splunk-otel-collector.sh --realm $SPLUNK_REALM -- $SPLUNK_ACCESS_TOKEN
- Quick linux install of Splunks OTEL collector:
- NOTE: For traditional Build Logs it is possible to run an OTEL agent on the Jenkins instance and send build logs through OTEL as well
- NOTE: OTEL can be setup to send APM data to Splunk APM and/or Splunk HEC. Configurations for both options are included in this repo.
-
Config for Splunk Otel Variables (default location on install is
/etc/otel/collector/splunk-otel-collector.conf) -
Config for OTEL Agent (default location on install is
/etc/otel/collector/agent_config.yaml)- Pay special attention to the additional
environmentattribute / tag we're adding to each trace. SignalFX APM utilizes this attribute by defaultattributes: actions: - key: environment value: test action: insert - Also pay attention to the
transformprocessor andspanmetricsconnector settings which allows us to create time series metrics out of our APM data for detailed historical tracking of trends in individual spans/steps.processors: # Transform processor to enrich jenkins span data transform/jenkinstrace: trace_statements: - context: span statements: - set(attributes["jenkins.pipeline.step.name"], name) where attributes["jenkins.pipeline.step.name"] == nil - set(attributes["jenkins.pipeline.step.type"], name) where attributes["jenkins.pipeline.step.type"] == nilconnectors: # spanmetrics connector will pull span metrics out of our trace data with dimensions for pipeline id, step name, step type. # Any other dimensions (span tags) can also be added here to put those dimensions onto the spanmetrics spanmetrics/jenkins: histogram: explicit: buckets: [1ms, 10ms, 100ms] dimensions: - name: ci.pipeline.id default: None - name: jenkins.pipeline.step.name default: None - name: jenkins.pipeline.step.type default: None dimensions_cache_size: 1000 namespace: jenkins - Finally we use both of these in our service pipelines to process the trace data with
transform, output it through thespanmetricsconnector and send the created metrics to Splunk Observability.pipelines: traces: receivers: [otlp/jenkins] processors: - transform/jenkinstrace - memory_limiter - attributes - batch - resourcedetection metrics: receivers: [otlp, signalfx, spanmetrics/jenkins] processors: [memory_limiter, batch, resourcedetection] exporters: [signalfx]
- Pay special attention to the additional
OTEL collector is setup. I've installed the Jenkins OTEL plug using the Jenkins Plugin Manager. How do I configure the Jenkins OTEL plugin?
-
Add your OTEL Collector Instance's IP and the appropriate port to the
OTLP GRPC ENDPOINTfield in Manage Jenkins > Configure System.- Default port:
4317- Note: In this example we will use the default port for jenkins data specifically. If you are sending other otlp data to port
4317open another port for jenkins and change the port forotlp/jenkinsin the receiver config. - If needed verify open ports on the opentelemetry collector instance:
# sudo netstat -tulpn | grep LISTEN
tcp6    0   0 :::22         :::*        LISTEN   507/sshd
tcp6    0   0 :::9943       :::*        LISTEN   9768/otelcol
tcp6    0   0 :::8888       :::*        LISTEN   9768/otelcol
tcp6    0   0 :::9080       :::*        LISTEN   9768/otelcol
tcp6    0   0 :::14268      :::*        LISTEN   9768/otelcol
tcp6    0   0 :::4317       :::*        LISTEN   9768/otelcol
tcp6    0   0 :::55681      :::*        LISTEN   9768/otelcol
tcp6    0   0 :::9411       :::*        LISTEN   9768/otelcol
- Note: In this example we will use the default port for jenkins data specifically. If you are sending other otlp data to port
- Default port:
-
Settings in Jenkins OpenTelemetry Plugin
- OTLP GRPC Endpoint: http://instance.ip.goes.here:4317
- Authentication: Choose appropriate options for your tokens (or the No Authentication option if you must)
- Visualisation:
- Custom Observability Backend
- Name:
Splunk APM (SignalFX) - Trace visualisation URL template: https://app.us1.signalfx.com/#/apm/traces/${traceId}
- Name:
- Custom Observability Backend
-
Click the
Advanced...button to open up dialogs to set an APMService nameandService namespace
I've verified traces are going in to Splunk APM. Where should I see my Jenkins Instance in Splunk APM?
- Splunk APM will show your Jenkins instance as the same value you have input in The Jenkins OpenTelemetry Plugin setup's
Service nameandService namespacesettings - Each of the Pipelines running in the Jenkins instance will be treated as a Service Endpoint in Splunk APM
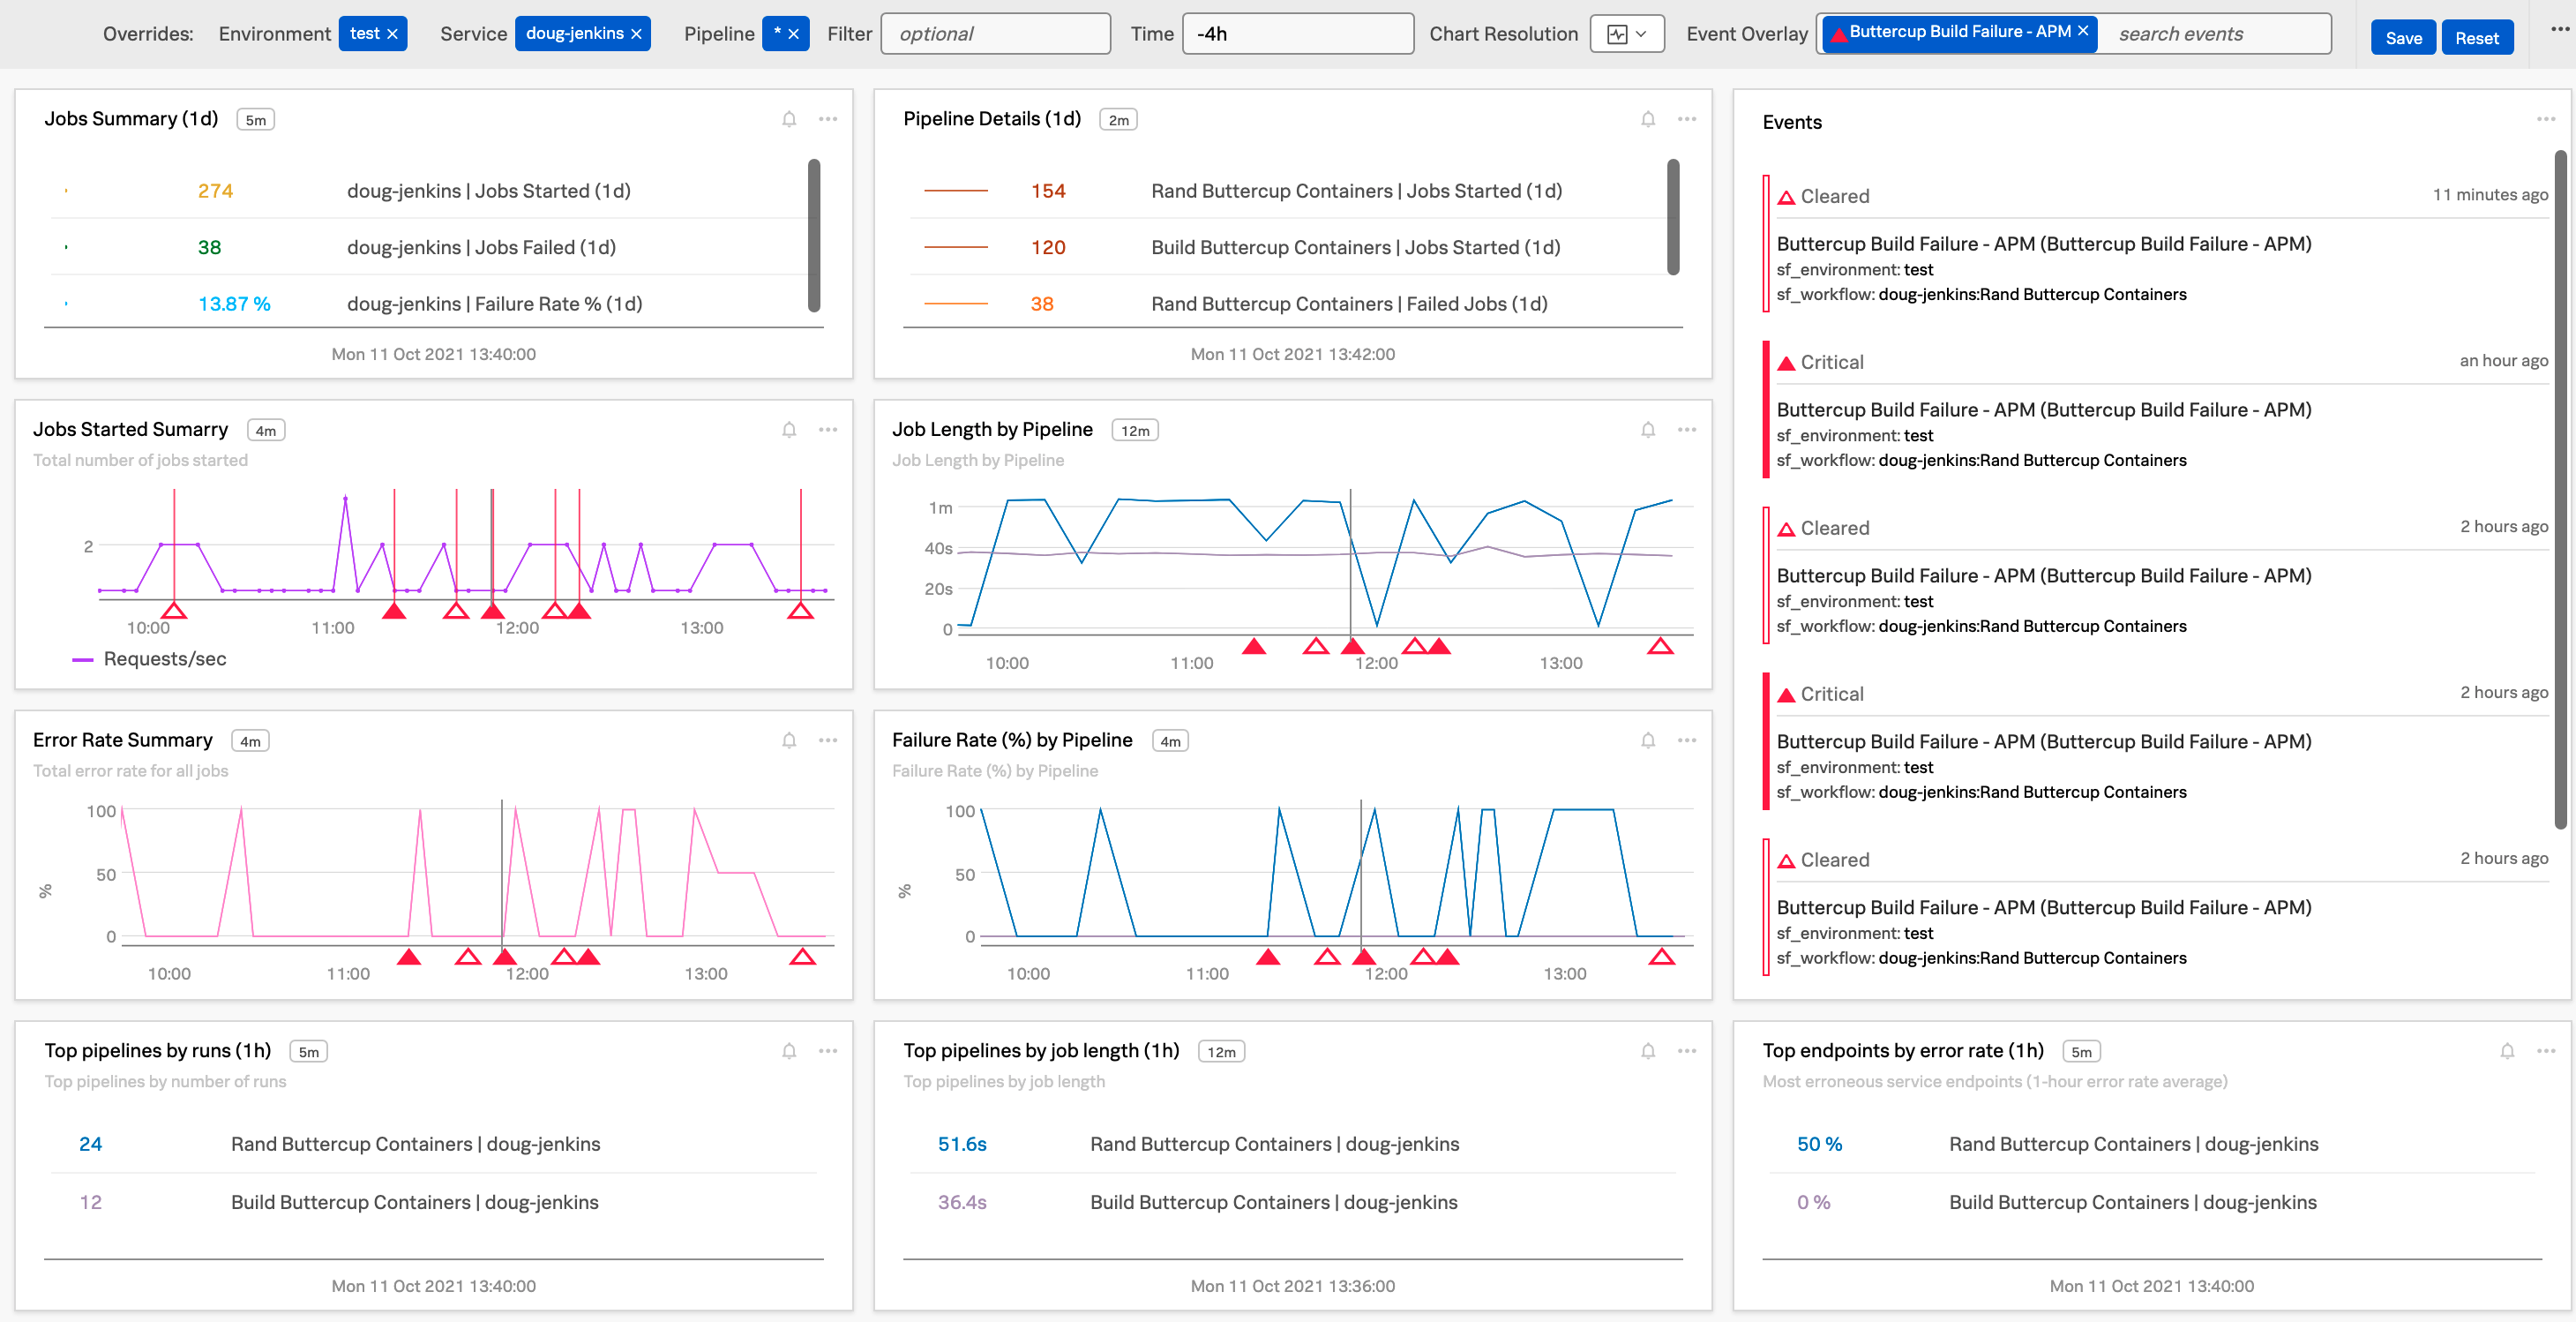
- Basic Jenkins dashboards are included in this repository as a starting point (both as JSON for import and Terraform files)
- Filter by your
environmentvariable - Filter by your Jenkins
Service Name - Filter by your Pipeline (or
*for all pipelines) - Edit Event Overlay to match detectors (I.E. Detector for build failures) and show markers on your dashboards
- Filter by your

Using OTEL connectors and processors to get a better overview of the Overall Jenkins Health and specific metrics around individual steps over time
To create time series metrics from your Jenkins APM data use the OTEL transform processor and spanmetrics connector to metricize the APM span data. This allows you to plot those values historically even if your Jenkins APM data has aged out of Splunk APM.
- Note: This requires enhancing your OTEL Collector config to send the Jenkins APM data through the
transformprocessor andspanmetricsconnector as detailed above

- Create a detector using the V2 detector url to leverage a SignalFlow query.
- Example SignalFlow for Service Name:
jenkins-serviceand Workflow (pipeline):Scheduled Buttercup Containers Buildin thetestenvironment:
AllReq = data('workflows.count', filter=filter('sf_workflow', 'jenkins-service:Scheduled Buttercup Containers Build') and filter('sf_environment', 'test') and (not filter('sf_dimensionalized', '*'))).sum(by=['sf_workflow']).publish(label='Success', enable=False) Error = data('workflows.count', filter=filter('sf_workflow', 'jenkins-service:Scheduled Buttercup Containers Build') and filter('sf_environment', 'test') and (not filter('sf_dimensionalized', '*')) and filter('sf_error', 'false')).sum(by=['sf_workflow']).publish(label='Error', enable=False) ErrRate = (100*(AllReq-Error)/AllReq).publish(label='ErrRate') from signalfx.detectors.apm.workflow_errors.static_v2 import static as workflow_errors_sudden_static_v2 workflow_errors_sudden_static_v2.detector(filter_=((filter('sf_workflow', 'jenkins-service:Scheduled Buttercup Containers Build'))) and (filter('sf_environment', 'test')), custom_filter=None, current_window='30m', fire_rate_threshold=0.1, clear_rate_threshold=0, attempt_threshold=1).publish('Buttercup Build Failure - APM')- Note: other dimensions such as
sf_service(I.E. Jenkins service name) andsf_operation(I.E. pipeline name) can also be used along with metrics likespans.countto create detectors
- Example SignalFlow for Service Name:
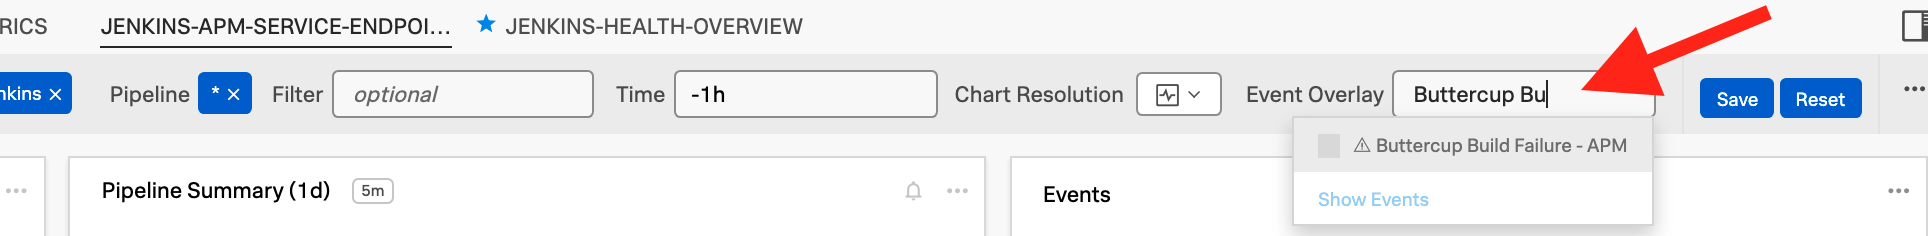
- Add your detector to the Event Overlay for your dashboards and charts!
- Dashboard Overlay Example:
- Single Chart Overlay Example:
- In your Chart click `Link Detector
- Type your Detector name into the box and select it

- Click the
Chart Optionstab and selectShow events as linesandShow data markers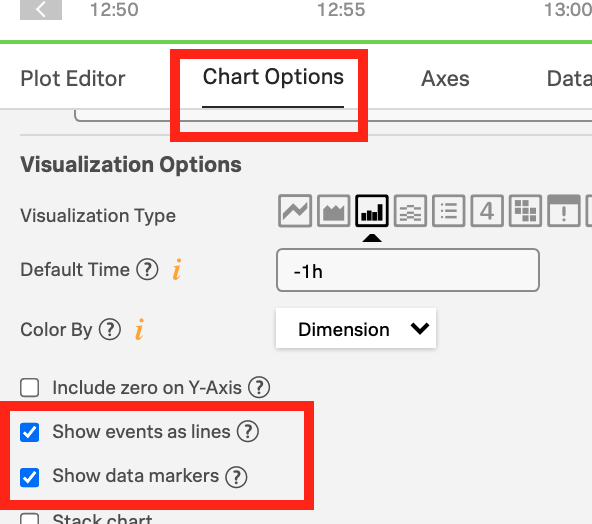
- Dashboard Overlay Example:


- PRO-TIP: Detectors can also be added for another team's deployments if the health of your own could be impacted by a failed deployment.