GHG Data is a dataset compiled out of national greenhouse gas (GHG) inventory submissions by Annex I Parties to UNFCCC. The primary purpose of this dataset is to simplify comparison and charting of GHG data on a single-variable level.
Data is available on Amazon S3, in JSON format, one file per inventory variable. The URL format is
http://ghg-data.s3-website.eu-central-1.amazonaws.com/VARIABLE-UID.json
The uid should be CAPITALIZED.
The response is JSON in the following format:
{"years":["list","of","years"],
 "series":{
  "<party-code>":["list","of","values"]}
}
Where:
"list","of","years"is a list of strings with year names (brows back down and see below in gotchas) sorted alphabeticallyparty-codeis a three-letter code of the Party. In most cases, but not always, this is an ISO ALPHA-3 code."list","of","values"is a list of record values sorted according to the years in"list","of","years"
This is outside of the scope of this README. The short answer is that all variables are defined in UNFCCC metadata available here. If you are a user of UNFCCC CRF Reporter, you may see variable UIDs when you export reporting tables with uids. If you are a user of Spherical's National Inventory System, you will find uids of variables on cell info boxes on all data entry and reporting views. If you are neither, making sense of variable uids is not easy. Ask Spherical, we will help.
"Life is really simple, but we insist on making it complicated" - Confucius
Years are not numbered but rather named. This is because Parties are free to name their reporting years the way they like, and Hungary used this freedom to name one of their years "1985-1987". In addition to that, there is a year that is used as baseline for calculating the Party's performance in GHG reduction. This year is named "Base Year". Most of the time, you will not be needing these years but you'll need to filter them out on your side.
Most country codes are ISO country codes. A UNFCCC-invented three-letter codes are used where an ISO country code is not available for a reporting entity. In particular:
- Sub-countries reporting separately:
- Belgium:
BRUis Brussels,WALis Wallonia,FLAis Flanders - UK:
GBEis UK excluding overseas territories that are not part of EU
- Belgium:
- Countries reporting under the Convention and under the Kyoto Protocol separately:
- Denmark:
DKEis for the 1st commitment period of the Kyoto Protocol,DNMis for the 2nd - France:
FRKis France's report under the Kyoto Protocol - UK:
GBKis UK's report under the Kyoto Protocol
- Denmark:
- Non-countries considered Parties to UNFCCC
- EU:
EUAis European Union,EUCis European Union's report under the Kyoto Protocol
- EU:
All numbers in the inventory are floating point numbers, with all floating number fun to be expected. In addition to that, some data may be a result of complex calculations in national or UN software that are not rounded properly to make sense. Do not be surprised to see a country reporting a quarter of a cow and handle it appropriately in your solutions.
According to the rules, complete GHG inventories shall not have empty records or zeroes. At the same time, there is a number of situations when a record does not contain a valid numeric value:
- The variable is non-numeric
- The Party could not report a number for some reason (the data point is zero, confidential, included in another variable or unavailable)
- The year is not applicable for the Party
In these cases the dataset will include null for the record. GHG management software usually treats most of such
records as zeroes.
The dataset is based on the latest 2017 GHG inventory submissions.
Sure!
- F05D8EF0-CD04-4769-81BE-303183271230 - Total direct national emissions in
kt CO2 equivalent - B3C6CE61-81BF-440C-A5EC-3451AB9205B8 - Total Methane emissions in
kt - 1D3FFBBD-28D5-4AD6-A543-9C6CC01B3F3B - Emissions from agriculture in
kt CO2 equivalent - A4543811-91B0-4DE7-B239-83F43DF6DF4E - Emissions from waste in
kt CO2 equivalent - A5A0958C-BDF7-43CA-BE3C-EB76B9A24348 - Number of sheep in the country :) in
thousands
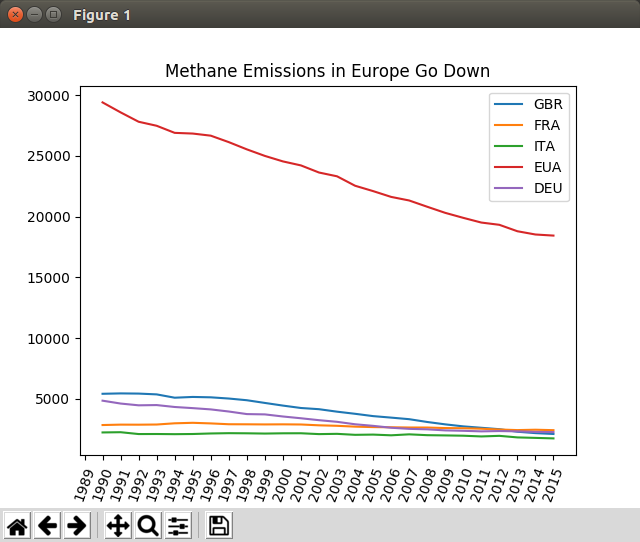
A simple matplotlib-based demo in chart.py shows the great progress of EU countries in reducing Methane emissions:
All data is produced by national governments and officially reported to the UN. Data is further dedicated to public domain by UNFCCC. This work, presented by Spherical, is a repackaging of public domain data which Spherical further dedicates to public domain. Important notes:
- Although data has not been modified, no warranty of any kind is provided as to its accuracy, authenticity or integrity. This is not an official source. If you require officially sourced data, you will need to source it from the respective national government or from UNFCCC directly.
- Continuous availability of data is not pledged. The service may be interrupted or discontinued without notice.
- Programming errors and irregularities in the original dataset may have led to errors in this data. No responsibility is assumed for such errors. If you believe that you have found an error, please let us know.
- We also reserve the right to change the API at any moment and without notice. Such changes will be made primarily to enrich data offered and therefore have backward compatibility. If you are using the dataset, you are advised to program your solutions in a way that they are tolerant to the expansion of the schema and changes to data volume.