Spack Stack Catalog

This is the spack stack community catalog, or spack.yaml files discovered in the wild across the community! It is inspired by the snakemake-workflow-catalog that is released under an MIT LICENSE.
⭐ View the Catalog ⭐
this repository is still under development!
Usage
Install Dependencies
The update of repositories that have spack.yaml is done during an automated CI, however you might want to run the update script locally. You can first install requirments:
python -m venv env
pip install -r requirements.txt
and spack should also be on your path.
which spackEnvironment
You'll need to export a personal access token as GITHUB_TOKEN:
export GITHUB_TOKEN=xxxxxxxxxxxRun update script
Then, run the script!
python scripts/generate-catalog.pyThis should be run nightly to update the stacks here.
Generate graph
The script generate-graph-data.py will parse the current set of spack.yaml files and count the number of times packages are installed with one another, not accounting for versions. We then create a similarity matrix based on the counts, and visualize that. More specifically:
- Make a matrix that counts "similarity" between packages. The similarity is based e.g., on the number of times packages that appear together. We don't need to worry about the diagonal (e.g., leave it as NaN).
- We need to normalize by packages that appear across a lot of packages. So we want to divide by the square root of the row sums and the columns sums. We do this so it's still symmetric, and we use a square root because we want the units to go away.
- Transform the counts to a distance e.g., using one of these functions. TLDR - we do distance = 1/ our normalized count matrix.
- Finally, use dimensionality reduction to find coordinates for each package. Packages that appear frequently together will be closer. E.g., isomap or TSNE.
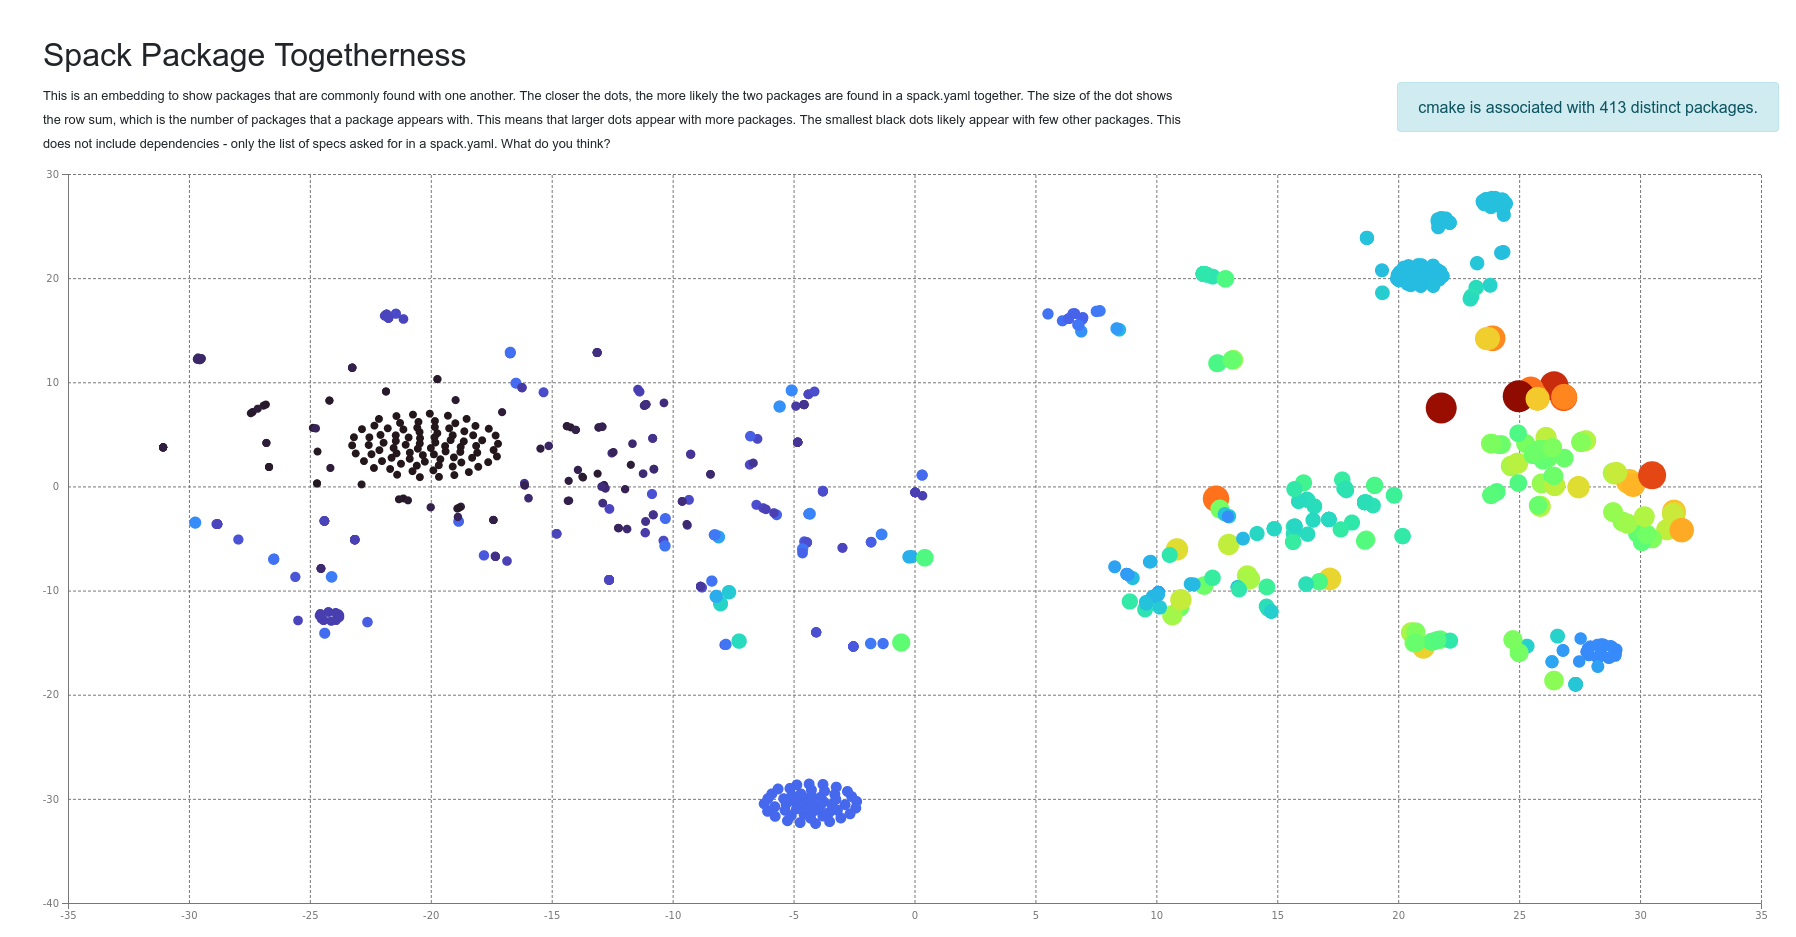
The embedding on the catalog shows packages that are commonly found with one another. The closer the dots, the more likely the two packages are found in a spack.yaml together. The size of the dot shows the number of distinct packages that a package appears with. This means that larger dots appear with more packages. The smallest black dots likely appear with few other packages. This does not include dependencies - only the list of specs asked for in a spack.yaml.
License
Spack is distributed under the terms of both the MIT license and the Apache License (Version 2.0). Users may choose either license, at their option.
All new contributions must be made under both the MIT and Apache-2.0 licenses.
See LICENSE-MIT, LICENSE-APACHE, COPYRIGHT, and NOTICE for details.
SPDX-License-Identifier: (Apache-2.0 OR MIT)
LLNL-CODE-811652