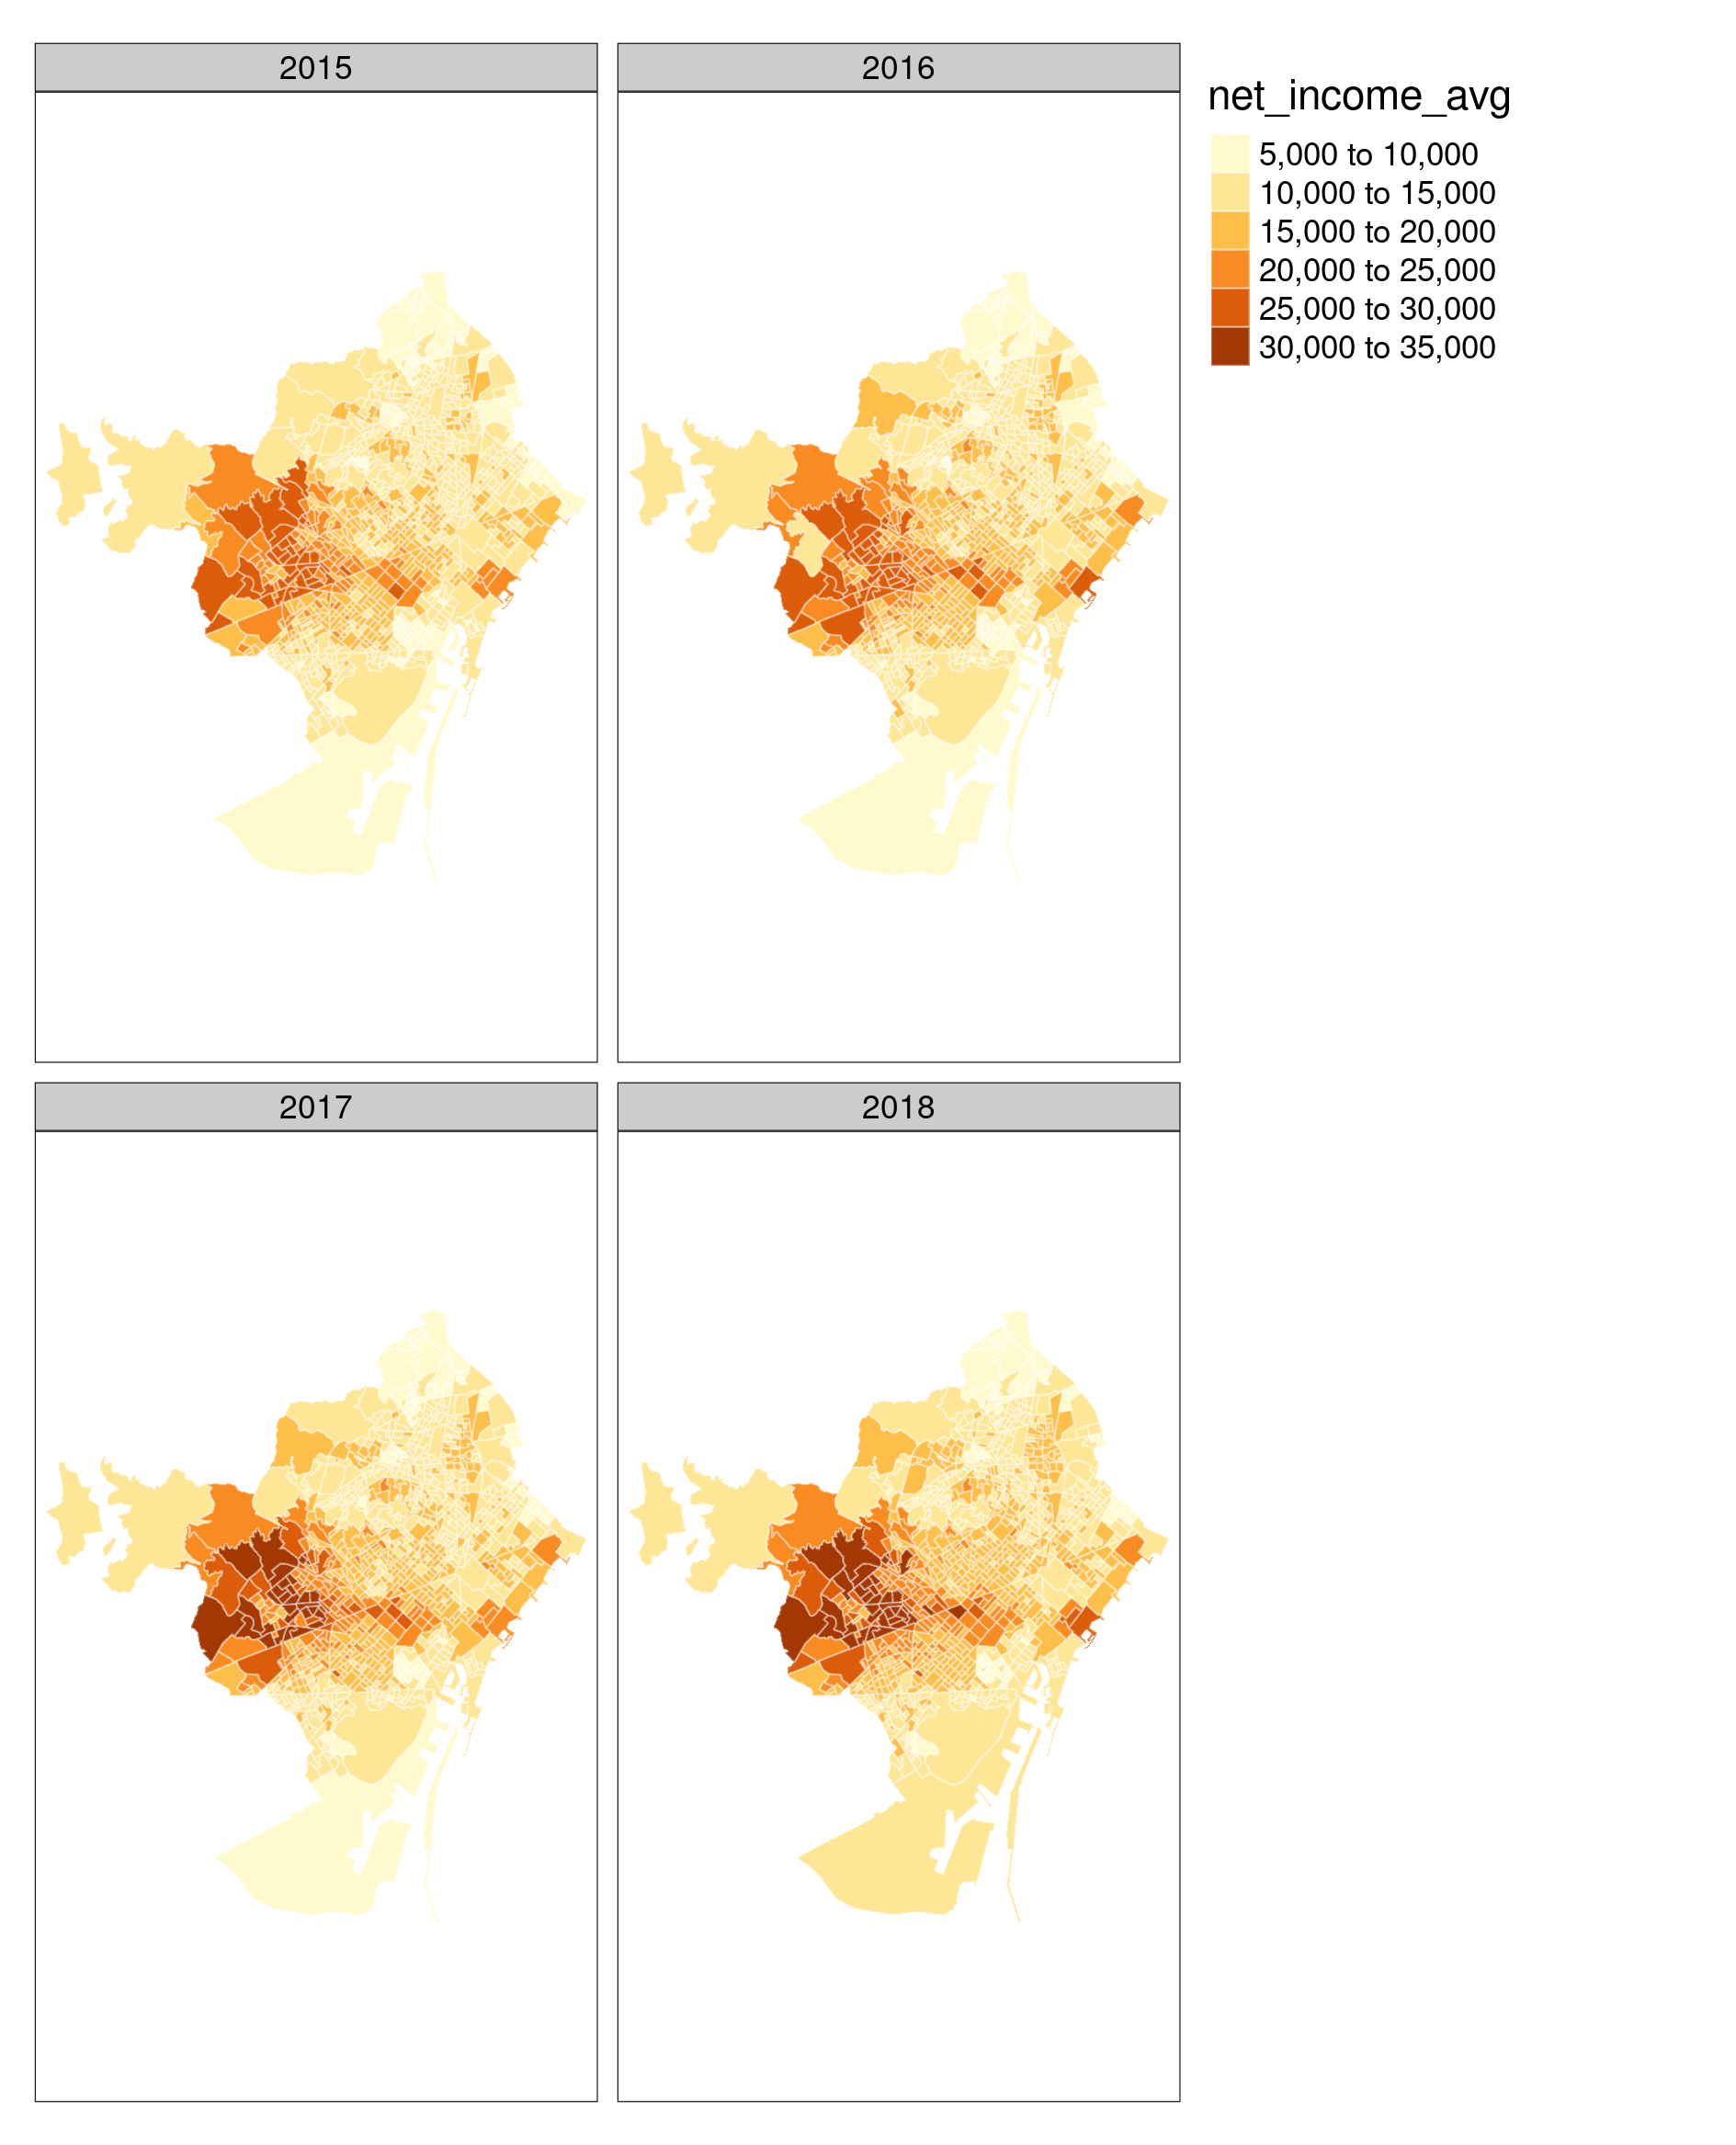
NOTE: The folder
data/is not tracked by git due to the file size limit of GitHub.
The original data is available at INE's website:
https://www.ine.es/experimental/atlas/exp_atlas_tab.htm
I downloaded the ZIP files for:
-
Indicadores de renta media y mediana
-
Índice de Gini y Distribución de la renta P80/P20
Each folder has several files with the data in different formats and shapes. I used the CSV called csv_bdsc.csv from each folder and named them, respectively:
I also downloaded the map of Spain by districts (2018) from INE's site:
I placed the corresponding SHAPE files in data/maps/ine/.
I use this map to subset the districts in Catalonia and link the SES indicators with the corresponding district polygons.
See ses-ine.R for details on the data cleaning and wrangling.
The processed data set is saved in different formats inside the data-processed/ folder:
| File | Description |
|---|---|
data-processed/ses_cat.csv |
SES indicators by section in Catalonia |
data-processed/ses_cat.rds |
tibble with SES indicators by section in Catalonia |
data-processed/ses_cat_sf.rds |
sf object with SES indicators by section in Catalonia |
The SES indicators reported in this data set are:
| Variable | Description | Units |
|---|---|---|
net_income_avg |
Average net income by person | Euros |
net_income_avg_household |
Average net income by household | Euros |
gini |
Gini Index | |
p80_p20 |
P80/P20 income distribution |
The maps are saved in the figs/ folder.
