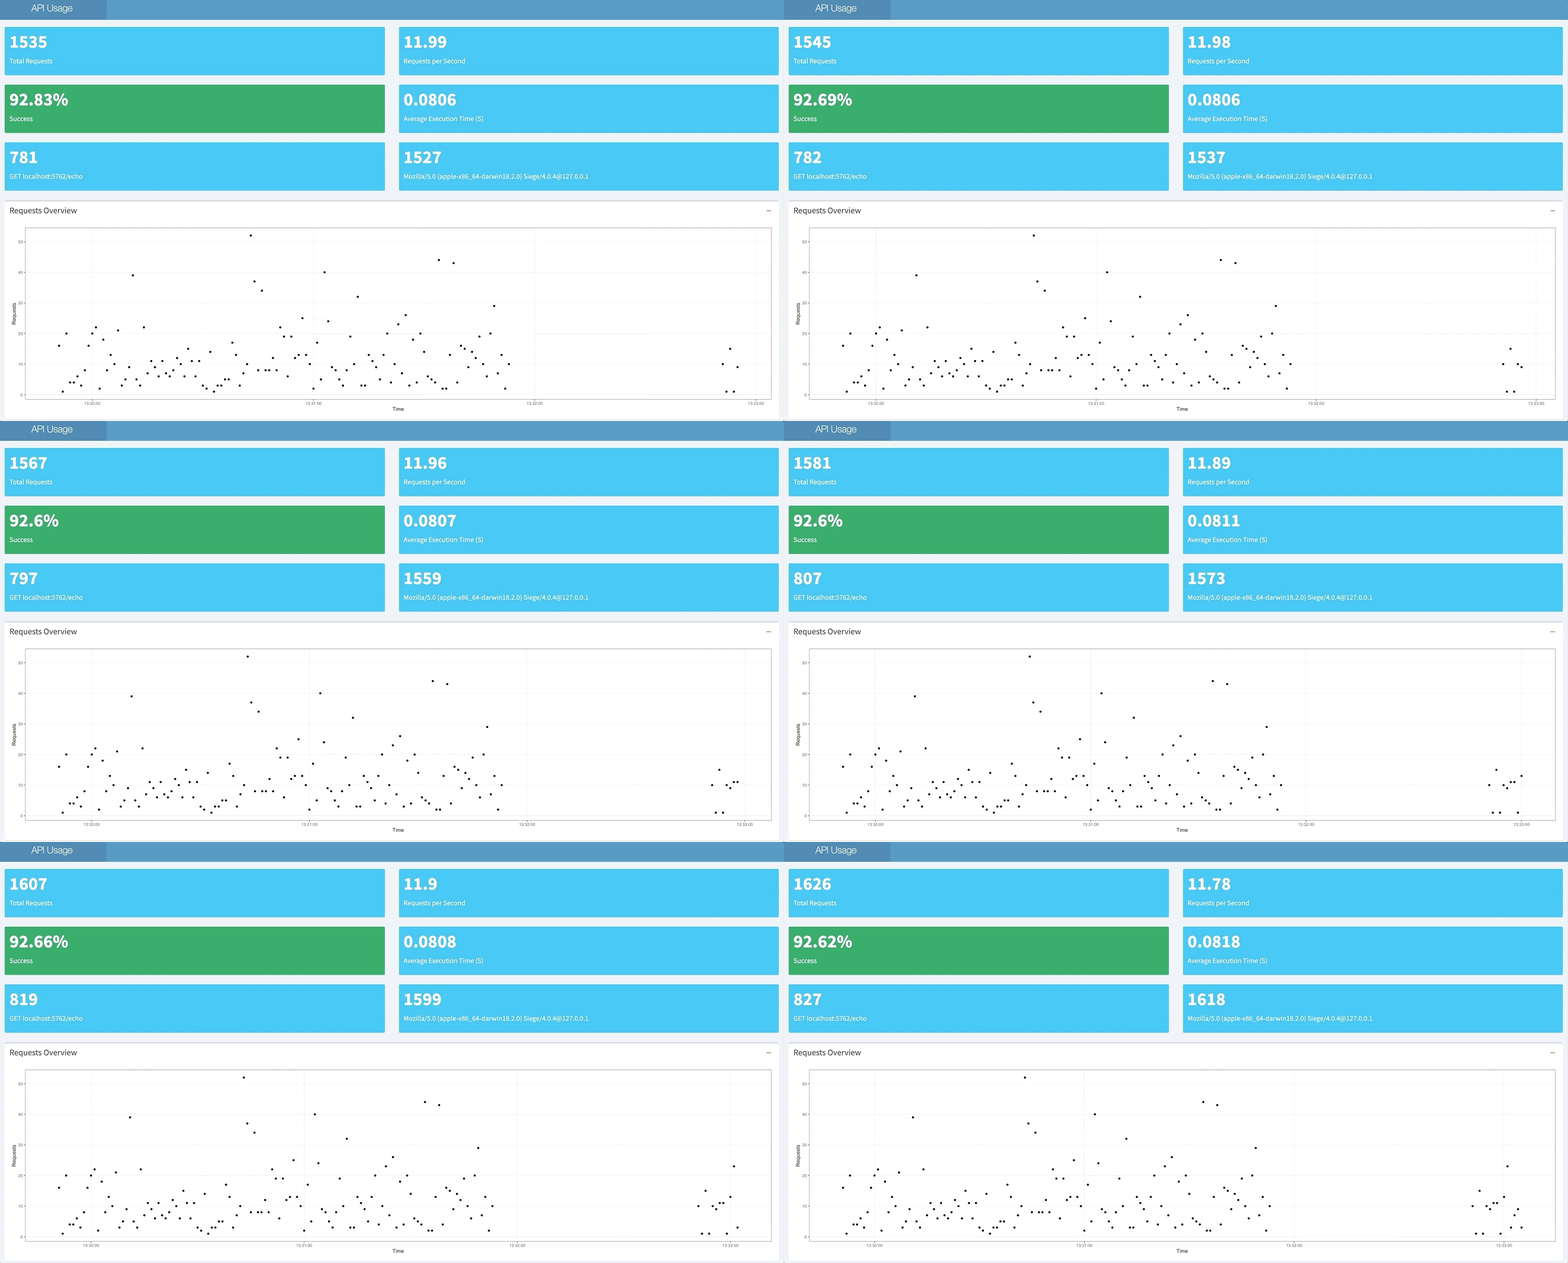
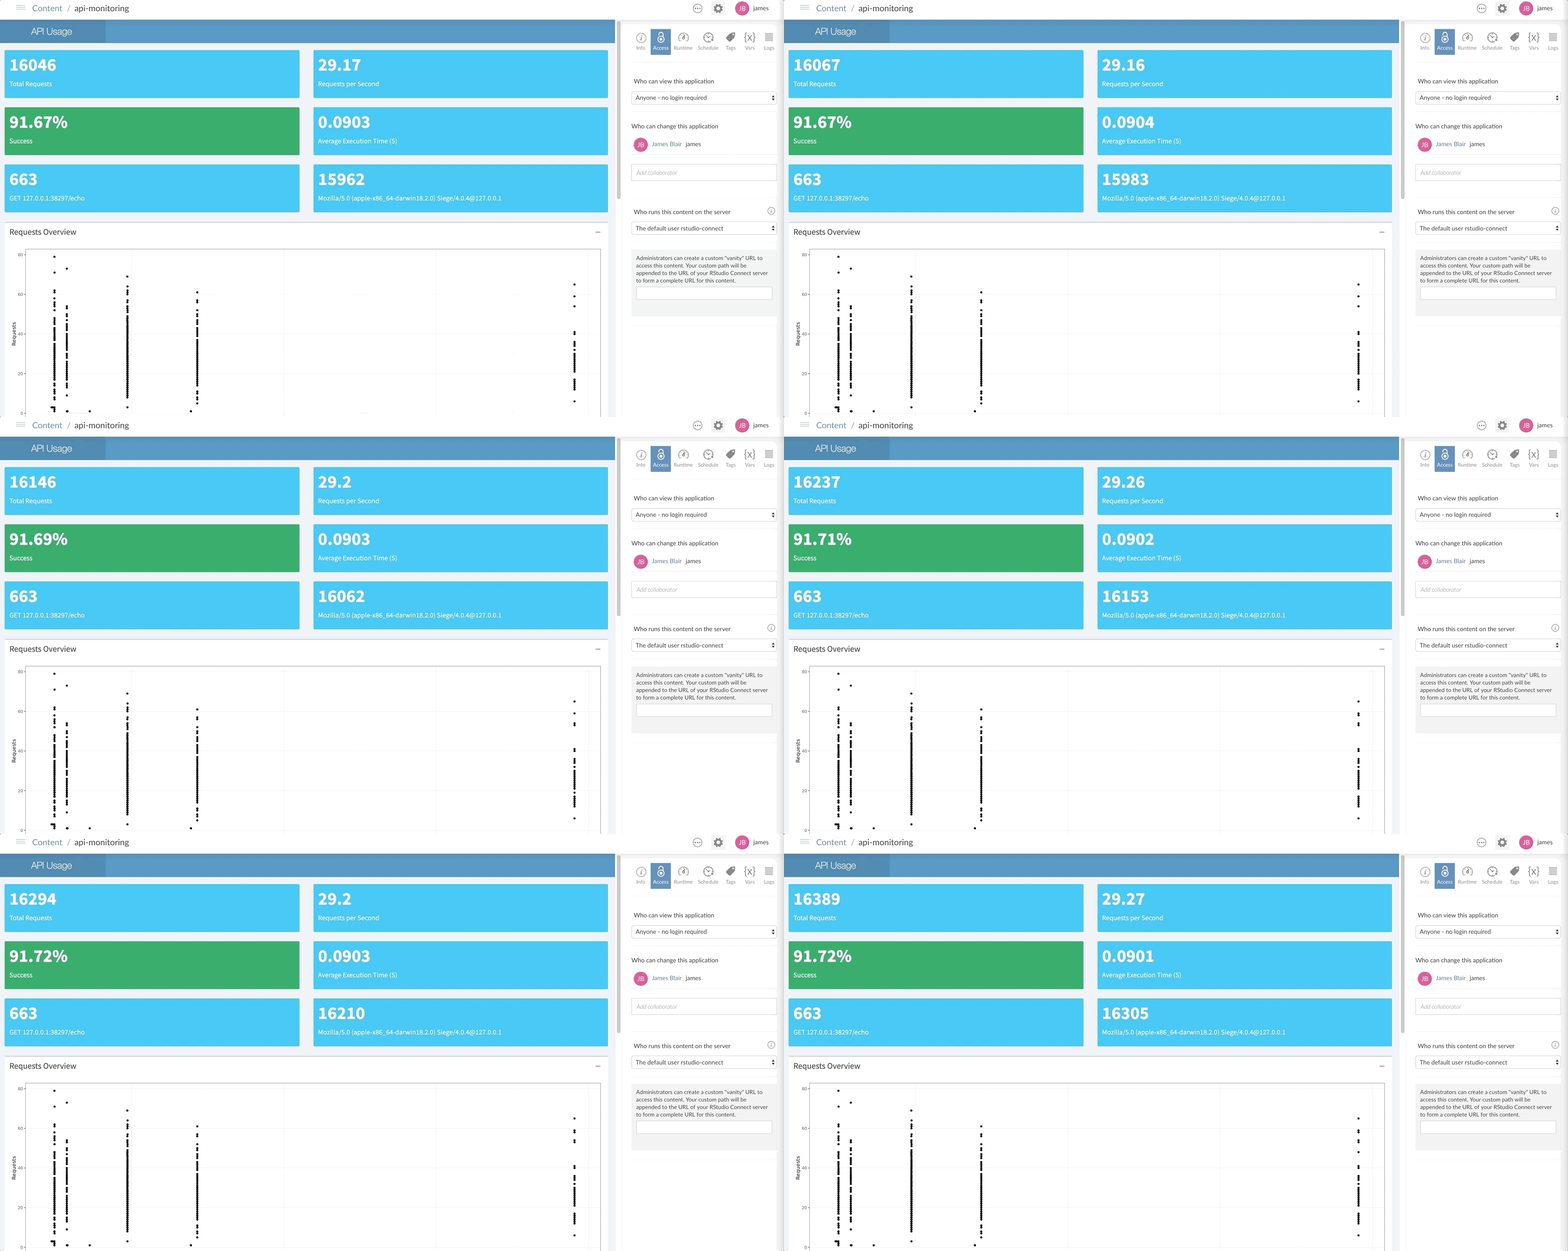
The Plumber R package is used to expose R processes and functions as API endpoints. Due to Plumber’s incredible flexibility, most major API design decisions are left up to the developer. One important consideration to be made when developing APIs is how to log information about API requests and responses. This information can be used to determine how Plumber APIs are performing and how they are being utilized. This repository contains an example of how logging can be implemented and monitored in a Plumber API.
The Plumber documentation contains an
example
of logging information about an incoming request as part of a
filter.
This approach works, but it doesn’t allow information about the response
to be logged since the response hasn’t been generated when the log entry
is written. The approach detailed in this repository uses preroute and
postroute
hooks
to log information about each API request and its associated response.
The logs are written using the
logger package for convenience.
entrypoint.R shows how preroute and postroute hooks
are used to generate a log entry:
library(plumber)

# Config
config <- config::get()

# logging
library(logger)
# Ensure glue is a specific dependency so it's avaible for logger
library(glue)

# Specify how logs are written
if (!fs::dir_exists(config$log_dir)) fs::dir_create(config$log_dir)
log_appender(appender_tee(tempfile("plumber_", config$log_dir, ".log")))

convert_empty <- function(string) {
  if (string == "") {
    "-"
  } else {
    string
  }
}

pr <- plumb("plumber.R")

pr$registerHooks(
  list(
    preroute = function() {
      # Start timer for log info
      tictoc::tic()
    },
    postroute = function(req, res) {
      end <- tictoc::toc(quiet = TRUE)
      # Log details about the request and the response
      # TODO: Sanitize log details - perhaps in convert_empty
      log_info('{convert_empty(req$REMOTE_ADDR)} "{convert_empty(req$HTTP_USER_AGENT)}" {convert_empty(req$HTTP_HOST)} {convert_empty(req$REQUEST_METHOD)} {convert_empty(req$PATH_INFO)} {convert_empty(res$status)} {round(end$toc - end$tic, digits = getOption("digits", 5))}')
    }
  )
)

pr
In this example, the tictoc package is used so that the log can include the execution time of the API. It’s important to note that this value does not represent the total amount of time a client waits for a response, since it doesn’t include any time that the request may have been queued before being processed. Instead, this value represents the amount of time the response took to generate once the request was received. Each log entry contains the following information:
- Log level: This is a distinction made by the logger package, and in this example the value is always INFO
- Timestamp: The timestamp for when the response was generated and sent back to the client
- Remote Address: The address of the client making the request
- User Agent: The user agent making the request
- Http Host: The host of the API
- Method: The HTTP method attached to the request
- Path: The specific API endpoint requested
- Status: The HTTP status of the response
- Execution Time: The amount of time from when the request received until the reponse was generated
This log format is loosely inspired by the NCSA Common log format. An example log file is provided below:
INFO [2019-07-27 10:34:28] 127.0.0.1 "Siege/4.0.4" localhost:9207 GET /echo 200 0.0380000000000003
INFO [2019-07-27 10:34:28] 127.0.0.1 "Siege/4.0.4" localhost:9207 GET /plot 200 0.0689999999999991
INFO [2019-07-27 10:34:28] 127.0.0.1 "Siege/4.0.4" localhost:9207 GET /echo 200 0.00100000000000122
INFO [2019-07-27 10:34:28] 127.0.0.1 "Siege/4.0.4" localhost:9207 GET /echo 200 0.00300000000000011
INFO [2019-07-27 10:34:29] 127.0.0.1 "Siege/4.0.4" localhost:9207 GET /echo 200 0.00199999999999889
Once the log files have been generated, they can be used to analyze API usage and performance. This repository contains an example Shiny application that monitors a specified directory for new log files or updates to existing log files. This application provides real time details about API usage and performance.
Plumber APIs can be
deployed in a variety of
ways. This logging solution can be adapted to work with any deployment
pattern, since you can specify where the log files are written using
logger::log_appender(). RStudio
Connect is a particularly attractive
deployment option since it drastocally simplifies the deployment process
and it supports Shiny applications, so the monitoring dashboard can be
deployed to RStudio Connect as well. The following steps can be used to
take advantage of this pattern on RStudio Connect:
- Publish the Plumber API with logging enabled
- Ensure that the log files are written to a persistent location with
proper permissions (for example,
/var/log/plumber)- If necessary, create a directory that with read/write access for
the
rstudio-connectgroup:
sudo mkdir /var/log/plumber && \
  sudo chown root:rstudio-connect /var/log/plumber && \
  sudo chmod 770 /var/log/plumber
- If necessary, create a directory that with read/write access for
the
- Make sure the Shiny dashboard is configured to monitor the location of the Plumber log files (the config R package is used in this example)
- Publish the Shiny dashboard to RStudio Connect


