Data ingestion and manipulation
if(!file.exists("flights.csv")) {
  download.file(
    "http://stat-computing.org/dataexpo/2009/2008.csv.bz2",
    "flights.csv.bz2")
  R.utils::bunzip2(
    "flights.csv.bz2",
    "flights.csv")
  unlink("flights.csv.bz2", force = TRUE)
}library(readr)
tr <- system.time(
flights_readr <- read_csv("flights.csv")
)
#> Parsed with column specification:
#> cols(
#> .default = col_double(),
#> UniqueCarrier = col_character(),
#> TailNum = col_character(),
#> Origin = col_character(),
#> Dest = col_character(),
#> CancellationCode = col_character()
#> )
#> See spec(...) for full column specifications.
tr[[3]]
#> [1] 21.748library(data.table)
tdt <- system.time(
flights_dt <- fread("flights.csv")
)
tdt[[3]]
#> [1] 3.717tva <- system.time(
flights_vroom_altrep <- vroom("flights.csv", altrep_opts = TRUE)
)
#> Observations: 7,009,728
#> Variables: 29
#> chr [ 5]: UniqueCarrier, TailNum, Origin, Dest, CancellationCode
#> dbl [24]: Year, Month, DayofMonth, DayOfWeek, DepTime, CRSDepTime, ArrTime, CRSArrTim...
#>
#> Call `spec()` for a copy-pastable column specification
#> Specify the column types with `col_types` to quiet this message
tva[[3]]
#> [1] 1.996library(tidyverse)
comparison <- tibble(
readr = tr[[3]],
`data.table` = tdt[[3]],
vroom = tva[[3]]
)
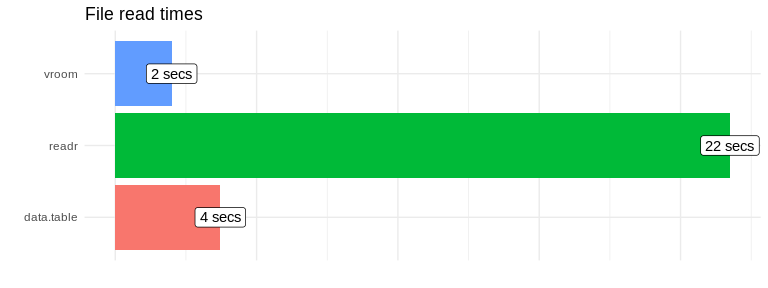
comparison
#> # A tibble: 1 x 3
#> readr data.table vroom
#> <dbl> <dbl> <dbl>
#> 1 21.7 3.72 2.00
comparison %>%
  gather() %>%
  ggplot(aes(key, value, fill = key)) +
  geom_col() +
  geom_label(aes(label = paste0(round(value), " secs")), fill = "white") +
  coord_flip() +
  labs(title = "File read times", x = "", y = "") +
  theme_minimal() +
  theme(legend.position = "none", axis.text.x = element_blank())
flights_readr %>%
    group_by(Month) %>%
    summarise(avg_delay = mean(ArrDelay, na.rm = TRUE))
#> # A tibble: 12 x 2
#>    Month avg_delay
#>    <dbl>     <dbl>
#>  1     1    10.2
#>  2     2    13.1
#>  3     3    11.2
#>  4     4     6.81
#>  5     5     5.98
#>  6     6    13.3
#>  7     7     9.98
#>  8     8     6.91
#>  9     9     0.698
#> 10    10     0.415
#> 11    11     2.02
#> 12 12 16.7mr <- system.time(
flights_readr %>%
group_by(Month) %>%
summarise(avg_delay = mean(ArrDelay, na.rm = TRUE))
)
mva <- system.time(
flights_vroom_altrep %>%
group_by(Month) %>%
summarise(avg_delay = mean(ArrDelay, na.rm = TRUE))
)
mdt <- system.time(
flights_dt[!is.na(ArrDelay), .(avg_delay = mean(ArrDelay)), Month]
)comp <- tibble(
readr = mr[[3]],
`data.table` = mdt[[3]],
vroom = mva[[3]]
)
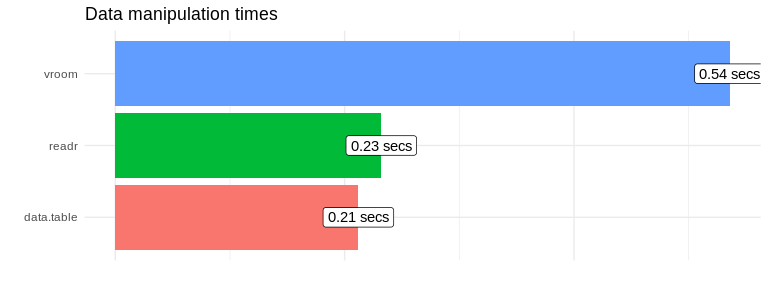
comp
#> # A tibble: 1 x 3
#> readr data.table vroom
#> <dbl> <dbl> <dbl>
#> 1 0.232 0.212 0.536
comp %>%
  gather() %>%
  ggplot(aes(key, value, fill = key)) +
  geom_col() +
  geom_label(aes(label = paste0(round(value, 2), " secs")), fill = "white") +
  coord_flip() +
  labs(title = "Data manipulation times", x = "", y = "") +
  theme_minimal() +
  theme(legend.position = "none", axis.text.x = element_blank())