

![]()
GWT Web toolkit doesn't have charting library available out of the box.
There are some open source charting libraries for GWT available to be used but with some constraints or unclear items:
- internet connection needed
- open source license not completely clear, sometimes with some obligations like to add specific labels
- old packages not longer maintained
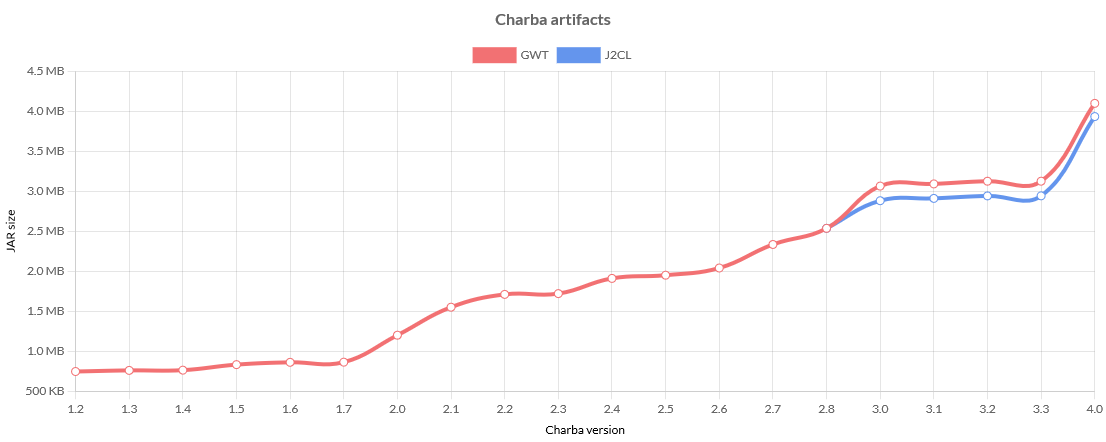
For all these reasons, Charba has been developed, leveraging on Chart.JS capabilities which are now available to GWT developers.
Even if Charba was born only as GWT chart library, since version 3, Charba has been changed in order to be used not only in GWT but also with other DOM frameworks, base on J2CL - JavaToClosure, like Google Elemental2 or Elemento.
Since version 3, Charba has got an own DOM tree manager which allows to it to be independent from any other DOM tree frameworks (i.e. GWT, Elemental2 or Elemento) but it is providing a set of hooks in order to use it also over those frameworks.

To build Charba, you can check out the project and to run Ant build.xml.
The Ant build.xml is able to build the 2 artifacts, related to the 2 distributions available.
The first distribution is a Charba file without any GWT dependency (but working on GWT anyway), consumable also in other J2CL - JavaToClosure frameworks, like Google Elemental2 and Elemento.
To build the project, execute buildBinary target.
It creates a charba-[version.release].jar file in dist folder, ready to be included in your project.
The second distribution is a Charba file with a hard GWT dependency which contains charts widgets and code splitting capabilities.
To build the project, execute buildBinaryGwt target.
It creates a charba-[version.release]-gwt.jar file in dist folder, ready to be included in your project.
Currently Charba is available on MVN repository.
It is available also on GitHub releases.
If you are using Apache Maven:
<dependency>
    <groupId>org.pepstock</groupId>
    <artifactId>charba</artifactId>
    <version>3.3</version>
    <!-- for GWT -->
    <version>3.3-gwt</version>
</dependency>
If you are using Apache Ivy:
<dependency org="org.pepstock" name="charba" rev="3.3"/>
<!-- for GWT -->
<dependency org="org.pepstock" name="charba" rev="3.3-gwt"/>
If you are using Gradle:
compile group: 'org.pepstock', name: 'charba', version: '3.3'

compile group: 'org.pepstock', name: 'charba', version: '3.3-gwt'
To install in your GWT project, both for GWT and for J2CL artifacts, you must the following configuration in your GWT project module configuration:
...
    <inherits name="org.pepstock.charba.Charba"/>
...
Charba version 1.x is based on JSNI method to integrate java script objects.
Since version 2.x, Charba is based on JSINTEROP method to integrate java script objects.
As the name suggests, JsInterop is a way of interoperating Java with JavaScript. It offers a better way of communication between the two using annotations instead of having to write java script in your classes (using JSNI).
PAY ATTENTION that if you are using a Charba version between 2.0 and 3.0 (included), GWT compiler (you are using for your project) requires -generateJsInteropExports to be passed.
If you are using Apache Maven:
<plugin>
  <groupId>org.codehaus.mojo</groupId>
  <artifactId>gwt-maven-plugin</artifactId>
  ...
  <configuration>
    <generateJsInteropExports>true</generateJsInteropExports>
  </configuration>
</plugin>
Since Charba version 3.1, this is NOT needed anymore.
All Charba documentation will be maintained in GitHub wiki of Charba project.
API JavaDoc is published here.
See Charba showcase on GWT to have a look what you can do with it.
See also Charba showcase GWT source code on GitHub as starting point, if you are going to use on GWT.
See Charba showcase built by J2CL and based on Google Elemental2, to have a look what you can do with it.
See also Charba showcase J2CL source code on GitHub as starting point, if you are going to use on J2CL.
The samples are going to reflect what CHART.JS samples are showing here.
Charba is continuously built at every commit and merge in master by GitHub Action.
At every build, Charba is also checked by Sonar.io in order to have the pulse of its quality.
In the project, it's also provided the FindBugs project to looking offline for bugs.
Here you can find the list of enhancements and updates available on master branch before which will be part of new official release:
- remove
ResourcesTypeandEntryPointStarterclasses as objects to initialize Charba.- There are 2 new entry points to initialize Charba:
Charba.enable()orCharba.enable(boolean)for embedded resourcesDeferredCharba.enable(Runnable)orCharba.enable(Runnable, boolean)for deferred resources
- There are 2 new entry points to initialize Charba:
- Drop Internet Explorer 11 support.
- remove
jsinterop-basedependency.
- import last CHART.JS version, version 3.2.1 on May 4th, 2021.
- import last CHART.JS LUXON adapter version, version v1.0.0 on April 6th, 2021.
- import last LUXON library version, version 1.26.0 on March 9th, 2021.
- import last CHART.JS Datalabels plugin version, version v2.0.0-beta.1 on March 12th, 2021.
- import last CHART.JS Annotation plugin version, version v1.0.1 on April 25th, 2021.
- import last CHART.JS Zoom plugin version, version v1.0.0-beta.5 on May 4th, 2021.
- change dependency for Google Closure Compiler, version v20210406 on April 16th, 2021.
- rename
defaultColorfromDefaultsglobal options tocolor. - remove
DefaultFontItemclass, useDefaultFont. - remove
generateLegendmethod fromDefaultsclass and fromIsChartclass because the prototype is not available anymore. - remove
updateScalemethod fromDefaultsbecause is not available anymore. UsegetScale(AxisType type)instead. - remove
isAnimatingmethod fromChartNodeclass. - remove
getBorderWidthmethod fromChartNodeclass. - remove
getOuterRadiusmethod fromChartNodeclass. - remove
getInnerRadiusmethod fromChartNodeclass. - remove
getRadiusLengthmethod fromChartNodeclass. - remove
getOffsetXmethod fromChartNodeclass. - remove
getOffsetYmethod fromChartNodeclass. - change
getLineWidthsandgetColumnWidthsmethods ofLegendNodeclass in order to return a list of doubles instead of a list of integers. - remove
fontSize,fontStyle,fontFamily,lineHeightand addcolorproperty (to set font color) to the following options classes, because newFontimplementation must be used:OptionsLegendLabelsTitleTooltips
- change the chart events constructor using
ChartEventContextwhich contains the chart and the native event. - remove
HORIZONTAL_BARitem ofChartTypeenumeration because the horizontal bar is not a chart type anymore. - rename
getDatasetMeta(int)method togetDatasetItem(int)in theIsChartinterface. - rename
getDatasets()method togetElements()in theDatasetItemclass. - rename
getMeta()method togetDatasetItem()in theDatasetPluginItemclass. - remove
render(UpdateConfiguration)method has been removed because it is not available anymore on CHART.JS. - rename
Rectangleoptions and configuration inBar, inside theElementsnode of the options and configuration. - change
filldefault option forLineelement fromFill.ORIGINtoFill.FALSE. - rename
showLinesproperty toshowLineproperty for line and radar chart options and configuration. - remove
xPaddingandyPaddingproperties fromTooltipsclass for options and configuration, usePaddinginstead. - change
xAlignandyAlignproperties inTooltipModelclass which are returning aTooltipAlignobject instead of a string. - change
fullWidthproperty tofullSizeinTitleandLegendclasses for options and configuration. - rename
LegendAlignclass toElementAlignin order to be able to use forTitleoptions and configuration classes. - change
cutoutPercentageproperty from double to string in order to manage a percentage[number]%format in the options and configuration classes, for pie and doughnut charts. - remove
Event.TOUCHENDitem - change
paddingproperty toTitleclass for options and configuration in order to usePaddingobject instead of an integer. - remove
AbstractChartsLifecycleListenerclass. UseChartsLifecycleListenerinterface where all methods has got the default now.
- add
backgroundColorandborderColordefault options. - add
VerticalLinechart, options and data set classes to manage this new kind of chart. - add
setDatasetVisibilitymethod toAbstractChartclass in order to set the visibility for a given data set. - add
toggleDataVisibilitymethod toAbstractChartclass in order to toggle the visibility of an item in all data sets. - add
isDataVisiblemethod toAbstractChartclass in order to get the stored visibility state of an data index for all data sets. - add
hidemethod toAbstractChartclass in order to hide a data set. - add
showmethod toAbstractChartclass in order to show a data set. - add
update(IsTransitionKey)andreconfigure(IsTransitionKey)methods toIsChartinterface in order to update the chart by an animation update mode. - add
resize(width height)method toIsChartinterface. - add
newDataset(boolean)methods for all charts (by newIsDatasetCreatorinterface) in order to get new data set with the initial visibility status. - add
usePointStyleproperty toTooltipsclass for options and configuration. - add
boxWidthandboxHeightproperties toTooltipsoptions and configuration classes. - add
xAlignandyAlignproperties toTooltipsoptions and configuration classes. - improve the tooltip callbacks management providing the right defaults.
- add
borderWidth,borderRadiusandborderDashproperties toTooltipLabelColoritem in order to improve the customization of tooltips by the callback. - add
titleproperty toLegendoptions and configuration classes in order to manage a title on legend - add
maxWidthandmaxHeightproperties toLegendoptions and configuration. - add
boxHeightproperty toLegendLabelsoptions and configuration classes. - add
textAlignproperty toLegendLabelsoptions and configuration classes. - add
fontColorproperty toLegendItemandLegendLabelItemclasses. - add
eventsproperty toLegendandTooltipsoptions and configuration classes in order to enable the event filtering. - add
alignproperty toTitleoptions and configuration classes. - add
hoverBackgroundColor,hoverBorderWidthandhoverBorderColorproperties toBar,Arc,LineandPointelements configuration and options classes. - add
pointStyleproperty toBarelement configuration and options classes. - add
enableBorderRadiusproperty toBarelement configuration and options classes. - add
hoverBorderRadiusproperty toBarelement configuration and options classes. - add
borderRadiusproperty toArcelement configuration and options classes. - add
hoverOffsetproperty toArcelement configuration and options classes. - add
Datasetsclass in order to manage data sets options and configuration classes. - add
Interactionclass in order to manage data sets options and configuration classes. - implement
decimationplugin options and configuration. - implement
fillerplugin options and configuration. - add
widthandheightoptions toChartAreaNodeclass - add
columnHeightsproperty toLegendNodeclass. - add
groupedproperty toDatasetsbar options and configuration. - implement new animation options and configuration for new engine:
- add new animation entities (collection of properties, transitions) and new name spaces where the options must be stored.
- add
delayproperty to animation options. - add
loopproperty to animation options. - add
animationoptions and configuration to data sets. - add
animationoptions and configuration to tooltips. - add
setAnimationEnabledandisAnimationEnabledmethods to animation containers to configuration, options and data sets. - enable
duration,delay,loopandeasingproperties as scriptable options inAnimationconfiguration.
- add
skipNullproperty toBarOptionsconfiguration. - change
circumferenceandrotationproperties onPieChartandDoughnutChartoptions in order to set the value in degrees instead of radians. - add
cutoutproperty in the options and configuration classes, for pie and doughnut charts. - add
radiusandradiusPercentageproperties in the options and configuration classes, for pie and doughnut charts. - add
resizeDelayproperty to options and configuration. - add
setXandsetYmethods toIsPaddinginterface as shortcut to set X (left, right) and Y (top, bottom) dimensions. - add
color,borderColor,backgroundColorandfontproperties to configuration of a single chart. - add
toBase64Image(ImageMimeType, double)methods (and all combinations) toIsChartinterface in order to get the image form chart in different image format and with different image quality. - enable
paddingproperty as scriptable inLayoutconfiguration. - add
segmentproperty toLineOptionsoptions and configuration in order to manage the rendering of line segments. - enable
align,display,color,font,padding,positionandtextproperties inTitleconfiguration to be set as scriptable options.
- remove
DEFAULT_X_AXIS_ID,DEFAULT_Y_AXIS_IDandDEFAULT_SINGLE_AXIS_IDconstants fromScalesclass, useDefaultScaleIdenumeration. - remove
getMinormethod fromIsDefaultTicksinterface and then fromDefaultTicksandDefaultChartTicksclasses. - rename
DefaultMajorTickItemclass toDefaultMajor. - remove
SingleScaleOptionsclass because the radial linear axis is managed like the cartesian ones. - rename
MultiScalesOptionsclass toScalesOptions. - remove
getAxismethod fromIsDefaultScaleinterface because the axis kind does not any default and, when not set, depends on scale id. - remove
setAxismethods fromScaleandAxisclasses because it must be set when an axis is built. - remove
getXAxesandsetXAxesmethods fromScalesclasses, usegetAxesandsetAxesmethods. - remove
getYAxesandsetYAxesmethods fromScalesclasses, usegetAxesandsetAxesmethods. - move
beginAtZeroproperty from ticks to axis/scale. - move
minproperty from ticks to axis/scale. - move
maxproperty from ticks to axis/scale. - move
reverseproperty from ticks to axis/scale. - move
suggestedMaxproperty from ticks to axis/scale. - move
suggestedMinproperty from ticks to axis/scale. - move
minproperty from time object to axis/scale. - move
maxproperty from time object to axis/scale. - move
labelsproperty from tick (cartesian category) object to axis/scale. - move
startAngleproperty fromPolarAreaOptionsclass toRadialAxis. - remove
getCartesianType()method fromCartesianAxisclass, usegetAxismethod. - rename
CartesianAxisTypeclass toAxisKindin order to manage axis type for radial linear and not only cartesian ones. - remove
fontSize,fontStyle,fontFamily,lineHeightand addcolorproperty (to set font color) to the following options classes, because newFontimplementation must be used:PointLabelsScaleLabelTicks
- remove the following classes because the ticks implementation is updated:
TickMinor,IsDefaultMinorTick,AbstractTick,IsDefaultBaseTick,DefaultTickItem,DefaultMinorTickItem,BaseTickMinorandBaseTick
- rename
TickMajoroption class toMajor. - rename
BaseTickMinorconfiguration class renamed toMajor. - remove
backdropPaddingYandbackdropPaddingXproperties fromTicksoptions andRadiaLinearTickconfiguration. UsebackdropPaddingproperty. - rename
Gridlinesclass toGridfor options and configuration in order to keep it aligned with CHART.JS name spaces. - remove
zeroLineWidth,zeroLineColor,zeroLineBorderDashandzeroLineBorderDashOffsetproperties fromGridoptions and configuration classes. - rename
tickMarkLengthproperty totickLengthinGridconfiguration and options classes. - rename
offsetGridlinesproperty tooffsetinGridclass for options and configuration. - remove
ScaleDistributionenumeration. Use new scaleCartesianTimeSeriesAxis, introduced in its place. - remove
TimeTickItemclass, useScaleTickItemclass. - add
getValueAsDate()method toScaleTickItemclass in order to get the tick value asDate. - rename
getValueAsDoublemethod ofScaleTickItemclass togetValue. - remove
getTimeTickItemsmethod fromScaleItemclass, usegetTickItems. - remove
MarginsItem,AxisMarginsItemandAxisMinSizeItemclasses because they are not visible in CHART.JS anymore. - change
onCallbackmethod signature ofTimeTickCallbackclass in order to get a list ofScaleTickIteminstead ofTimeTickItem. - change
onAfterBuildTicksmethod signature ofTimeAxisBuildTicksCallbackclass in order to get a list ofScaleTickIteminstead ofTimeTickItem. - remove the list of ticks as argument from
AxisBuildTicksCallbackclass. - change
isoWeekdayproperty ofTimeoptions and configuration class does not store abooleananymore but newIsoWeekDayenumeration with all days of week. - rename
ScaleLabelclass toScaleTitlein order to keep it aligned with CHART.JS name spaces. - rename
CartesianScaleLabelclass toCartesianScaleTitlein order to keep it aligned with CHART.JS name spaces. - rename
ScaleLabelAlignenumeration class toScaleTitleAlignin order to keep it align with CHART.JS names. - remove
ScaleLabelPaddingoptions, usePaddinginstead. - remove
CartesianPaddingoptions, usePaddinginstead. - rename
ScaleBoundsclass toBounds. - rename
labelStringproperty name totextinScaleTitleclass for options and configuration. - rename
RadialPointLabelCallbackinterface toPointLabelCallbackforRadialPointLabelsconfiguration. - add the index of the label to the signature of the
PointLabelCallbackinterface method.
- add axis id parameter to the cartesian axes classes constructor, by
IsScaleIdor a string. - add
getAxis(scaleId, axisKind)method fromIsDefaultScales interface in order to get the default scale and removegetXAxisandgetYAxismethods. - improve the defaults management for scales.
- change visibility of
CartesianAxisclass, now it is public. - add
CartesianTimeSeriesAxisclass in order to manage time series scales. - add
backgroundColorproperty toAxisconfiguration andScaleoptions classes. - add
alignToPixelsproperty toAxisconfiguration andScaleoptions classes. - add
singleStackedproperty toCartesianAxisconfiguration andScaleoptions classes. - add
labelsproperty toCartesianCategoryAxisclass. - add
minIndexandmaxIndexproperties toCartesianCategoryAxisclass in order to manage minimum and maximum by index of the label, instead of its content. - add
beginAtZeroproperty toCartesianLogarithmicAxisclass. - add
suggestedMinandsuggestedMaxproperties toCartesianLogarithmicAxisclass. - add
graceproperty to scale options and toCartesianLinearAxisclass. - add
animateproperty toRadialAxisconfiguration andScaleoptions classes. - add
alignproperty toScaleTitleoptions andCartesianScaleTitleconfiguration classes. - add
tickBorderDashproperty toGridconfiguration and options classes. - add
tickBorderDashOffsetproperty toGridconfiguration and options classes. - add
tickColorproperty toGridconfiguration and options classes. - add
tickWidthproperty toGridconfiguration and options classes. - add
borderColorandborderWidthproperties toGridoptions and configuration classes. - add
WidthCallbackinterface toGridandRadialAngleLinesconfiguration in order to setlineWidthproperty at runtime. - add
ColorCallbackinterface toGrid,RadialAngleLinesandRadialLinearTickconfiguration in order to setcolorandbackdropColorproperty at runtime. - add
BorderDashOffsetCallbackinterface toGridandRadialAngleLinesconfiguration in order to setborderDashOffsetproperty at runtime. - add
BorderDashCallbackinterface toRadialAngleLinesconfiguration in order to setborderDashproperty at runtime. - add
FontCallbackinterface toRadialPointLabelsandTickconfiguration in order to setfontproperty at runtime. - add
ShowLabelBackdropCallbackinterface toTickconfiguration in order to setshowLabelBackdropproperty at runtime. - add
countproperty toRadialLinearTick,CartesianLinearTickandTickconfiguration classes. - add
backdropPadding,backdropColorandshowLabelBackdropproperties toTickconfiguration, for all ticks. - add
SimplePaddingCallbackinterface toRadialPointLabelsconfiguration in order to setpaddingproperty at runtime. - add
formatproperty to all numeric ticks (cartesian linear and log, radial linear) in order to apply the number formatting by ECMAScript Internationalization API, leveraging on Charba INTL NumberFormat implementation. - add the
centeraxes position and the position of the axis with respect to a data value. - add
textStrokeColorandtextStrokeWidthproperties toTicksconfiguration and options classes. - add
alignandcrossAlignproperties to cartesian ticks. - add multiple text lines for
textproperty ofScaleTitleclass. - add
backdropColor,backdropPaddingandpaddingproperties toPointLabelsoptions andRadialPointLabelsconfiguration classes. - add the selected value of the scale by the click event to the
AxisClickEventclass. - add the following methods to
ScaleItemclass in order to improve the interaction with scale elements:getDecimalForPixelgetPixelForDecimalgetPixelForTickgetLabelForValuegetPixelForValuegetPixelForValuegetValueForPixelgetBaseValuegetBasePixel
- enable
precision,maxTicksLimitandstepSizescriptable options to linear ticks.
- rename
steppedLinefrom the dataset options tostepped. - rename
tensionfrom the dataset option tolineTension. - rename
SteppedLineenumeration toStepped. - rename
lineTensionproperty totensioninLiningDatasetclass. - change
getXAxisIDandgetXAxisIDmethods inLineDatasetclass in order to return aIsScaleIdinstance instead of aString. - change
getXAxisIDandgetXAxisIDmethods inBarDatasetclass in order to return aIsScaleIdinstance instead of aString. - add
BarBorderWidthCallbackinterface to use forborderWidthandhoverBorderWidthcallbacks inBarDatasetclass. - add
pointStyleproperty toBarDatasetclass. - add
borderRadiusproperty toPieDatasetandDoughnutDatasetclasses. - enable the feature to manage floating bars on
timeortimeseriesaxes and bar charts adding toDataPointclass the possibility to add aFloatingDataobject asYvalue. - remove
setT(Date)andDate getTmethods fromDataPointclass. UsesetX(Date)andDate getXAsDate()instead. - change
borderDashOffsetoption from int to double in all classes where referenced. - reduce visibility of
setHiddenmethod ofDatasetclass and add hidden argument toDatasetconstructor in order to set the initial visibility. To change the dataset visibility, use thesetDatasetVisibilitychart method.
- add
clipproperty to all datasets types. - add
spanGapsnumber property (double) toLiningDatasetclass in order to manage the value where there are some gaps. - add
setXAxisIDandsetYAxisIDmethods toLineDatasetclass in order to set the scale id usingIsScaleIdimplementation. - add
stackitem toFillenumeration. - add
indexAxisproperty toBarDatasetandBarOptionsclasses in order to manage the horizontal bars. - add
STARTandENDitems toBorderSkippedenumeration - change
borderSkippedproperty inBarDatasetclass in order to manage it as indexable options. - change
borderWidthproperty forBarDatasetin order to be set as indexable when set as an object. - add
borderRadiusandhoverBorderRadiusproperties toBarDatasetclass. - add
baseproperty toBarDatasetconfiguration and toDatasetsconfiguration and options classes. - add
enableBorderRadiusproperty toBarDatasetconfiguration class. - add
setXAxisIDandsetYAxisIDmethods toBarDatasetclass in order to set the scale id usingIsScaleIdimplementation. - add
offsetandhoverOffsetproperties toPieDatasetandDoughnutDatasetclasses. - change
borderAlignproperty forPieDataset,PolarAreaDatasetandDoughnutDatasetin order to be set as indexable. - enable overriding the legend
pointStyle(from dataset) using newpointStyleoption. - improve the gradients and patterns management at dataset level in order to be managed by a callback instead of by a plugin in order to have the right chart area size for gradients.
- add
groupedproperty toBarDatasetclass. - add
rotationandcircumferenceproperties toPieDatasetandDoughnutDatasetclasses.
- change the signatures of
Plugininterface in order to manage new arguments of functions. - remove
easingproperties fromDatasetPluginItemandTooltipPluginItemclasses because it is not provided anymore. - remove
easeargument fromonBeforeDraw,onAfterDraw,onBeforeDatasetsDraw,onAfterDatasetsDraw,onBeforeDatasetDrawandonBeforeDatasetDrawmethods ofPlugininterface because is not passed by CHART.JS anymore. - add the update mode to the
onAfterDatasetsUpdate,onAfterUpdate,onBeforeDatasetsUpdate, andonBeforeUpdatemethods ofPlugininterface. - remove
AbstractPluginCachedOptionsandAbstractPluginCachedOptionsFactoryclasses. Use instead callbacks cache. - change
AbstractPluginclass, removing all methods leaving onlygetId(because thePlugininterface has got all default methods) and new constructor where the plugin id is mandatory. - remove
setEnabledmethod forDefaultPluginIdenum fromPluginoptions class in order to avoid an inconsistent default options of plugin. UsesetDisplaymethod for legend and title in legend and title options, andsetEnabledmethod for tooltips in tooltips options. - change
getXAxisIDmethod inDatasetsItemsSelectorOptionsclass in order to return aIsScaleIdinstance instead of aString. - rename
ClearSelectionclass toSelectionCleanerin theDatasetsItemsSelectorplugin.- rename
clearSelectionmethods tocleanSelectionin theDatasetsItemsSelectorclass. - rename
getClearSelectionmethod togetSelectionCleanerin theDatasetsItemsSelectorOptionsclass. - rename
DatasetRangeClearSelectionEventclass toDatasetRangeCleanSelectionEvent. - rename
DatasetRangeCleanSelectionEventHandlerclass toDatasetRangeCleanSelectionEventHandler. - rename
onClearmethod toonCleaninDatasetRangeCleanSelectionEventHandlerclass.
- rename
- remove
CLEAR_SELECTIONconstant fromDatasetRangeSelectionEventclass because the event is containing the selected values and not the indexes anymore. - remove
fontColorproperty fromSelectionCleaneroptions, usecolorinstead. - remove
fontSise,fontStyleandfontFamilyproperties fromClearSelectionoptions, usefontobject instead. - change
LabelsPluginin order to :- add new
colorproperty for the font color, in order to be aligned with CHART.JS 3 implementation. - use
fontobject instead of the single properties. - change
FontColorCallbackin favor ofColorCallbackwhere you can decide the color. - add
FontColorCallbackin favor ofFontCallbackwhere you can decide the whole content of font. - pass a
LabelsContextobject instance as argument to all plugin callbacks instead ofRenderItemandFontColorItemones.
- add new
- remove
setOptions(List<T>),getOptionsAsListandgetOptionsTypemethods fromPluginsconfiguration and options classes. - change
DataLabelsPluginin order to :- move
Weightenumeration fromorg.pepstock.charba.client.datalabels.enumstoorg.pepstock.charba.client.enumsbecause newFontimplementation must be used. - remove
TextAlignenumeration fromorg.pepstock.charba.client.datalabels.enumsand useTextAligninorg.pepstock.charba.client.enumsinstead. org.pepstock.charba.client.datalabels.callbacks.ColorCallbackclass have been replaced byorg.pepstock.charba.client.callbacks.ColorCallbackclass to manage whatever scriptable option which manages colors.org.pepstock.charba.client.datalabels.callbacks.OffsetCallbackclass have been replaced byorg.pepstock.charba.client.callbacks.OffsetCallbackclass to manage whatever scriptable option which manages offsets.org.pepstock.charba.client.datalabels.callbacks.OffsetCallbackclass have been replaced byorg.pepstock.charba.client.callbacks.OffsetCallbackclass to manage whatever scriptable option which manages offsets.org.pepstock.charba.client.datalabels.callbacks.TextShadowColorCallbackclass have been replaced byorg.pepstock.charba.client.callbacks.ColorCallbackclass to manage whatever scriptable option which manages colors.org.pepstock.charba.client.datalabels.callbacks.TextStrokeColorCallbackclass have been replaced byorg.pepstock.charba.client.callbacks.ColorCallbackclass to manage whatever scriptable option which manages colors.org.pepstock.charba.client.datalabels.callbacks.TextStrokeWidthCallbackclass have been replaced byorg.pepstock.charba.client.callbacks.WidthCallbackclass to manage whatever scriptable option which manages line widths.org.pepstock.charba.client.datalabels.callbacks.PaddingCallbackclass have been replaced byorg.pepstock.charba.client.callbacks.PaddingCallbackclass to manage whatever scriptable option which padding.org.pepstock.charba.client.datalabels.callbacks.FontCallbackclass have been replaced byorg.pepstock.charba.client.callbacks.FontCallbackclass to manage whatever scriptable option which manages fonts.
- move
- rename
CompleteCallbackclass toCompletedCallback(and the name of the method fromonCompletetoonCompleted) in theZoomPlugin. - rename
getCompleteCallbackandsetCompletedCallbackmethods togetCompleteCallbackandsetCompleteCallbackin theZoomandPanoptions in theZoomPlugin. - change
ModeCallbackinterface method signature adding new argument, the configuration element of theZoomoptions. - remove
sensibilityproperty fromZoomconfiguration and options. - rename
enabledproperty todisplayinLineLabelconfiguration ofAnnotationPlugin. - move
AnnotationTypeenumeration fromorg.pepstock.charba.client.annotation.enumstoorg.pepstock.charba.client.annotationin order to maintain the low visibility of internal classes of the annotation plugin implementation. - rename
LineLablePositionclass toLablePositionforLineLabelconfiguration ofAnnotationPlugin. - add
adjustScaleRangeoptions to all annotations element.
- change all methods of
Plugininterface becoming all default ones. - add new hooks to
Plugininterface:onBeginDrawingandonEndDrawingin order to invoke the plugin once before starting and after ending any drawing.onBeforeElementsUpdateonResetin order to enable to catch when a chart is resetting.onInstall,onStart,onStop,onUninstallto manage plugin life-cycle.onBeforeDataLimits,onAfterDataLimits,onBeforeBuildTicks,onAfterBuildTicksto manage scale setup.
- add
eventsproperty toAbstractPluginOptionsoptions classes in order to enable the event filtering for plugin. - improve the code of
HtmlLegendplugin in order to manage texts (for legend items and title) in the same way. - manage new legend title in
HtmlLegendplugin.- add
HtmlLegendTitleCallbackcallback to apply a custom legend title in HTML. - rename
HtmlLegendTextCallbackcallback toHtmlLegendItemCallback.
- add
- improve
Annotationplugin in order to leverage on callbacks cache which enables the complete configuration also at default or chart type levels. - add new features to
AnnotationPluginplugin.- add
setXScaleIDandsetYScaleIDmethods toBoxAnnotationclass of Annotation plugin in order to set the scale id usingIsScaleIdimplementation. - add
setScaleIDmethod toLineAnnotationclass of Annotation plugin in order to set the scale id usingIsScaleIdimplementation. - implement only
click,dblclick,enterandleaveevents. - add
ellipseandpointannotation types. - add
displayproperty to all annotations in order to enable or disable the display of annotation. - remove
modeproperty from annotation line options because new plugin is using theaxisproperty of scales for line orientation. - remove
eventsproperty from annotation options because the event listeners will be added based on the callbacks definitions. - add
autoRotationproperty to annotation line label options in order to enable the automatic calculation of label rotation. - add
textAlignproperty to annotation line label options in order to enable horizontal alignment when context text is multiple lines. - remove
nameproperty from annotation options because is not needed anymore. Useidproperty instead. - change
getScaleIDmethod inLineAnnotationclass of Annotation plugin in order to return aIsScaleIdinstance instead of aString. - change
getXScaleIDandgetXScaleIDmethods inBoxAnnotationclass of Annotation plugin in order to return aIsScaleIdinstance instead of aString. - change the constructors of
LineAnnotationandBoxAnnotationin order to set an ID to the object. This will enable the possibility to define annotations items as default. - enable the callback definitions for all scriptable options in all annotations.
- add
drawTimeproperty toLineLabelconfiguration ofAnnotationPlugin.
- add
- add
enabledproperty toDatasetsItemsSelectorplugin in order to disable/enable the plugin at runtime. - add
setXAxisIDmethod toDatasetsItemsSelectorOptionsclass in order to set the scale id usingIsScaleIdimplementation. - add new
DatasetRangeClearSelectionEventevent forDatasetsItemsSelectorplugin in to order to notify when a clear action has been performed on chart.- remove
fireEventOnClearSelectionproperties has been removed from DatasetsItemsSelectorOptions class because an clear selection event will fire only if there is a event handler.
- remove
- improve the logic of
DatasetsItemsSelectorplugin in order to leverage on new capabilities of scale item to retrieve the selected data instead of the index. - improve
DataLabelsplugin in order to leverage on callbacks cache which enables the complete configuration also at default or chart type levels. - improve
DataLabelsOptionsBuilderclass in order to manage the multi-labels configuration. - improve
Labelsplugin in order to leverage on callbacks cache which enables the complete configuration also at default or chart type levels. - improve
LabelsOptionsBuilderclass in order to manage the multi-labels configuration. - improve
Zoomplugin in order to leverage on callbacks cache which enables the complete configuration also at default or chart type levels. - add
thresholdproperty toZoomconfiguration and options. - add
RejectedCallbackclass toZoomandPanoptions in theZoomPluginin order to manage the event when pan or zoom fail because modifier key was not detected. - add
modifierKeyproperty toPanoptions in theZoomPluginin order to enable pan only when modifier key was detected. - add
wheelModifierKeyproperty toZoomoptions in theZoomPluginin order to enable zoom only when modifier key was detected. - add
overScaleModeproperty toZoomandPanoptions in theZoomPluginin order to enable zoom only when modifier key was detected.
- remove the feature to create custom controller without extending an existing one. You can only extend existing chart type.
- change
Controllerinterface in order to be align with new interface implemented in new CHART.JS. - change the constructor signature of
ControllerTypeclass adding a mandatory argument ofControllerProviderinstance which can provide the instance of controller to register.- add an optional argument (boolean) in order to decide if the base default options of the chart which is being extended must be cloned or not.
- reduce the visibility of
registermethod ofControllerclass
- rename
extendmethod ofControllersclass toregister. - change
setHoverStyleandremoveHoverStylemethods ofControllerinterface now additionally take thedatasetIndexandindexas arguments. - remove
fontFamilyandfontStyleproperties from meter and gauge options, usefontinstead. - rename
GaugeThresholdenumeration toDefaultThreshold. - rename
MeterDisplayenumeration toRenderand move fromorg.pepstock.charba.client.impl.chartspackage toorg.pepstock.charba.client.enums. - rename
displayFontColorproperty tofontColorin meter and gauge options - rename
animatedDisplayproperty toanimatedin meter and gauge options - change the signature of
MeterFormatCallbackinterface in order to get only aMeterContextinstance as argument.
- add
linkScalesandbuildOrUpdateElementsmethods to Controller interface in order to have the complete mapping of CHART.JS controller interface. - implement easing value management for
MeterandGaugecharts (and their controller) because in the new version of CHART.JS, easing value is not provided anymore. - add
ControllerRegistrationHandlerinterface to set to aControllerTypeconstructor in order to enable the notification before and after the controller registration to CHART.JS. - add
autoFontSizeproperty to meter and gauge options in order to enable or disable auto calculation of font size and use the font size provided by the user. - add
NONEitem in theRenderenumeration in order to disable the label rendering in meter and gauge charts. - enable
fontColorproperty to be set by callback in meter and gauge charts.
- change the structure of scriptable options context.
- remove
getIndexmethod fromDatasetContextclass, use getDataIndex instead. - add type of the context.
- remove
isHovermethod fromDatasetContextclass. - rename
optionsproperty toattributesin the context classes to store custom options at runtime.
- remove
- creates new context classes based on the type of context:
- create
ChartContextclass to map the context for configuration chart callbacks, type equals tochart. - rename
ScriptableContextclass toDatasetContextto map the context for configuration datasets callbacks,datasetanddatatypes ScaleContextclass to map the context for configuration scales callbacks,scaleandticktypes.DataLabelsContextwhich is mappingdatalabelstypes, for callbacks invoked byDataLabelsPlugin.LabelsContextwhich is mappinglabelstypes, for callbacks invoked byDataLabelsPlugin.AnnotationContextwhich is mappingannotationtypes, for callbacks invoked byAnnotationPlugin.
- create
- all scriptable options are extending the
Scriptableinterface which has changed own signature, accessing only 1 argument, the context defined as generic. BackgroundColorCallbackandBorderColorCallbackclasses have been replaced byColorCallbackclass to manage whatever scriptable option which manages colors.BorderWidthCallbackclass has been replaced byWidthCallbackclass to manage whatever scriptable option which manages line widths.- rename
BorderCapStyleCallbackclass toCapStyleCallback. - rename
BorderJoinStyleCallbackclass toJoinStyleCallback. - remove
LegendCallbackinterface and its usage fromConfigurationOptionsclass because the prototype is not available anymore. - remove
hiddenattribute fromLegendItemandLegendLabelItemclasses because not supported anymore. Use newisHidden(chart)method ofLegendItemclass. - redesign of
TooltipModelclass in according with new Chart.js model. - rename
TooltipCustomCallbackclass toTooltipExternalCallbackin order to keep it aligned with CHART.JS name spaces. - rename
getValueandgetIndexmethods togetFormattedValueandgetDataIndexones inTooltipItemclass in order to be aligned with new CHART.JS tooltip item interface. - change the return value of
getTooltipmethod ofTooltipPluginItemclass, returning now aTooltipModelobject instead ofTooltipNode. - remove
xandyproperties fromTooltipItemclass. - remove
getEasingmethod fromAnimationItemclass because is not provided anymore by new animation engine. - rename
HtmlLegendTextCallbackclass toHtmlLegendItemCallback. - rename
ValueCallbacktoMeterFormatCallbackclass.- rename
setValueCallbackandgetValueCallbackofMeterOptionsclass tosetFormatCallbackandgetFormatCallback.
- rename
- change all properties of
BaseBoxItem,SizeItem,LegendHitBoxItemclasses frominttodouble.
- add
dataPointproperty toTooltipItemclass. - add
onLabelPointStylemethod toTooltipLabelCallbackinterface andTooltipLabelPointStyleclass in order to manage the point style in tooltip. - create
ItemSortCallbackinterface in order to be extended by legend and tooltip callback interfaces. - add
sortcallback (byLegendItemSortCallbackclass) to theLegendLabelsconfiguration in order to sort the legend items. - move
widthandheightoptions toBaseBoxitemclass.
- reduces the visibility of
GradientandPatternclass constructors in order to use newGradientBuilderandPatternBuilderclasses. This change avoids inconsistent gradient and pattern objects, improving some capabilities of them (like theequalsandhashCodemethods in case they will be needed).- adds
setColorsmethods (getting a list or an array ofIsColor) toGradientBuilderin order to enable the gradient creation to theColorSchemeinstances.
- adds
- add
checkAndGetValuestatic method toIsColorclass. - remove static cache for canvas patterns and gradients creation, going to a cache for each canvas object factory in order that every factory must manage own objects.
- change
toFontmethod toUtilitiesclass in order to get the weight of the font. - remove
JsWindowHelperclass. UseWindow.enableResizeOnBeforePrint(). - rename
UndefinedValuesclass toUndefined.
- add
toFontmethod toUtilitiesclass in order to get aFontobject as parameter. - add the following properties to
RegExpclass;lastIndex(static)dotAllglobalignoreCasemultilinesourcestickyunicode
- add
groupsmethod toRegExpResultin order to get the object to refer to certain token by string that a regular expression matches. - add
CSchedulerclass in order to provide asynchronous and delayed task scheduling. - add
CTimerclass in order to provide asynchronous and repeatedly task scheduling.
- change the type for some properties of LuxonOptions class:
localeis now aCLocaleobject instead of a string.numberingSystemis now aNumberingSystemobject instead of a string.zoneis now aTimeZoneobject instead of a string.outputCalendaris now aCalendarobject instead of a string.
- remove the usage of
Momentas date library because it does not use the web internationalization. - remove the usage of
Date-fnsas date library because it does not use the web internationalization.
- add
localeproperty to options and configuration. - implement INTL NumberFormat of ECMAScript Internationalization API.
- implement
CLocaleclass to manage locale objects. - implement the retrieving of locale from query string,
<meta>element (as GWT is doing) or from navigator instance.
- implement
- implement INTL DateTimeFormat of ECMAScript Internationalization API.
- change the default date adapter library, using as default
Luxoninstead ofMomentin order to enable I18N by default. - change the
Adapteroptions and configuration of time axis in order to get a date adapter options (LUXON options) bydateproperty.
- change visibility of
AbstractModelclass, now it is public. - add
@Overrideannotation to all overriding methods. - change the registering of tooltips positioner in order to apply to CHART.JS tooltips plugin.
- override the hashCode
$Hproperty forNativeObjectobjects that GWT is adding to objects in order to set the property as NOT enumerable and NOT configurable. - change
comparestatic method ofKeyinterface in order to test if the keys are valid and not only notnull. - add
JsPluginHelperclass in order to use CHART.JS registry feature to manage plugins. - create a controller template code generator and add a specific target in
build.xml. - reintroduce the
Findbugsproject in order to check the bugs on project. - reduce the visibility of objects which must get a javascript native object as argument on constructor, using an envelop. This reduces the possibility to map a native object with a wrong wrapper.
- remove
Ddataset type fromAbstractChartclass byIsDatasetCreatorinterface. - rename the controller id for
MeterandGaugecharts addingcharbaprefix in order to avoid overlapping with possible other controllers withmeterandgaugeids. Window.enableResizeOnBeforePrint()method has been fully implemented by JSINTEROP.- reduce visibility of property handler classes leveraging on the interface.
- implement
ImmutableDateclass to use to return the date value stored to chart configuration and to callbacks. - change
Travisconfiguration in order to useJDK11to compile the project and installNodeJs12in order to be compliant with new restrictions ofSonarCloud.That means that Charba is compilable also onJDK11but it will be release onJDK8in order to be consumed by applications which are still usingJDK8. - add
equalsandhashCodemethods to standard keys implementation inoptionspackage. - add
BaseLocationandBaseNavigatornative object classes to get the location and navigator fromDOM. - add
Metanative object class to map a<meta>element fromDOMdocument. - add
boolean has(Object,String)method toJsHelperclass in order to check if a property (by its key) belongs to an object or not. THis is done because CHART.JS merges objects withoutprototype, for security reason. - improve the visibility and reuse of the native object factories in order to have only 1 static instance from the object which must be created.
- improve the management of properties used cross classes or packages.
- use new location for legend, title and tooltips options, in
pluginsoptions node. - enable CI by GitHub Action, disabling Travis.
- fix font and color fallbacks to the defaults values.
- re-factor the
configurationpackage in order to manage both configuration and chart options (at runtime). - change the
NativeObjectfrom a class to an empty interface in order to skipClassCastExceptionin J2CL when the object, passed from CHART.JS, doesn't have any prototype or is a proxy. - add methods to
NativeObjectContainerin order to manage a unique internal ID, as string. - add image mime type and image quality to
toDataUrlmethods (with all combination and defaults) toCanvasobject.
Charba is available under the Apache 2.0 license.