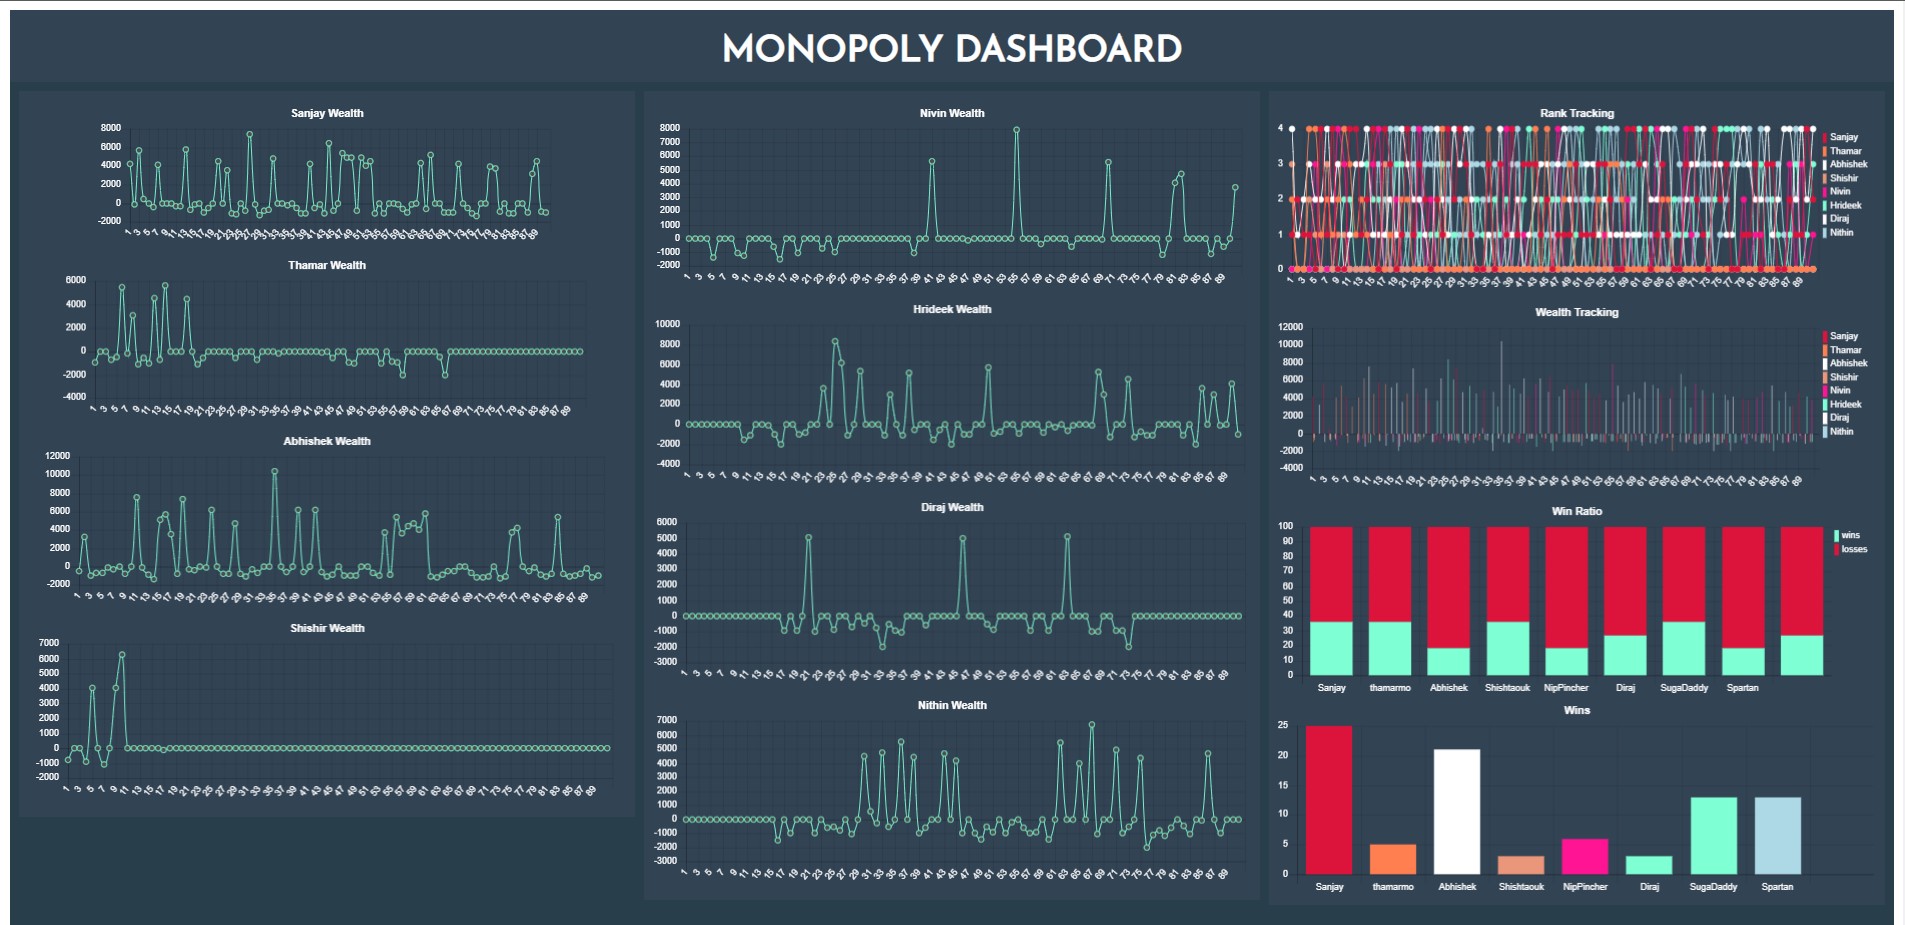
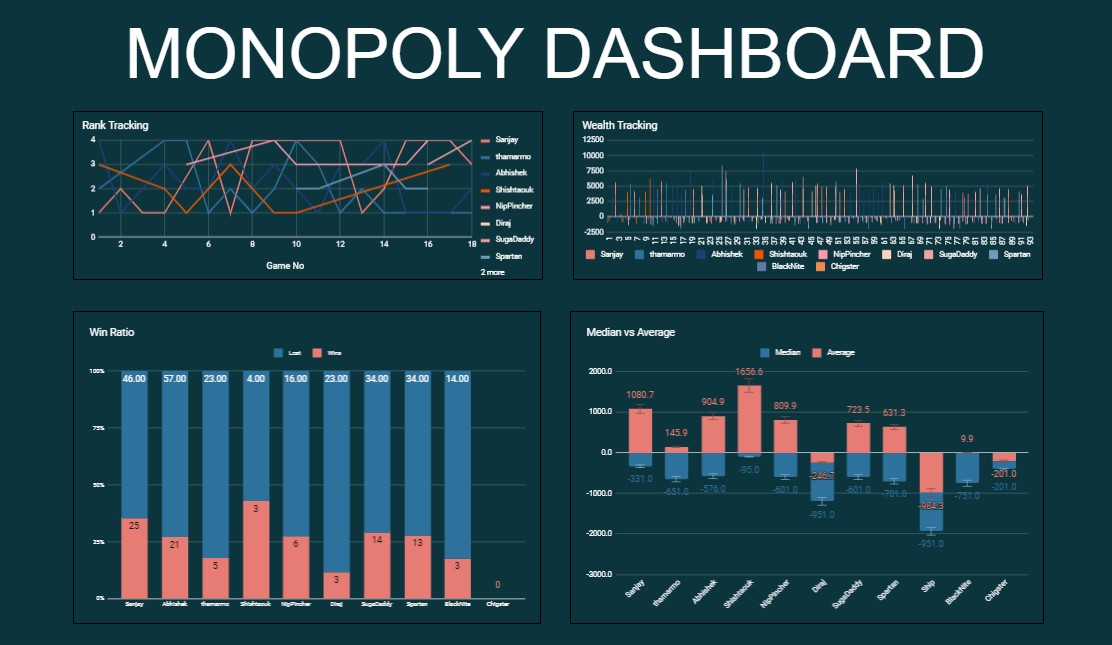
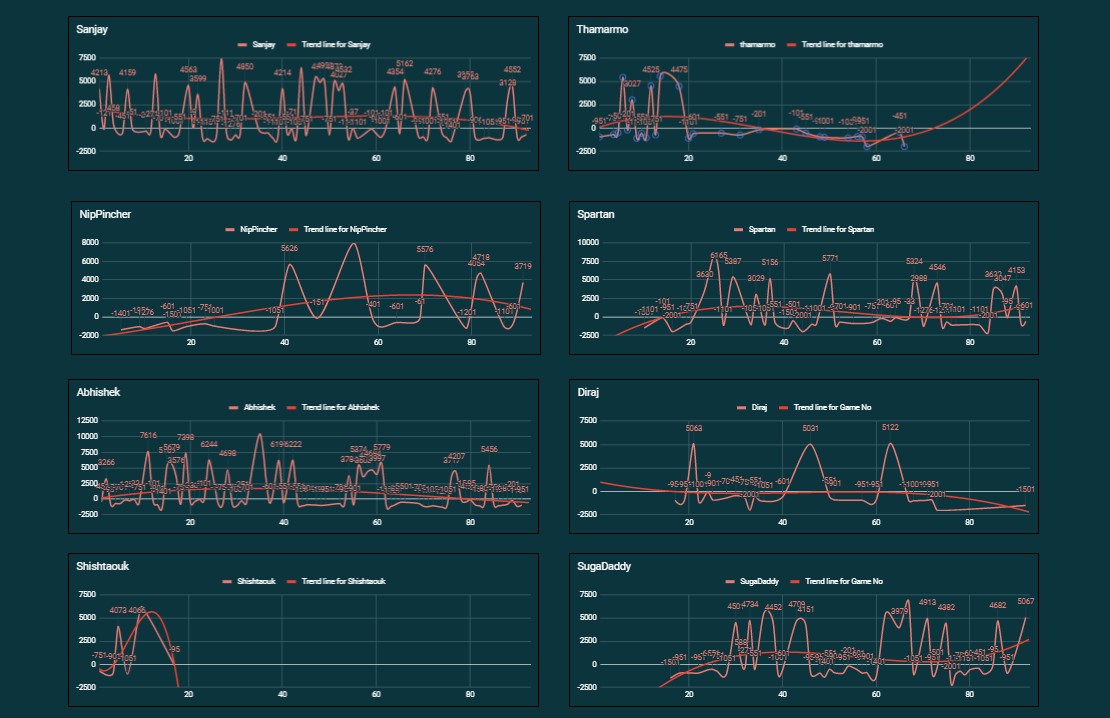
An Open-CV project to create a dashboard for the monopoly game. A screenshot of the game results is added to the resources folder and the script runs an OCR using Open-CV and pyTesseract.
Dashboard Site can be viewed here
GSheets Dashboard can be viewed here
import pytesseract
from PIL import Image
import cv2
import sys
import pandas as pd
import csv
import os#Testing conditions
test = False
if test:
latestCSV = "latest_test.csv"
dataCSV = "data_test.csv"
rankCSV = "rank_test.csv"
else:
latestCSV = "latest.csv"
dataCSV = "data.csv"
rankCSV = "rank.csv"
#Check latest file.
check = pd.read_csv(latestCSV)
latest_file = check.iloc[0,0]def newest(path):
files = os.listdir(path)
paths = [os.path.join(path, basename) for basename in files if basename.endswith('.jpg')]
return max(paths, key=os.path.getctime)
print(newest("resources"))
latest = pd.DataFrame([newest("resources")])
latest.to_csv(latestCSV,index = False)
if latest_file == newest("resources"):
sys.exit("Item has been appended")
else:
print("This will be appended")resources\Screenshot_20200702-173925 - Copy (2).jpg
This will be appended
file_path= newest("resources")
im = Image.open(file_path)
im.save("raw.jpg", dpi=(300, 300))im#Make image b&w.
im = Image.open("raw.jpg").convert("L")
im.save("bw.jpg")
readImage = cv2.imread("bw.jpg")
#Invert colour chanels.
invertImage = cv2.bitwise_not(readImage)imimport matplotlib.pyplot as plt
fig, ax = plt.subplots(figsize=(16, 8))
img2 = invertImage[:,:,::-1]
ax.imshow(img2)<matplotlib.image.AxesImage at 0x1b3623f4d88>
cropName_1 = invertImage[428:478,683:970]
cropName_2 = invertImage[645:700,683:970]
cropName_3 = invertImage[869:918,683:970]
cropName_4 = invertImage[1086:1136,683:970]

#Global Crop width for wealth except first value.
wStart = 2085
wEnd = 2225

#Global variables for threshold value.
tn = 25
tw = 28
cropList = [cropName_1,cropName_2,cropName_3,cropName_4]
def plotImages(list):
w=10
h=10
fig=plt.figure(figsize=(8, 8))
columns = 1
rows = 4
for i in range(1, columns*rows +1):
img = list[i-1]
fig.add_subplot(rows, columns, i)
plt.imshow(img)
plt.show()
plotImages(cropList)cropWealth_1 = invertImage[360:430,2065:wEnd]
cropWealth_2 = invertImage[570:655,wStart:wEnd]
cropWealth_3 = invertImage[790:870,wStart:wEnd]
cropWealth_4 = invertImage[1010:1100,wStart:wEnd]cropList = [cropWealth_1,cropWealth_2,cropWealth_3,cropWealth_4]
plotImages(cropList)retval, thresholdName_1 = cv2.threshold(cropName_1,tn,255,cv2.THRESH_BINARY)
retval, thresholdName_2 = cv2.threshold(cropName_2,tn,255,cv2.THRESH_BINARY)
retval, thresholdName_3 = cv2.threshold(cropName_3,tn,255,cv2.THRESH_BINARY)
retval, thresholdName_4 = cv2.threshold(cropName_4,tn,255,cv2.THRESH_BINARY)cropList = [thresholdName_1,thresholdName_2,thresholdName_3,thresholdName_4]
plotImages(cropList)retval, thresholdWealth_1 = cv2.threshold(cropWealth_1,tw,255,cv2.THRESH_BINARY)
retval, thresholdWealth_2 = cv2.threshold(cropWealth_2,tw,255,cv2.THRESH_BINARY)
retval, thresholdWealth_3 = cv2.threshold(cropWealth_3,tw,255,cv2.THRESH_BINARY)
retval, thresholdWealth_4 = cv2.threshold(cropWealth_4,tw,255,cv2.THRESH_BINARY)cropList = [thresholdWealth_1,thresholdWealth_2,thresholdWealth_3,thresholdWealth_4]
plotImages(cropList)"""
cv2.imwrite("w1.jpg",thresholdWealth_1)
cv2.imwrite("w2.jpg",thresholdWealth_2)
cv2.imwrite("w3.jpg",thresholdWealth_3)
cv2.imwrite("w4.jpg",thresholdWealth_4)
"""'\ncv2.imwrite("w1.jpg",thresholdWealth_1)\ncv2.imwrite("w2.jpg",thresholdWealth_2)\ncv2.imwrite("w3.jpg",thresholdWealth_3)\ncv2.imwrite("w4.jpg",thresholdWealth_4)\n'
name_1 = pytesseract.image_to_string(thresholdName_1)
name_2 = pytesseract.image_to_string(thresholdName_2)
name_3 = pytesseract.image_to_string(thresholdName_3)
name_4 = pytesseract.image_to_string(thresholdName_4)custom_config = r'--oem 3 --psm 6 outputbase digits'
wealth_1 = pytesseract.image_to_string(thresholdWealth_1, config=custom_config)
wealth_2 = pytesseract.image_to_string(thresholdWealth_2, config=custom_config)
wealth_3 = pytesseract.image_to_string(thresholdWealth_3, config=custom_config)
wealth_4 = pytesseract.image_to_string(thresholdWealth_4, config=custom_config)wealth_1 = int(wealth_1)
wealth_2 = -abs(int(wealth_2))
wealth_3 = -abs(int(wealth_3))
wealth_4 = -abs(int(wealth_4))#Add read data to csv.
data = pd.read_csv(dataCSV)
names = ["Game No",name_1,name_2,name_3,name_4]
wealths = [(len(data["Game No"])+1),wealth_1,wealth_2,wealth_3,wealth_4]
ocrData = pd.DataFrame([wealths],columns=names)
mergedData_wealth = pd.concat([data, ocrData], join = "outer")
mergedData_wealth.to_csv(dataCSV, index=False)
#Add ranks to csv.
data_r = pd.read_csv(rankCSV)rank_1 = 1
rank_2 = 2
rank_3 = 3
rank_4 = 4
ranks = [(len(data_r["Game No"])+1),rank_1,rank_2,rank_3,rank_4]
ocrRank = pd.DataFrame([ranks],columns=names)
mergedData_rank = pd.concat([data_r, ocrRank], join = "outer")
mergedData_rank.to_csv(rankCSV, index=False)#Calculate wins and win-ratio
players = ["Sanjay", "thamarmo", "Abhishek", "Shishtaouk", "NipPincher", "Diraj", "SugaDaddy", "Spartan"]
data_r = pd.read_csv(rankCSV)
winRatio = []
wins =[]
played = []
losses = []for i in players:
gamesPlayed= data_r[i].value_counts().sum()
played.append(gamesPlayed)
if 1 in data_r[i].unique():
win = data_r[i].value_counts()[1]
wins.append(win)
wr = ((win/gamesPlayed*100).round(2))
winRatio.append(wr)
else:
winRatio.append(0)
wins.append(0)
for i in range(len(played)):
losses.append(played[i]-wins[i])
winLoss = pd.DataFrame(list(zip(players, wins, played,losses,winRatio)),
columns =['Names', 'Wins', 'Played', 'Lost', 'winRatio'])
winLoss.to_csv(r'winLoss.csv', index = False) winLoss
<style scoped>
.dataframe tbody tr th:only-of-type {
vertical-align: middle;
}
</style>
.dataframe tbody tr th {
    vertical-align: top;
}

.dataframe thead th {
    text-align: right;
}
| Names | Wins | Played | Lost | winRatio | |
|---|---|---|---|---|---|
| 0 | Sanjay | 25 | 71 | 46 | 35.21 |
| 1 | thamarmo | 5 | 28 | 23 | 17.86 |
| 2 | Abhishek | 21 | 78 | 57 | 26.92 |
| 3 | Shishtaouk | 3 | 7 | 4 | 42.86 |
| 4 | NipPincher | 6 | 22 | 16 | 27.27 |
| 5 | Diraj | 3 | 26 | 23 | 11.54 |
| 6 | SugaDaddy | 14 | 48 | 34 | 29.17 |
| 7 | Spartan | 13 | 47 | 34 | 27.66 |


