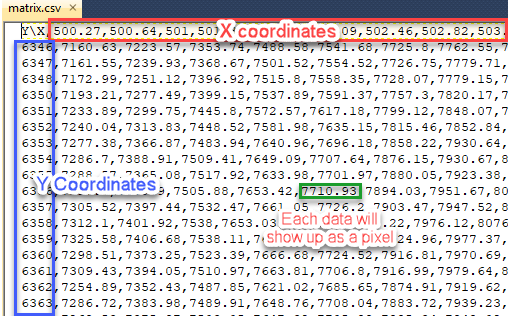
- First row must contain x coordinates whether it is ascending or descending
- First column must contain y coordinates whether it is ascending or descending
- Each data point will show up as one pixel
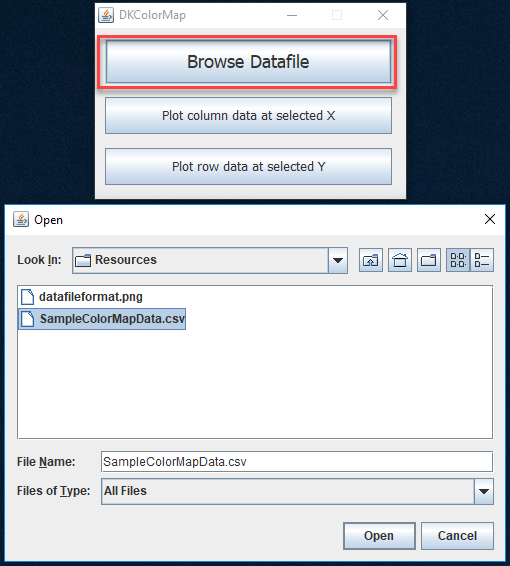
- Press "Browse Datafile" and select the file to plot
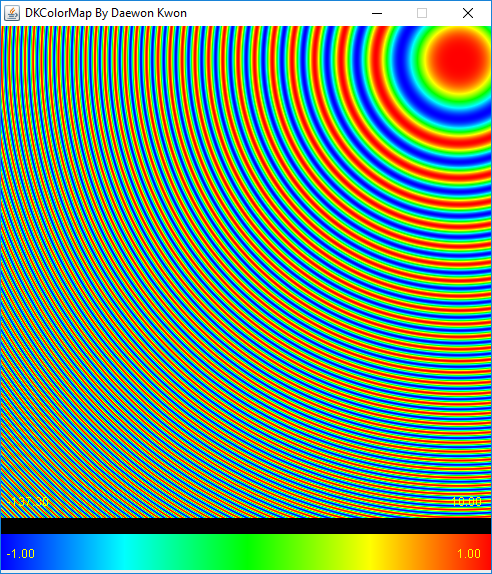
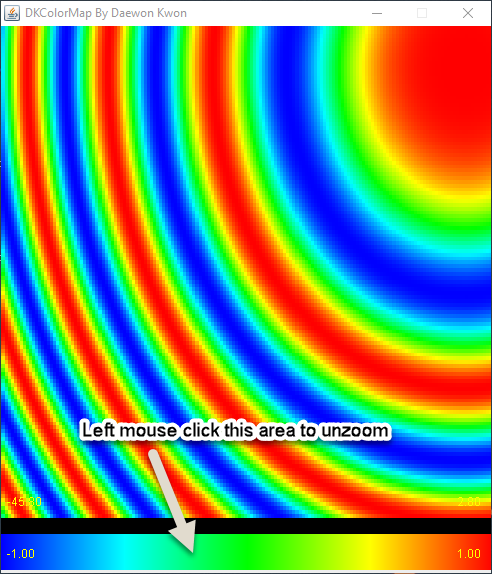
- Press and hold left mouse button and drag to zoom
- Click left mouse button on outside of plotting area to unzoom
- Press left mouse button on where you want to inspect in detail
- Coordinate information will show up on the bottom
- Press "Plot column data at selected X" to plot Z vs Y graph at the selected location
- Press "Plot row data at selected Y" to plot Z vs X graph at the selected location
Daewon Kwon © 2019. All Rights Reserved.


