skohari / easyPlot

A Simple Graphical User Interface for ggplot2

Home Page:www.michalm.net/shiny/easyPlot/

Geek Repo:Geek Repo

Github PK Tool:Github PK Tool

easyPlot

Overview

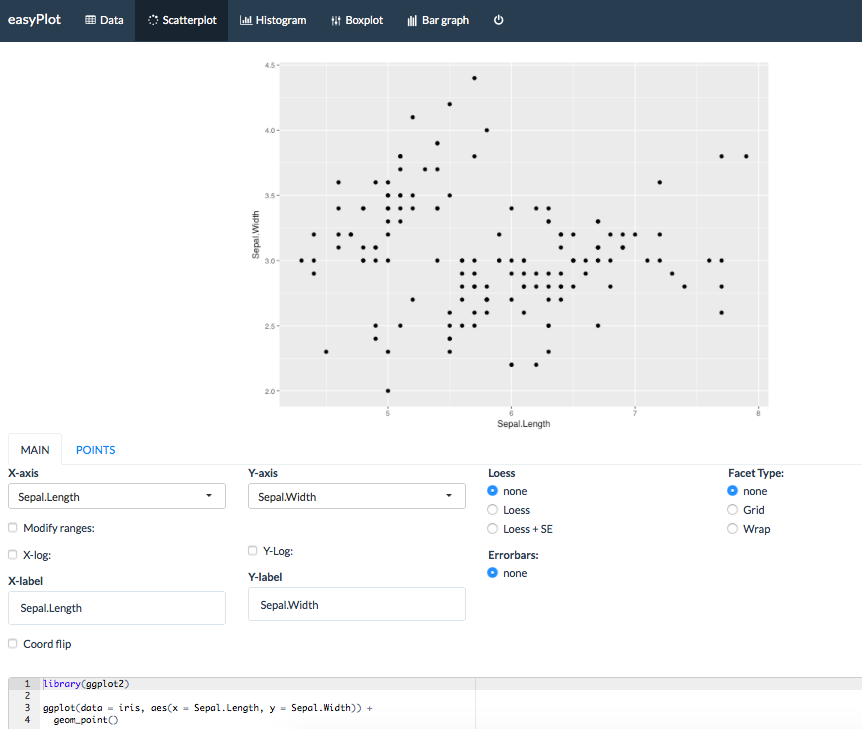
easyPlot is a simple graphical user interface for ggplot2 which allows the user to create four kind of plots (scatterplots, histograms, boxplots and bar charts) and dynamically generates a reproducible code.

Installation

devtools::install_github("majkamichal/easyPlot")

Usage

easyPlot::easyPlot()

easyPlot::easyPlot("iris")
About

A Simple Graphical User Interface for ggplot2

www.michalm.net/shiny/easyPlot/

License:GNU General Public License v3.0


Languages

Language:R 98.9%Language:CSS 1.1%