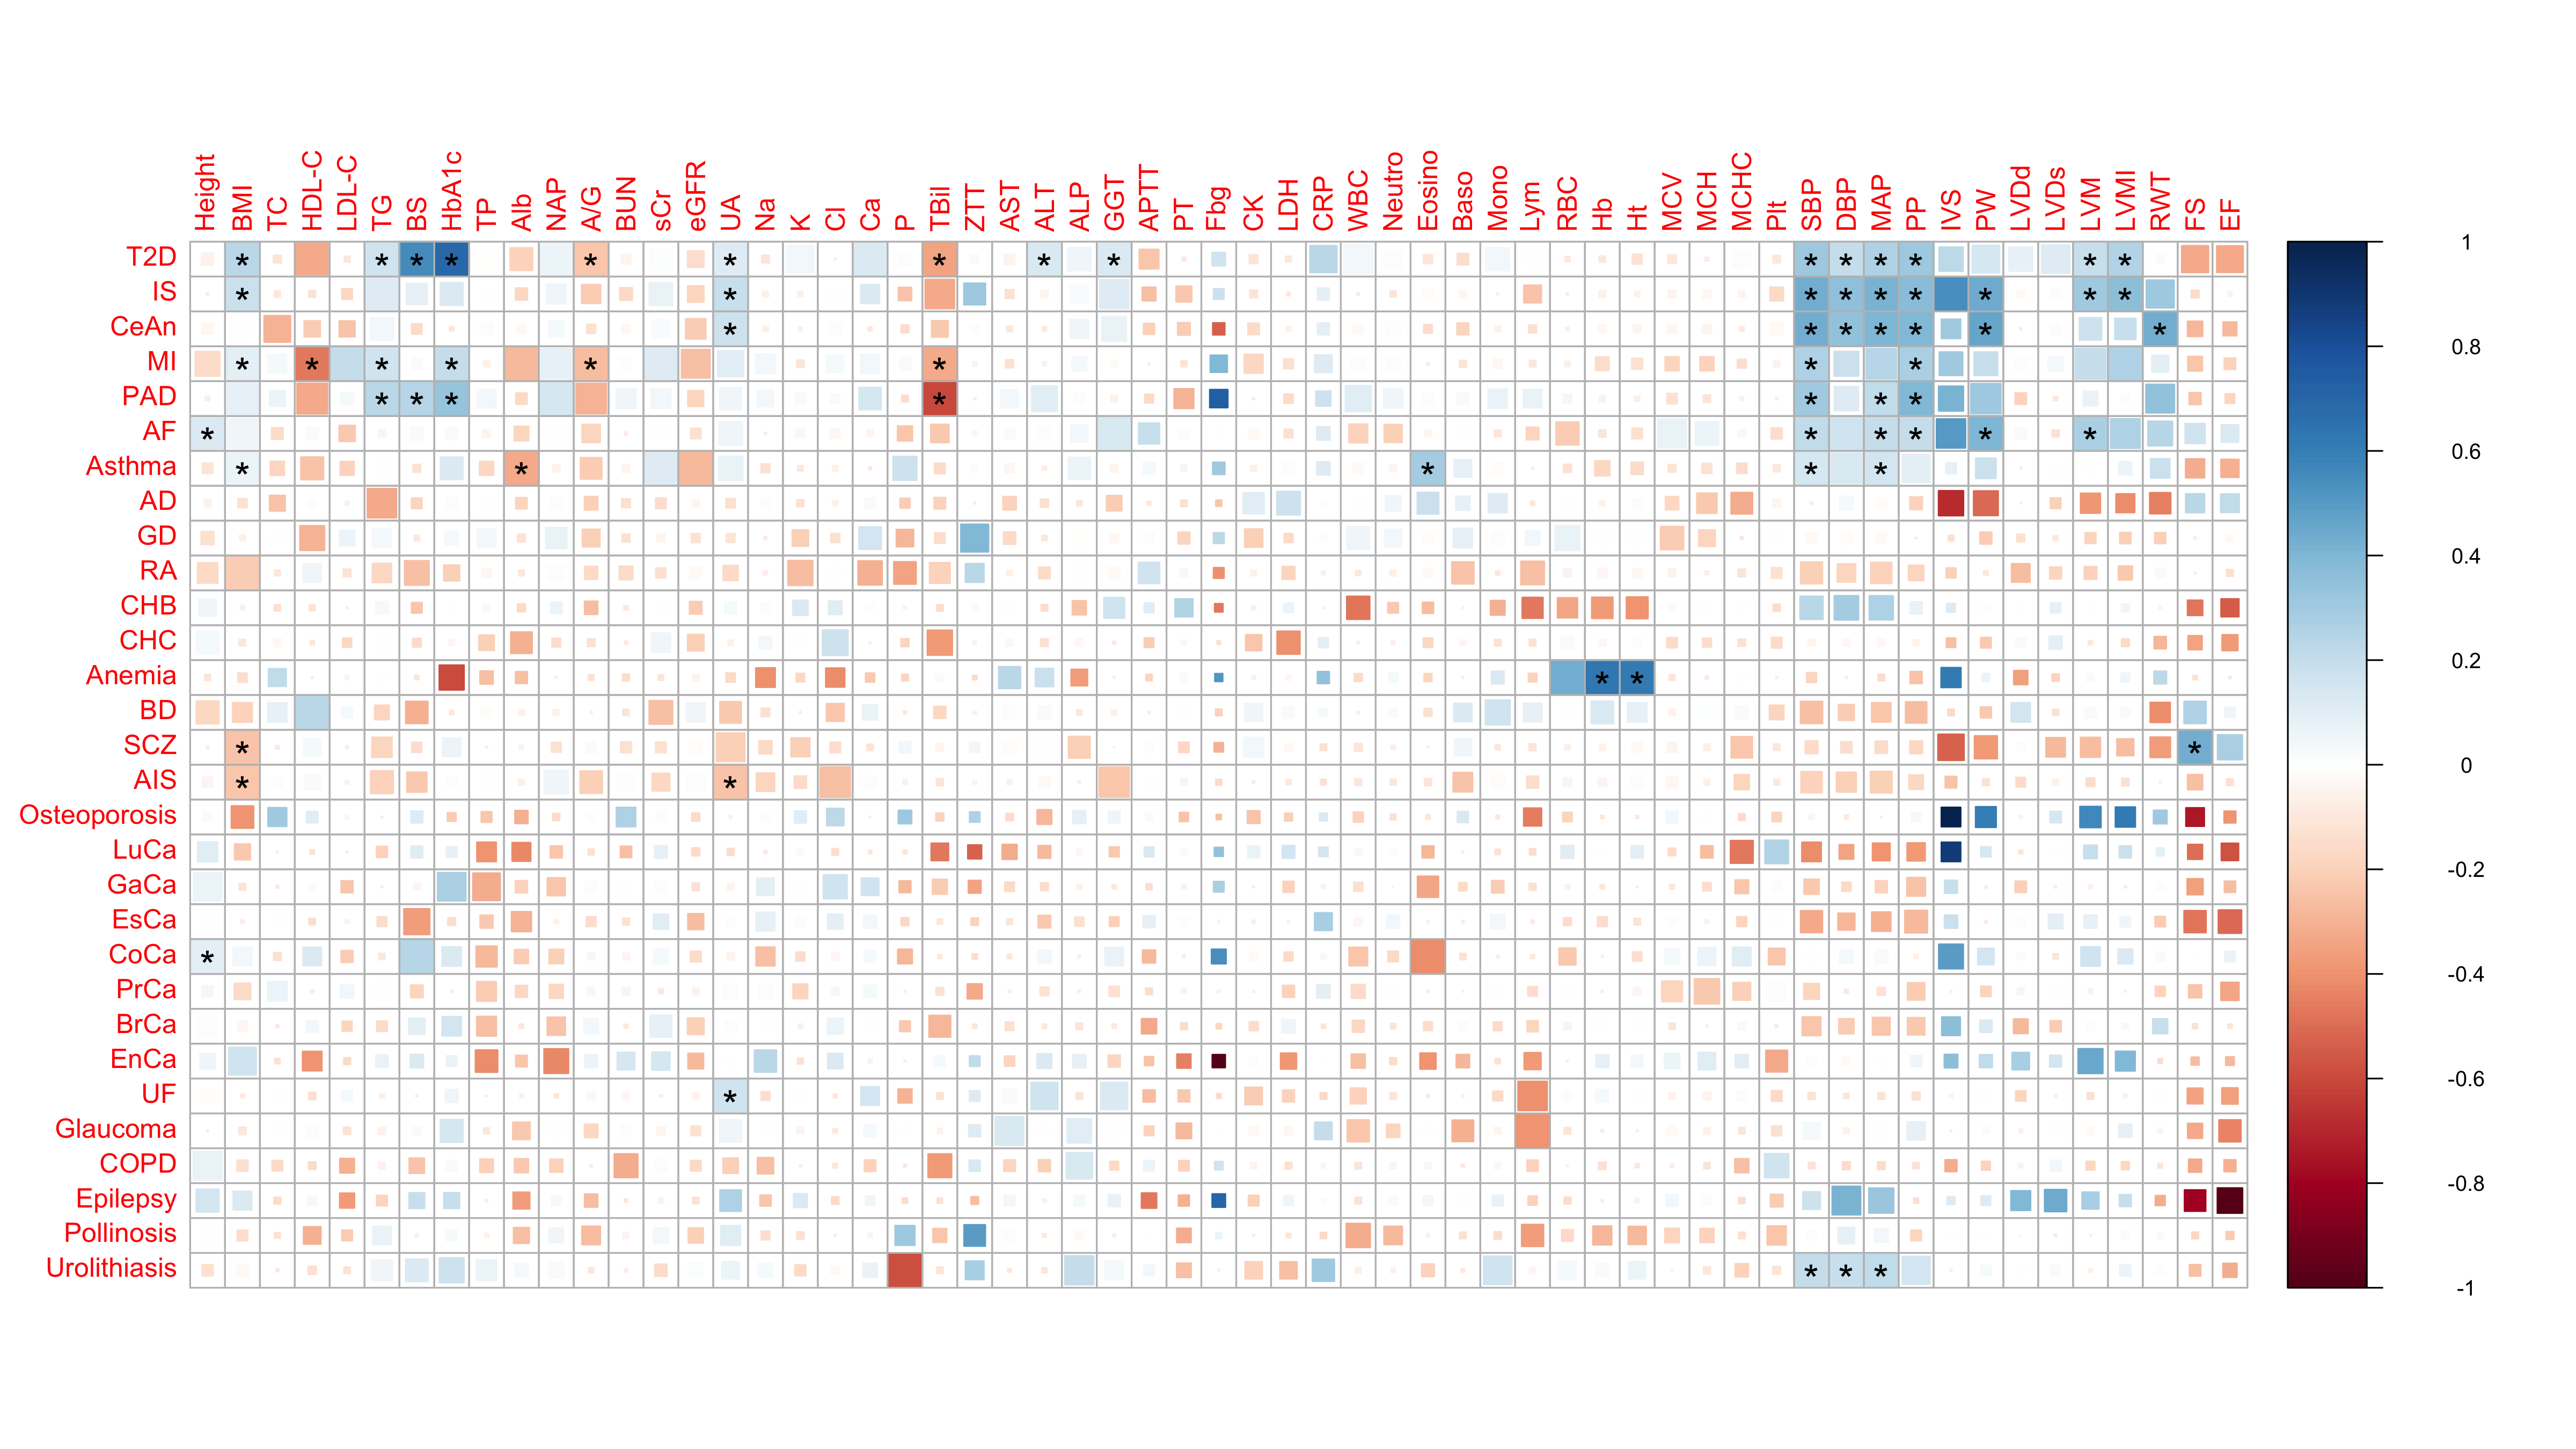
corrplot of LDSC genetic correlation results
Overview
This repo provides our script to reproduce genetic correlation corrplot (Fig. 2) based on bivariate LD score regression results (Kanai, M. et al., Nat. Genet. 2018).
Requirements
install.packages("dplyr")
devtools::install_github("mkanai/corrplot")
Genetic correlation plot (Fig. 2)
We modified corrplot to visualize pairwise genetic correlations estimated via bivariate LD score regression. Larger squares correspond to more significant FDRs (corrplot(method = 'psquare', p.mat = p.mat, ...)). Significant correlations (FDR < 0.05) are indicated by asterisks (corrplot(sig = 'pch', sig.level = 0.05, pch = '*')).
Usage
Rscript plot_corrplot_rg.R input_example/input_rg.txt input_example/traitlist.txt
Input: Genetic correlations (input_rg.txt)
This file provides a list of all pairwise genetic correlations estimated via ldsc software. The script expects all rows are unique (i.e., one row per each pair of traits). The required fields are as follows:
p1_category: Trait category of trait 1p1: Trait 1p2_category: Trait category of trait 2p2: Trait 2rg: Genetic correlationp: P-valueq: FDR q-value
Input: Trait list (traitlist.txt)
This file provides a list of traits and their categories. It defines a color of each category in a figure. The required fields are as follows:
CATEGORY: Trait categoryTRAIT: Trait nameCOLOR: Category color
Output
An example output is shown below. To get the published figure, we edited a pdf output using Adobe Illustrator.
Citation
The original corrplot package:
- Taiyun Wei and Viliam Simko. R package "corrplot": Visualization of a Correlation Matrix (Version 0.85). (2018) Available from https://github.com/taiyun/corrplot.
The example data and published figure:
- Kanai, M., et al. Genetic analysis of quantitative traits in the Japanese population links cell types to complex human diseases. Nat. Genet. 50, 390–400 (2018). doi:10.1038/s41588-018-0047-6
Contact
Masahiro Kanai (mkanai@g.harvard.edu)

