GDAC Capstone
This is the capstone project for the Google Data Analytics Certificate available through Coursera
For my capstone, I chose to complete Track 1 with the Cyclistic bike-share case study.
Background information about the case study can be found in the info
folder.
Note About Code: I tried to included the package name the first time
I use a function. Like this rio::import.
Question to Answer
How do annual Member and Casual Riders use Cyclistic bikes differently?
You will produce a report with the following deliverables:
- A clear statement of the business task
- A description of all data sources used
- Documentation of any cleaning or manipulation of data
- A summary of your analysis
- Supporting visualizations and key findings
- Your top three recommendations based on your analysis
Business Task
The business task is to compare Casual and Member Riders to help develop a strategy to convert Casual Riders to Member Riders.
Data Source:
This data is made available by Divvy Bikes for use, the name of the company has just been changed. Data is available here.
# import 1 file to see structure
march_2021 <- rio::import(here::here("bike_data", "202103-divvy-tripdata.csv"),
                          setclass = "tibble")

# create list of all file names
bike_files <- list.files(here("bike_data"), pattern = ".csv", full.names = TRUE)

# import all files and combine into one tibble
bikes_raw <- bike_files %>%
  lapply(import, setclass = "tibble") %>%
  dplyr::bind_rows()

rio::export(bikes, file = here("bike_data", "all_bikes.rds"))
Data Wrangling
bikes <- bikes_raw %>%
  dplyr::mutate(ride_length = as.numeric(difftime(ended_at, started_at, units = "mins")),
                day = lubridate::wday(started_at, label = TRUE)) %>%
  mutate(member_casual = case_when(member_casual == "casual" ~ "Casual",
                                   TRUE ~ "Member"))

bikes_sum <- bikes %>%
  dplyr::group_by(member_casual) %>%
  dplyr::summarize(number = n(), across(ride_length, mean))

bike_sum2 <- bikes %>%
  group_by(day, member_casual) %>%
  summarize(number = n(), across(ride_length, mean))
Comparing Casual and Member Riders
(sum_gt <- bikes_sum %>%
  gt::gt() %>%
  gt::cols_label(member_casual = md("Membership Type<br> "),
                 number = md("Number of Rides<br> "),
                 ride_length = md("Average Ride Length<br>(minutes)")) %>%
  gt::cols_width(everything() ~ px(120)) %>%
  cols_width(3 ~ px(200)) %>%
  gt::cols_align(everything(), align = "center") %>%
  gt::fmt_number(columns = 2, decimals = 0) %>%
  gt::fmt_number(columns = 3, decimals = 2) %>%
  gtExtras::gt_theme_guardian()
)

gt::gtsave(sum_gt, here("outputs", "membership_comparison.png"))
While there were more rides by Members in the past year, the average ride length for Casual Riders was 2.4 times longer than that of Member Riders.
(sum_gg <- bike_sum2 %>%
  ggplot(aes(day, number, fill = member_casual)) +
  geom_line(aes(group = member_casual),
            alpha = 0.25, size = 0.5, show.legend = FALSE) +
  geom_point(aes(size = ride_length), shape = 21,
             color = "black", show.legend = FALSE) +
  scale_y_continuous(labels = scales::comma_format()) +
  scale_fill_manual(values = c("#E84D45", "#A1BAAC")) +
  annotate(geom = "text", color = "#A1BAAC",
           x = 3.5, y = 500000, size = 6,
           label = "Member Riders") +
  annotate(geom = "text", color = "#E84D45",
           x = 3.5, y = 300000, size = 6,
           label = "Casual Riders") +
  labs(x = NULL, y = NULL,
       title = "Number of Riders Per Day of the Week",
       subtitle = "  Larger Circles Indicate Longer Rides") +
  theme_bw() +
  theme(plot.title.position = "plot",
        text = element_text(size = 17),
        panel.grid.minor = element_blank())
)

ggsave(sum_gg, filename = here("outputs", "comparison_plot.png"))
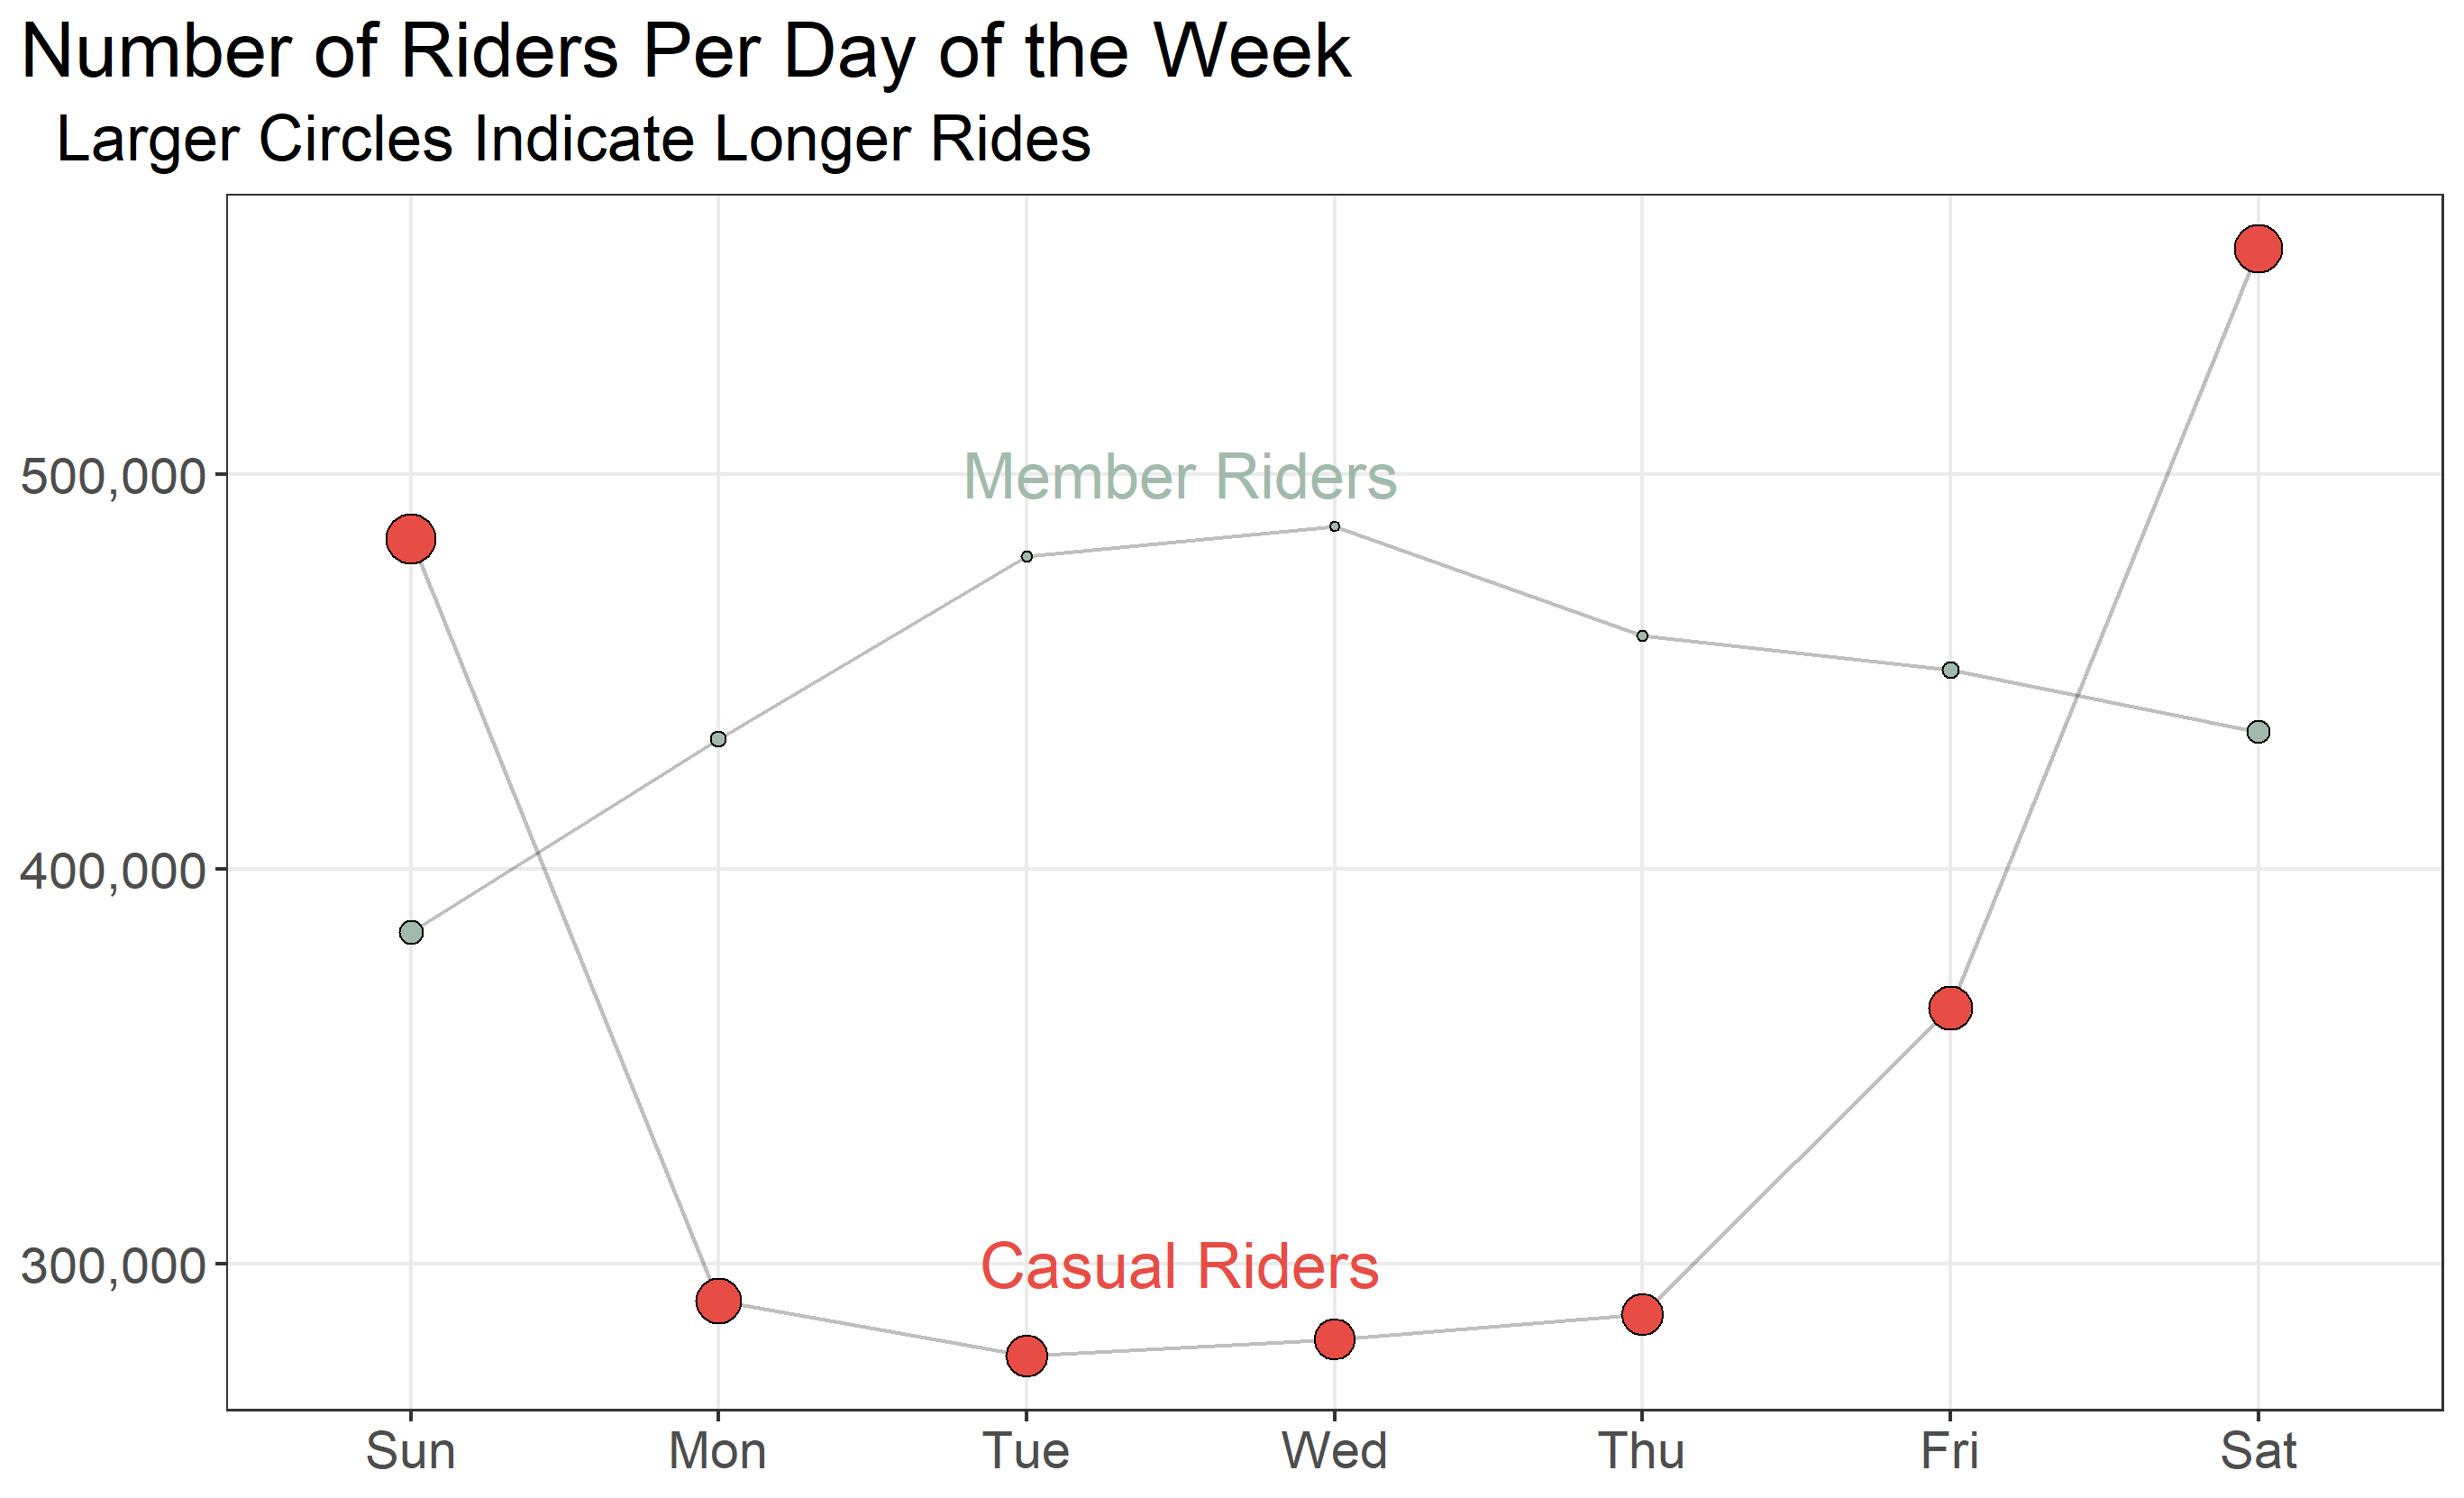
Member Riders primarily rode during the week, and had shorter rides. In contrast, Casual Riders primarily rode on the weekends, and the rides were longer.
Recommendations
Based on this analysis, I recommend the following possible implementations:
-
A shorter time for Casual Riders before they have to pay an additional fee. This could incentivize frequent Casual Riders to upgrade to Member Riders.
-
A promotion for Casual Riders to have cheaper rates on the weekend.
-
A different pricing strategy that incentivizes Casual Riders to convert to Member Riders if they do ride during the week.

