There are only two prerequisites:
docker-compose up --build -ddocker-compose downWhen running containers with detached mode (-d) they work in the background thus you can't see the flowing logs. If you want to check compose logs with cli you can use logs.
docker-compose logs --tail 50There is a single endpoint for the prediction. You can find the endpoint in the endpoints.py file. It takes a json input and returns a prediction as a json response.
Prometheus is used for monitoring. You can find the prometheus config in the monitoring/prometheus.yml file. It scrapes the metrics from the API container.
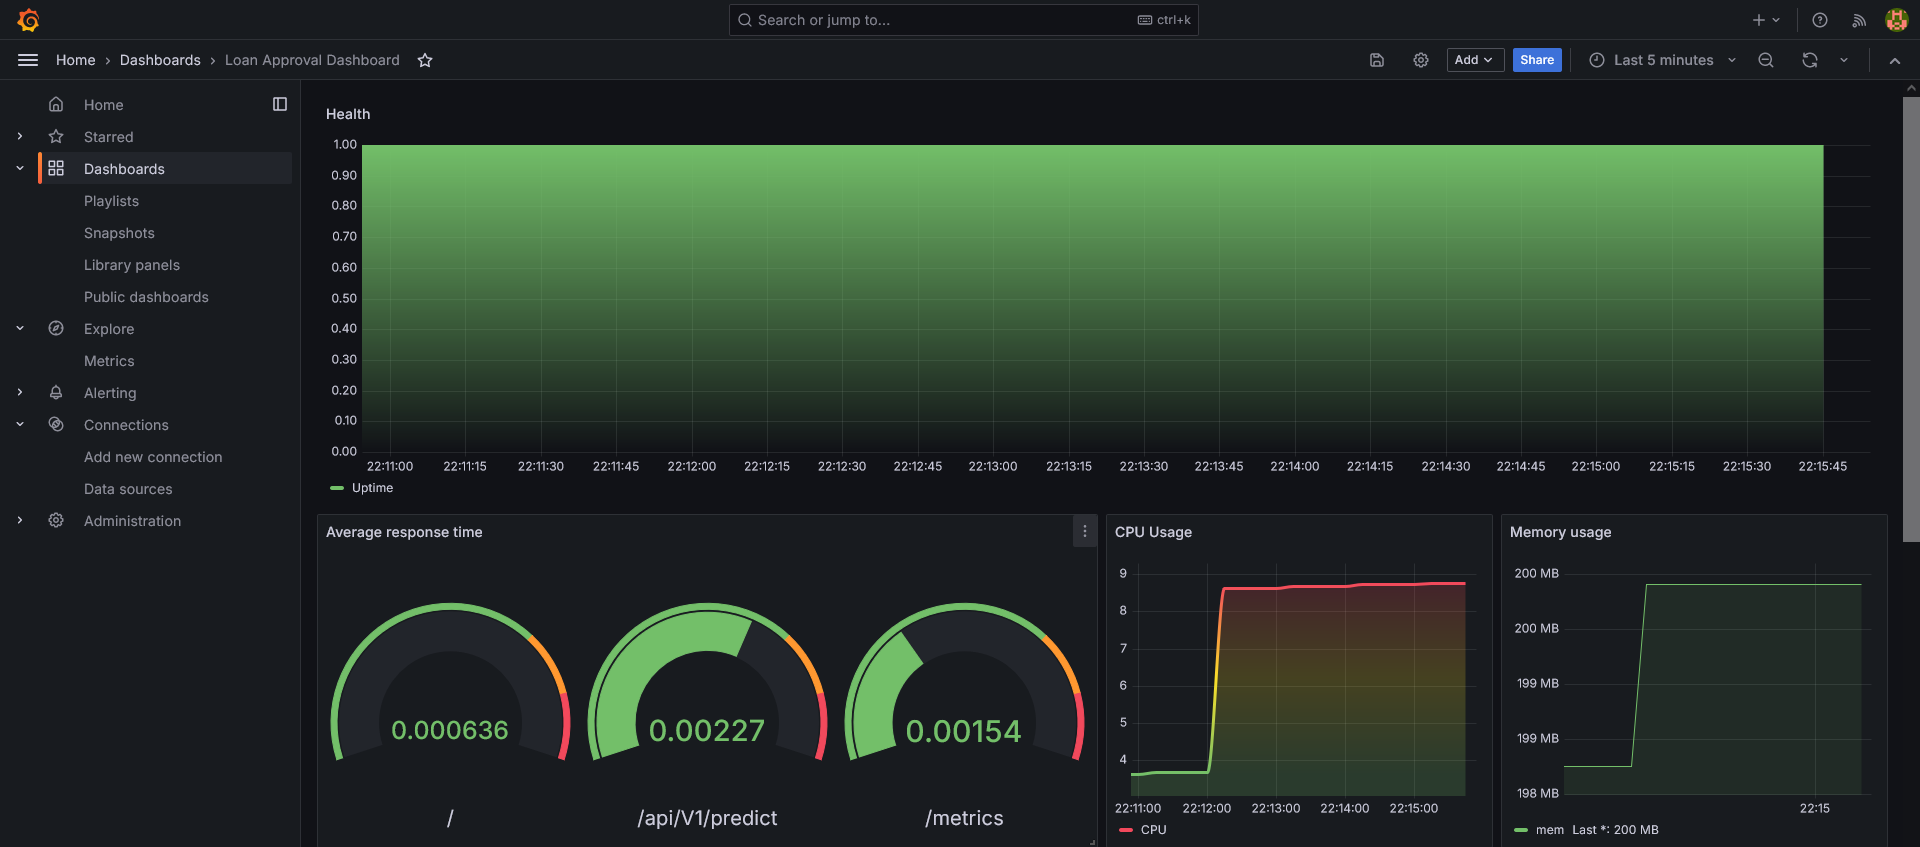
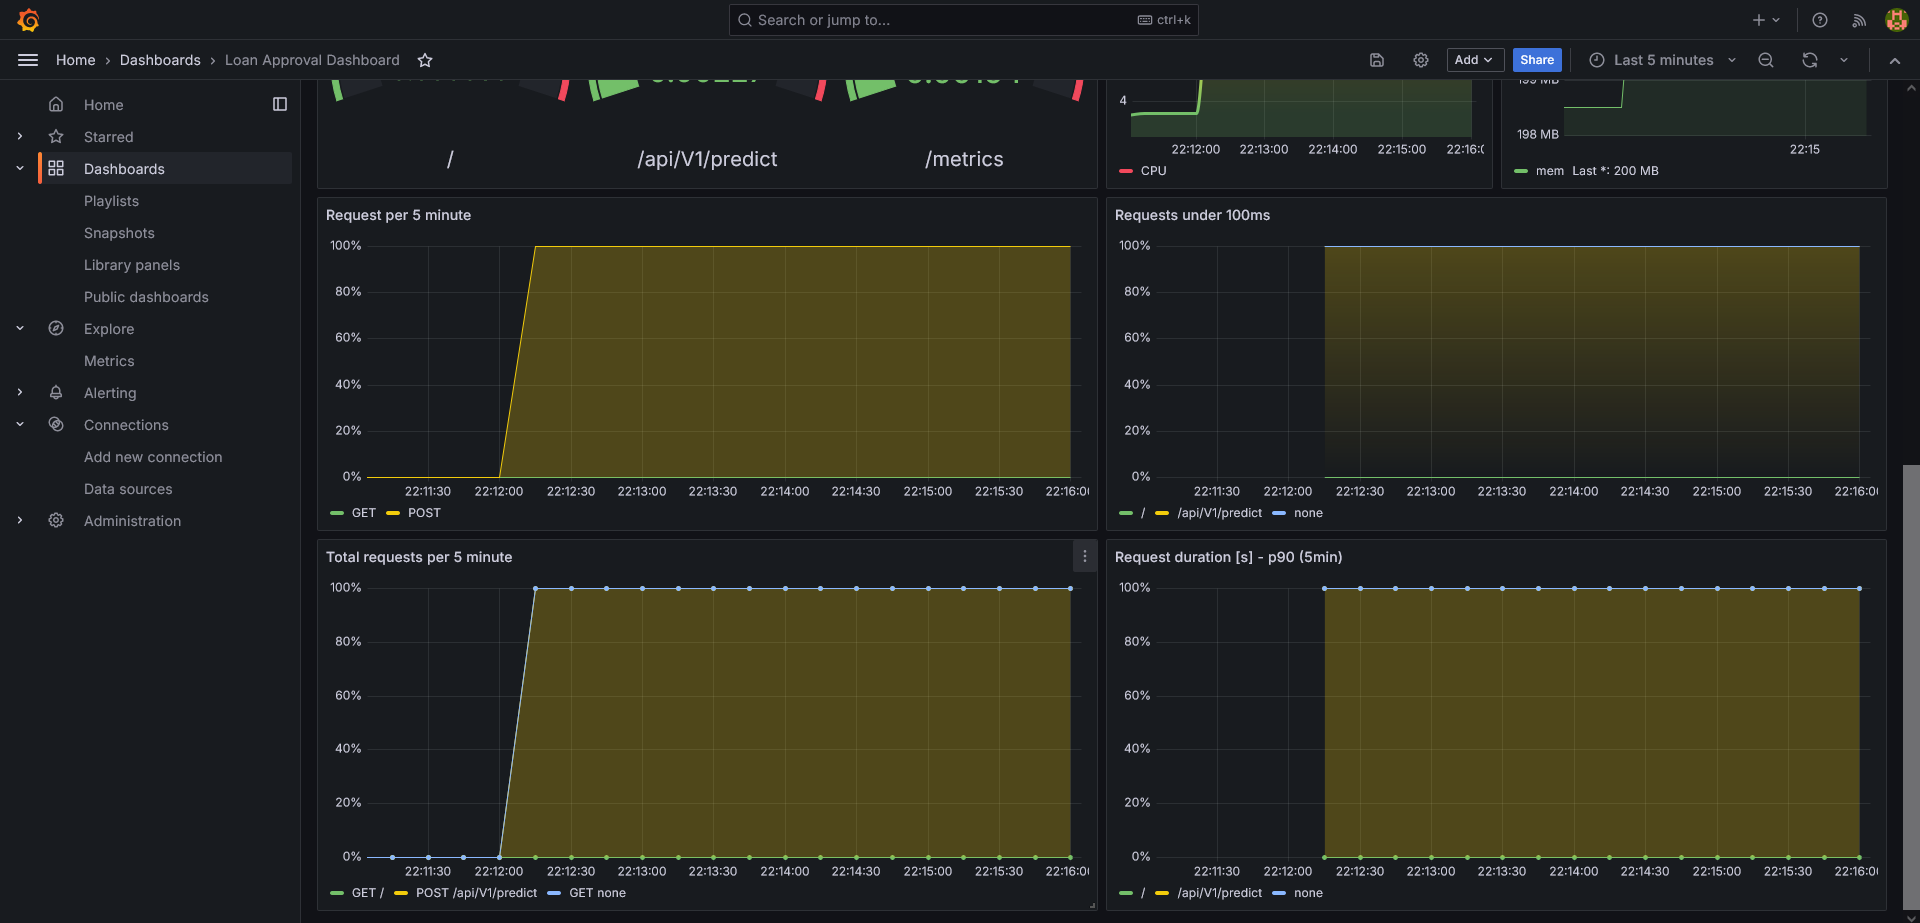
Grafana is used for visualization. You can find the dashboard in the provisioning/dashboards/dashboard.json file. It visualizes the metrics from the prometheus.
Graphana login credentials: user: admin password: pass
- FastAPI: http://localhost:8000
- Prometheus: http://localhost:9090
- Grafana: http://localhost:3000
Click to hide/unhide the folder structure.
├── api.py
├── data
│   └── loan_approval_dataset.csv
├── docker-compose.yml
├── load_test
│   ├── data.py
│   └── locustfile.py
├── ml_engineer_case.pdf
├── model
│   └── model.txt
├── monitoring
│   ├── config.monitoring
│   └── prometheus.yml
├── notebooks
│   ├── eda.ipynb
│   ├── modelling.ipynb
│   └── test.ipynb
├── provisioning
│   ├── dashboards
│   │   ├── dashboard.json
│   │   └── dashboard.yaml
│   └── datasources
│       └── datasource.yml
├── readme.md
├── requirements.txt
├── src
│   ├── Dockerfile.app
│   ├── config.py
│   ├── datamodel.py
│   ├── endpoints.py
│   └── utils.py
└── tests
    ├── __init__.py
    ├── pytest.ini
    └── test_main.py